Genetic and Environmental Sources of Variation
in the Autogenous Chemical Defense of a Leaf Beetle
Y. Triponez&R. E. Naisbit&J. B. Jean-Denis& M. Rahier&N. Alvarez
Received: 2 April 2007 / Revised: 26 June 2007 / Accepted: 20 August 2007 / Published online: 21 September 2007
# Springer Science + Business Media, LLC 2007
Abstract Chemical defense plays a central role for many herbivorous insects in their interactions with predators and host plants. The leaf beetle genus Oreina (Coleoptera, Chrysomelidae) includes species able to both sequester pyrrolizidine alkaloids and autogenously produce cardenolides. Sequestered compounds are clearly related to patterns of host-plant use, but variation in de novo synthesized cardenolides is less obviously linked to the environment. In this study, intraspecific variation in cardenolide composition was examined by HPLC–MS analysis in 18 populations of Oreina speciosa spanning Europe from the Massif Central to the Balkans. This revealed the defense secretion to be a complex blend of up to 42 compounds per population. There was considerable geographical variation in the total sample of 50 compounds detected, with only 14 found in all sites. The environmental and genetic influences on defense chemistry were investigated by correlation with distance matrices based on habitat factors, host-plant use, and genetics (sequence data from COI, COII, and 16s rRNA). This demonstrated an influence of both genetics and host-plant use on the overall blend of cardenolides and on the presence of some of the individual compounds. The implications of this result are discussed for the evolution of defense chemistry and for the use of cardenolide compounds as markers of the evolutionary history of the species.
Keywords Chrysomelidae . Oreina speciosa . Chemical defense . Cardenolides . Intraspecific variation . Host-plant use . Genetic constraints . HPLC–MS
Triponez and Naisbit contributed equally to this work and are considered joint first authors. Y. Triponez (*)
:
R. E. Naisbit:
M. Rahier:
N. AlvarezLaboratoire d’Entomologie Evolutive, Institut de Biologie, Université de Neuchâtel, Rue Emile-Argand 11, CP 158, CH-2009 Neuchâtel, Switzerland
e-mail: [email protected] J. B. Jean-Denis
Institut de Chimie, Université de Neuchâtel, Rue Emile-Argand 11, CP 158, CH-2009 Neuchâtel, Switzerland
Introduction
Chemical defenses are widely distributed in insects and play a crucial role for their protection against attack by predators (Spencer1988; Trigo2000; Ruxton et al.2004). They can act in a direct way on the predator by inflicting pain or poisoning, or indirectly by association with aposematism (Ruxton et al. 2004). Although many of the defensive chemicals of phytophagous insects are toxins sequestered directly from the host plant on which the larva or adult feeds (Duffey 1980; Rowell-Rahier et al. 1991; Nishida 2002), insects can also synthesize de novo their own toxins ( Pasteels et al.1992; Mardulyn et al.
1997; Feld et al. 2001; Hartmann et al. 2004; Soe et al. 2004). We are beginning to understand the importance of diversity in defense chemistry. For instance, differences in chemistry between mimetic species may promote learning by predators (Skelhorn and Rowe 2005). Variation in the levels of defense within a species (resulting in the phenomenon of automimicry) is often associated with costly forms of defense (Bowers
1992; Fordyce et al.2006). Much less is known about the sources of intraspecific variation in the composition of defense chemistry. For sequestered compounds, there is evidence for geographical variation in both the concentration and composition of defenses, often associated with shifts in host-plant use (Kopf et al. 1998; Moranz and Brower 1998; Wahlberg 2001). However, when the defense chemicals are synthesized by the insects themselves, the level of variation and its ultimate explanation still remain unknown. In this study, we examined the extent to which (1) environmental conditions and (2) genetic inheritance modify the composition of the defense secretion in an alpine leaf beetle.
The phytophagous genus Oreina Chevrolat (Coleoptera: Chrysomelidae) includes 25 species found throughout the mountain regions of Europe with some incursions into the lowlands and into western Siberia. Most are oligophagous on either Apiaceae or Asteraceae. Four species feed on both families and have been considered as polyphagous, whereas monophagy seems scarce but does exist (O. gloriosa on Peucedanum ostruthium, for instance) (Jolivet et al.1986).
Chemical defense is a widespread strategy in Chrysomelidae and is found in all Oreina species (with the exception of O. melanocephala; Dobler et al.1996). Adults use active secretion with exocrine glands situated on the pronotum and the elytra, whereas larvae (which lack exocrine defensive glands) stock chemicals in their body (Dobler and Rowell-Rahier 1994). All species that feed on Apiaceae presumably synthesize cardenolides autogenously from ubiquitous plant sterols as shown in closely related chrysomelids (Pasteels and Daloze 1977; Van Oycke et al. 1987). A few Oreina species that feed on Asteraceae also sequester pyrrolizidine alkaloid (PA) N-oxides from their host plants, whereas one species (O. cacaliae) has lost the ability to produce cardenolides (Dobler et al.
1996). The production of cardenolides seems to be the ancestral character shared with many other species of Chrysomelinae, with PA sequestration having evolved in just a few species of Oreina.
In this study, we focused on Oreina speciosa, which feeds on several genera of Apiaceae and produces only autogenous cardenolides. We aimed to determine the extent of geographical variation in defense chemistry and whether variation in the cardenolides secreted by O. speciosa is related to environmental conditions and/or is genetically inherited. The species can be found throughout Europe in the Alps, the Jura, the French Massif Central, the Balkans, and the Vosges. With at least 38 different components in its secretion (Rowell-Rahier and Pasteels 1994), O. speciosa possesses the most complex blend in the genus Oreina. Moreover, a comparison of two populations showed differences in their cardenolide profiles (Rowell-Rahier and Pasteels1994).
A few studies—focused on quantitative genetics—have measured genetic and phenotypic variation of chemical defense in beetles (Eggenberger and Rowell-Rahier
1992; Holloway et al. 1993). Although a considerable part of the variation seems to be genetically determined (e.g., the average heritability of the concentration of 16 secretion compounds in O. gloriosa was estimated to be 0.45; Eggenberger and Rowell-Rahier
1992), environmental differences among locations (climate, food quality, predation pressure) are also likely to contribute to the diversity. However, to our knowledge, no studies have tested for a relationship between genetic divergence, environmental conditions, and the composition of chemical defenses.
Therefore, we aimed to determine whether the composition of defense secretions is genetically inherited or shaped by the environment. We analyzed the blend of cardenolides in populations of O. speciosa across Europe and correlated this variation with the genetic structure among populations and environmental differences among sites.
Methods and Materials
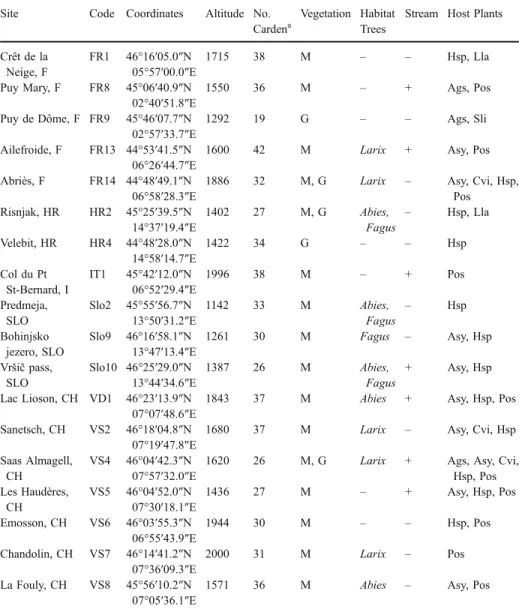
Collection of beetles and ecological data Sampling of O. speciosa was carried out in 2005 at 18 sites in France, Italy, Switzerland, Slovenia, and Croatia (Table 1), covering the Balkans (late June), the Jura (late July), the French Massif Central (mid August), and the Alps (throughout the collecting period, until late August). The latitude, longitude, and altitude of all sites were registered with a global positioning system receiver. The type of habitat was described in each site according to (1) the kind of adjacent vegetation (megaphorbiae or grasslands), (2) the dominant tree species in the surrounding forest (larch [Larix decidua], beech [Fagus sylvatica] or fir [Abies alba]), and (3) the presence/absence of a stream nearby. The host plants on which the beetles were collected were also recorded. Based on these observations, two distance matrices were constructed by using the “R Package for Multivariate and Spatial Analysis” version 4 (Casgrain and Legendre2001). A habitat distance matrix was created by computing the Jaccard indexes among sites based on the three factors described above (Jaccard1900). A host-plant distance matrix was derived from the Jaccard indexes based on host-plant sharing.
After collecting their defensive secretions (see below), the beetles were determined by examination of morphological traits under a binocular microscope (Lohse and Lucht1994). They were then put separately in 1.5-ml labeled Eppendorf tubes containing pure ethanol and stored at−20°C.
Collection of defense secretions Defensive secretions of freshly field-collected beetles were collected from each population. To get enough liquid for analysis, secretions from 5 to 10 insects were pooled. Secretions were obtained by holding the beetles under a binocular microscope and gently tapping on the elytra with forceps until they secreted drops from both sides of the prothorax. Drops were collected with a glass microcapillary and immediately placed in a tube containing approximately 1 ml of methanol. The tubes were stored at−70°C to avoid degradation.
Chemical preparation of samples and chromatographic analysis After crushing the microcapillary with a micropestle, samples were centrifuged for 10 s at 9,000 rpm (5,970×g) to eliminate glass fragments, and the liquid was transferred into new tubes. The solutions were concentrated under a nitrogen flow to a final volume of approximately 200μl. Sample analyses were carried out with the reverse phase-high performance liquid
chromatography (RP-HPLC) method coupled to mass spectrometry (MS). Characteristics of both devices and analysis conditions are described below. (1) RP-HPLC: Agilent 1100 series LC (Agilent Technologies, Basel, Switzerland); G1379A degasser; G1312A binary pumps; G1313A autosampler; G1316A column compartment; G1315A diode array detector; reverse phase C18 column (Lichrospher® 250×4 mm, 5μm, 100 A [MERCK, Darmstadt, Germany]); reverse phase-18 guard column Lichrocart® 4-4 [MERCK, Table 1 Collection sites of O. speciosa with their environmental characteristics
Site Code Coordinates Altitude No. Cardena
Vegetation Habitat Trees
Stream Host Plants
Crêt de la Neige, F FR1 46°16′05.0″N 05°57′00.0″E 1715 38 M – – Hsp, Lla Puy Mary, F FR8 45°06′40.9″N 02°40′51.8″E 1550 36 M – + Ags, Pos Puy de Dôme, F FR9 45°46′07.7″N 02°57′33.7″E 1292 19 G – – Ags, Sli Ailefroide, F FR13 44°53′41.5″N 06°26′44.7″E
1600 42 M Larix + Asy, Pos
Abriès, F FR14 44°48′49.1″N 06°58′28.3″E
1886 32 M, G Larix – Asy, Cvi, Hsp, Pos Risnjak, HR HR2 45°25′39.5″N 14°37′19.4″E 1402 27 M, G Abies, Fagus – Hsp, Lla Velebit, HR HR4 44°48′28.0″N 14°58′14.7″E 1422 34 G – – Hsp Col du Pt St-Bernard, I IT1 45°42′12.0″N 06°52′29.4″E 1996 38 M – + Pos Predmeja, SLO Slo2 45°55′56.7″N 13°50′31.2″E 1142 33 M Abies, Fagus – Hsp Bohinjsko jezero, SLO Slo9 46°16′58.1″N 13°47′13.4″E 1261 30 M Fagus – Asy, Hsp Vršič pass, SLO Slo10 46°25′29.0″N 13°44′34.6″E 1387 26 M Abies, Fagus + Asy, Hsp Lac Lioson, CH VD1 46°23′13.9″N 07°07′48.6″E
1843 37 M Abies + Asy, Hsp, Pos
Sanetsch, CH VS2 46°18′04.8″N 07°19′47.8"E
1680 37 M Larix – Asy, Cvi, Hsp
Saas Almagell, CH
VS4 46°04′42.3″N 07°57′32.0″E
1620 26 M, G Larix + Ags, Asy, Cvi, Hsp, Pos Les Haudères, CH VS5 46°04′52.0″N 07°30′18.1″E 1436 27 M – + Asy, Hsp, Pos Emosson, CH VS6 46°03′55.3″N 06°55′43.9″E 1944 30 M – – Hsp, Pos Chandolin, CH VS7 46°14′41.2″N 07°36′09.3″E 2000 31 M Larix – Pos La Fouly, CH VS8 45°56′10.2″N 07°05′36.1″E
1571 36 M Abies – Asy, Pos
F: France, HR: Croatia, I: Italy, SLO: Slovenia, CH: Switzerland, M: Megaphorbiae adjacent vegetation, G: grasslands adjacent vegetation, Ags: Angelica sylvestris, Asy: Anthriscus sylvestris, Cvi: Chaerophyllum villarsii, Hsp: Heracleum sphondylium, Lla: Laserpitium latifolium, Pos: Peucedanum ostruthium, Sli: Seseli libanotis, +: stream present,–: stream or tree absent
a
Darmstadt, Germany]; flow rate of 0.45 ml/min; solvent system of deionized water and acetonitrile (CAN, HPLC grade) gradient over 60 min (with acetonitrile increasing from 15% to 42% over 36 min, from 42% to 100% over 4 min, remaining isocratic at 100% for 10 min, decreasing from 100% to 15% over 1 min; remaining isocratic at 15% for 9 min); injection volume of 10μl; UV detection at 220 nm. (2) MS: Agilent 1100 series LC/MSD trap (Agilent Technologies, Basel, Switzerland); ESI (ElectroSpray Ionization) source in negative mode; modified ionization parameters (dry temperature at 325°C, nebulizer (N2) at
45.0 Ψ, dry gas at 8 l/min, capillary voltage at 3.5 kV); ion optic voltages with a RF amplitude of 150 Vpp,−160 V at the capillary exit and −40 V at the skimmer; specific trap parameters (trap drive at 74 V, scan from 200 to 1,200 m/z [mass-to-charge ratio of ions], maximum accumulation time at 150 ms); multiplier voltage at 1.8 kV and dynode voltage at 7.0 kV.
Chromatograms were integrated by using the “automatic integration option” of the Agilent Chemstations software (Agilent Technologies, Basel, Switzerland). To consider only those peaks corresponding to cardenolides, peaks with a maximum falling below 219 nm or above 221 nm were excluded (the butenolide lactone ring characterizing cardenolides absorbs at 220 nm). The MS was used to corroborate this selection by the presence of fragments typical of cardenolides, which also allowed the precise identification of some of the compounds as the same or similar to those previously detected in O. gloriosa (Eggenberger and Rowell-Rahier1993). Peaks in different samples with a retention time difference of less than 0.2 min were considered to be the same cardenolide, confirmed by their identical set of fragments in the MS. To standardize the minimum at which a cardenolide was considered present, the height of each peak was divided by the mean height of all peaks within each sample, and only those greater than a minimum fixed value of 0.1 were taken into consideration. The HPLC–MS analysis was performed twice for each sample, giving the same cardenolide matrix. A final presence/absence matrix of cardenolides based on their retention times in all sampled sites was obtained after removing invariable peaks. Based on these data, a similarity matrix was created by computing the Jaccard indexes between sites using the“R Package for Multivariate and Spatial Analysis” version 4 (Casgrain and Legendre2001). To later compare matrices at the individual level (as genetic distance matrices were computed at the individual level and not at the population level, see below), the “population information” was duplicated among individuals from the same sites to build an individual-based distance matrix in which the two individuals from each site showed the same cardenolide and environmental distance patterns.
DNA extraction, PCR amplification and gene sequencing Total genomic DNA was extracted from two individuals per site, using the DNeasy® Tissue Kit (Qiagen, Hilden, Germany). Extraction was performed using 4–6 legs of each individual. Three mtDNA genes were amplified using insect universal primers: 16s ribosomal RNA (LR-N-13398 and LR-J-12883 from Simon et al.1994), partial cytochrome oxidase I (COI) (C1-J-1751 and C1-N-2191 from Simon et al.1994) and partial cytochrome oxidase II (COII) (modTL2-J-3037 and modC2-N-3661 from Mardulyn et al.1997). Gene amplification was carried out in a standard 30μl PCR reaction including: 3 μl of 10X PCR buffer (Promega, Madison, WI, USA), 3μl of a MgCl2solution (25 mM), 3μl of dNTPs (1.5 mM), 0.5 μl of forward
and reverse primers (10 mM), 0.3μl of Taq DNA polymerase (Promega, Madison, WI, USA), 3μl of extracted DNA, all made up to 30 μl with purified MilliQ water. The PCR reactions were run in a TGradient thermocycler (Biometra, Goettingen, Germany) with the following program: initial denaturation at 93°C for 1 min 30 s; 35 cycles comprising
denaturation steps at 93°C for 1 min 30 s, annealing steps at 45°C (16s rRNA, COI) or at 53°C (COII) for 1 min, extension steps at 72°C for 2 min; and final extension at 72°C for 8 min. The PCR products were purified with the QIAquick PCR Purification Kit (Qiagen, Hilden, Germany) following the manufacturer’s protocol. Sequencing was carried out by Macrogen (Seoul, South Korea). They performed sequencing with both forward and reverse primers with the three genes under BigDyeTM terminator cycling conditions, purifying the reacted products by using ethanol precipitation, and running them using an Automatic Sequencer 3730XL (Applied Biosystem, Foster City, USA).
Phylogenetic reconstruction and genetic distance matrix 16s rRNA, COI, and COII sequences were reconstituted based on the forward and reverse sequences using Chromas Pro 1.33 (Technelysium, Helensvale, Australia). For 16s rRNA, alignment was carried out with ClustalW 1.4 (Thompson et al.1997). For COI and COII, alignment was trivial as all sequenced fragments were of the same size. We performed partitioned Bayesian analyses (Jordal and Hewitt2004; Nylander et al.2004) on the combined data set of the sequences for the three genes. All analyses were performed on a computer cluster at the Bioportal, University of Oslo, using MrBayes version 3 (Ronquist and Huelsenbeck2003). For each defined partition (one partition per gene sequenced), the best-fit substitution model was determined by using Modeltest 3.06 (Posada and Crandall 1998) through the Akaike information criterion (AIC) selection model (Posada and Buckley 2004), using separate starting NJ Jukes–Cantor-based trees for each partition. In MrBayes, distinct parameters were, therefore, used a priori for each partition defined under the previously Modeltest-determined best-fit substitution models. Four Metropolis-coupled chains with incremental heating in four distinct runs of 1,000,000 generations were performed, discarding the first 200,000 generations (burn-in) in each. One tree was saved every 100 generations, and a consensus tree was built by adding all compatible groups. Based on this consensus tree, additive tree distances (Sattath and Tversky 1977) between units were computed using Darwin version 5.0 (Perrier et al. 2003) to infer a genetic distance matrix between individuals computed from the partitioned multigene Bayesian analysis. To our knowledge, only Bayesian methods allow genes to be considered to be evolving independently (i.e., with different evolutionary models) in one single analysis. The phylogenetic hypothesis is then used to determine a multipartition mtDNA distance matrix. This would not have been possible using classical distance, parsimony, or likelihood methods, which do not allow partitioned analyses.
Combined analyses Distance matrices based on (1) cardenolide composition, (2) genetic distances, (3) habitat distances, and (4) host-plant distances were compared by performing Mantel tests (a total of six tests) using the R package followed by Bonferroni correction.
For the two comparisons that were significant (cardenolide composition with genetic distance and with host-plant use), tests were made on the individual compounds and hosts. The Mantel test between host-plant distance and cardenolide distance was repeated while sequentially removing individual host plants and also with each plant species alone to test which were important. To look at the role of individual cardenolides, an ANOVA was performed in JMP (2003) with pairwise genetic distance as the response and each cardenolide peak as a factor (1 when shared and 0 when not). A similar analysis was carried out with host-plant use as the response, based on the Jaccard index between populations. Furthermore, a regression was performed to test if the number of peaks in the cardenolide blend was related to the number of host plants within a site.
Finally, UPGMA analysis (complemented with NJ and maximum likelihood analyses) was used to construct a tree based on the cardenolide composition distance matrix to investigate the overall pattern of grouping among sites. We used the “R Package for Multivariate and Spatial Analysis” (Casgrain and Legendre 2001) for UPGMA tree reconstruction, the restdist module (from the PHYLIP package; Felsenstein2004) for Nei–
Li-based NJ reconstruction, and the restML module (from the PHYLIP package; Felsenstein2004) for maximum likelihood analysis.
Results
Variability in the genetic and chemical data Our analysis revealed a total of 50 cardenolides, of which 14 were found in all populations. Two substances were detected in only one population, whereas four were present in all populations except one. The number of cardenolides per population varied between a maximum of 42 (FR13) and a minimum of 19 (FR9) (Table1). However, 2/3 of the populations contained between 30 and 38 cardenolides. On average, pairs of populations shared 66% of their cardenolides, with a maximum (85%) shared between IT1 and VS8 and a minimum (41.8%) between FR9 and FR13.
The genetic analysis yielded a total of 1,510 bp among the three mtDNA genes: 503 bp for 16s rRNA (8 informative sites among 14 polymorphic sites), 447 bp for partial COI (34 informative sites among 44 polymorphic sites), and 560 bp for partial COII (30 informative sites among 43 polymorphic sites). This amount of variation—with the proportion of polymorphic sites ranging from 2.5% (ribosomal RNA) to 10% (coding genes)—is common in insect mtDNA at the intraspecific level (Simon et al.1994). Sequences were deposited in GenBank (accession numbers EF635121 to EF635217). The best-fit substitution models for each of the three genes were determined by Modeltest as follows. COI: transitional model (TIM) with gamma parameter and proportion of invariable sites; COII: transversional model (TVM) with gamma parameter and proportion of invariable sites; 16s rRNA: trans-versional model with equal base frequencies (TVMef) with proportion of invariable sites. The phylogenetic tree obtained by Bayesian inference (not shown) presented a log(likelihood) equal to −3,817.8 and corresponded to the following parameters: (1) COI transition rates: Rmat(A–C)=0.126168, Rmat(A–G)=0.2801, Rmat(A–T)=0.0320, Rmat(C–G)=0.1747, Rmat(C–T)=0.3599, Rmat(G–T)=0.0271; COI estimated base frequencies: p(A)=0.4239, p(C)=0.1299, p(G)=0.0945, p(T)=0.3517; COI gamma parameter: shape=0.0547; COI proportion of invariable sites: 0.8636; (2) COII transition rates: Rmat(C–G)=0.0349, Rmat (C–T)=0.3477, Rmat(G–T)=0.0302; COII estimated base frequencies: p(A)=0.3049, p(C)= 0.2005, p(G)=0.1305, p(T)= 0.3642; COII gamma parameter: shape= 14.7693; COII proportion of invariable sites: 0.7671; (3) 16s rRNA transition rates: Rmat(A–C)=0.0517, Rmat(A–G)=0.3449, Rmat(A–T)=0.1454, Rmat(C–G)=0.0116, Rmat(C–T)=0.4303, Rmat (G–T)=0.0161; 16s rRNA proportion of invariable sites: 0.7216.
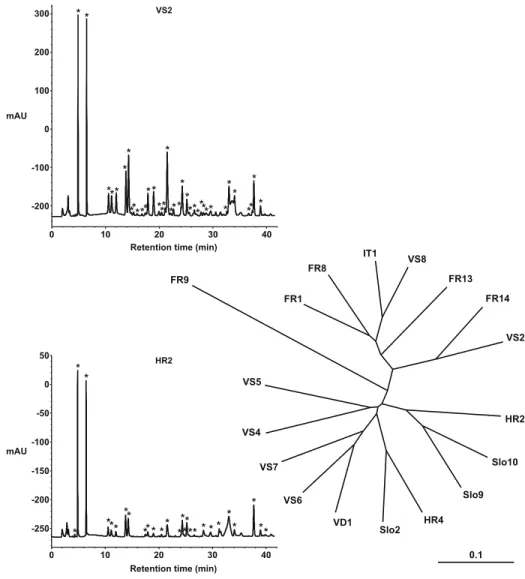
Geographical variation The UPGMA clustering of populations based on the Jaccard matrix of cardenolides shows strong, but not perfect, geographical structure (Fig.1). There was broad-scale east–west division: Balkan and eastern Alpine populations (HR2, HR4, Slo2, Slo9, Slo10) fell with those from the Rhone Valley in the Swiss Alps (VS4, VS5, VS6, VS7), whereas populations from the south–west Alps (FR13, FR14, IT1, VS8)
clustered together with one population from the Jura (FR1) and one from the Massif Central (FR8). Some populations fell in unexpected positions (VD1 and VS2), and FR9 was found at the end of a long branch. The main two-cluster topology remains when performing other analyses such as Nei–Li-based NJ and maximum likelihood (not shown) with the exception of the position of FR9, which sometimes switches between clusters.
Influence of environmental factors and genetics on the overall cardenolide blend Of the six Mantel tests, only that between cardenolide distance and host-plant distance and that between cardenolide distance and genetic distance were significant after Bonferroni’s correction (Table2). The significant effect of host plant on cardenolide composition was not the result of a correlation between the number of host plants and the number of
FR8 FR1 FR13 IT1 VS8 FR14 VS2 FR9 HR2 Slo10 Slo9 HR4 Slo2 VS7 VD1 VS6 VS4 VS5 0.1 Retention time (min)
0 10 20 30 40 mAU -200 -100 0 100 200 300 * * VS2 * ** * * ***** ** *** * *** * * ** ** *** * * * ** * *
Retention time (min)
0 10 20 30 40 mAU -250 -200 -150 -100 -50 0 50 HR2 * * * ***** *** ** * * **** * * * * * * **
Fig. 1 HPLC traces of defensive secretion of O. speciosa from two populations (with each cardenolide peak shown by an asterisk) and UPGMA clustering of populations based on their cardenolide composition. Abbreviations for the populations are the same as in Table1
cardenolides in the blend (linear regression, F1, 16=0.736, P=0.404). When plants were
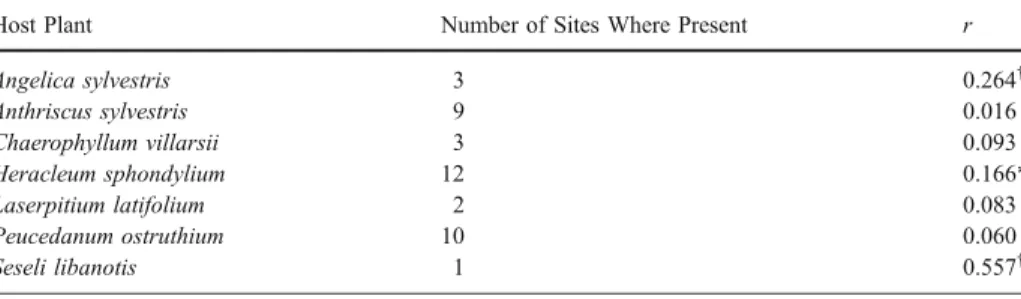
tested individually, only Heracleum sphondylium had a significant Mantel correlation with the cardenolide composition (r=0.166, P=0.049), whereas the correlations for Angelica sylvestris and Seseli libanotis were marginally nonsignificant (Table3). The importance of these three plants was confirmed by removing them sequentially from the overall Mantel test between host plant and cardenolide composition. The correlation remained significant when one or two of these plants were removed, but disappeared when removing all three.
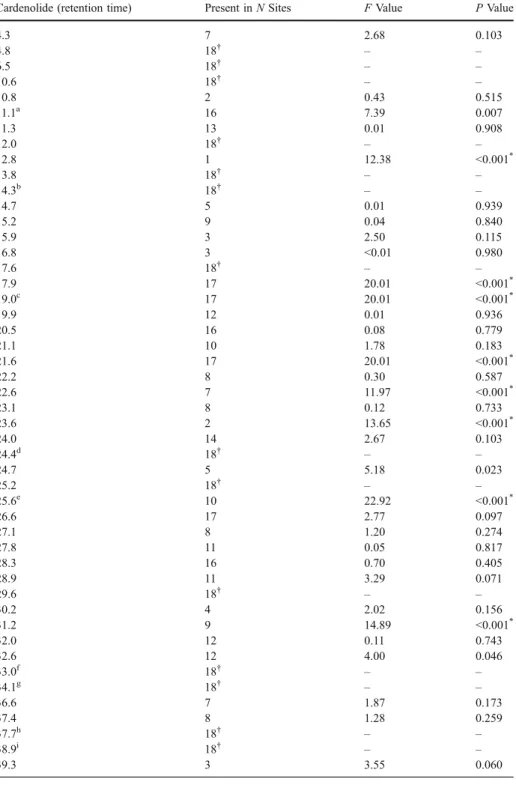
Influence of genetics and host plants for each cardenolide separately Nine cardenolides were significantly correlated with genetic distance (Table4). In contrast, despite the fact that the whole blend of cardenolides was strongly correlated with host-plant use, there were no such correlations at the level of single cardenolides. Nevertheless, simply observing the presence/absence of cardenolides in populations revealed one pattern. Three cardenolides (RT=17.9, 19.0 and 21.6) were present in all sites except one, Puy de Dôme (FR9). This was the only population in our study where O. speciosa feeds on S. libanotis, and also the only population that lacks both H. sphondylium and P. ostruthium (Table1).
Discussion
Autogenously synthesized chemical defense in O. speciosa showed considerable geographic variation: 36 out of 50 cardenolides varied in this sample of 18 populations, and no two populations showed the same cardenolide profile. Some of this variation is associated with genetic divergence, with a significant relationship for the overall blend and for nine of the 36 variable cardenolides when tested separately. This is clearly not evidence Table 2 Results of Mantel tests for the pairwise distance matrices
Cardenolides Habitat Host Plants Genetic Distance
Cardenolides P=0.075 P=0.006a P=0.005a
Habitat r=0.165 P=0.021 P=0.108
Host plants r=0.299a r=0.222 P=0.033
Genetic distance r=0.224a r=0.076 r=0.128 aSignificant after Bonferroni’s correction.
Table 3 Results from Mantel correlations between the cardenolide distance matrix and matrices based on individual host plants
Host Plant Number of Sites Where Present r
Angelica sylvestris 3 0.264† Anthriscus sylvestris 9 0.016 Chaerophyllum villarsii 3 0.093 Heracleum sphondylium 12 0.166* Laserpitium latifolium 2 0.083 Peucedanum ostruthium 10 0.060 Seseli libanotis 1 0.557† *P<0.05 †0.05<P<0.10
Table 4 Details of the 50 cardenolides and results from the ANOVA on the pairwise genetic distance between populations with individual cardenolides treated as explanatory factors
Cardenolide (retention time) Present in N Sites F Value P Value
4.3 7 2.68 0.103 4.8 18† – – 6.5 18† – – 10.6 18† – – 10.8 2 0.43 0.515 11.1a 16 7.39 0.007 11.3 13 0.01 0.908 12.0 18† – – 12.8 1 12.38 <0.001* 13.8 18† – – 14.3b 18† – – 14.7 5 0.01 0.939 15.2 9 0.04 0.840 15.9 3 2.50 0.115 16.8 3 <0.01 0.980 17.6 18† – – 17.9 17 20.01 <0.001* 19.0c 17 20.01 <0.001* 19.9 12 0.01 0.936 20.5 16 0.08 0.779 21.1 10 1.78 0.183 21.6 17 20.01 <0.001* 22.2 8 0.30 0.587 22.6 7 11.97 <0.001* 23.1 8 0.12 0.733 23.6 2 13.65 <0.001* 24.0 14 2.67 0.103 24.4d 18† – – 24.7 5 5.18 0.023 25.2 18† – – 25.6e 10 22.92 <0.001* 26.6 17 2.77 0.097 27.1 8 1.20 0.274 27.8 11 0.05 0.817 28.3 16 0.70 0.405 28.9 11 3.29 0.071 29.6 18† – – 30.2 4 2.02 0.156 31.2 9 14.89 <0.001* 32.0 12 0.11 0.743 32.6 12 4.00 0.046 33.0f 18† – – 34.1g 18† – – 36.6 7 1.87 0.173 37.4 8 1.28 0.259 37.7h 18† – – 38.9i 18† – – 39.3 3 3.55 0.060
of a direct link between divergence at mitochondrial DNA and shifts in chemical defense. Instead, mtDNA serves as a marker of the level of divergence (assuming that mtDNA variation reflects the overall genomic variation) between what are probably strongly isolated populations (Margraf et al. 2007). More genetically divergent populations have probably experienced longer or stronger isolation and, therefore, a greater opportunity for the composition of their defense secretions to diverge by natural selection or genetic drift.
The host plant, a key element of the environment for herbivorous insects, was also important for the expression of some cardenolides. Such an influence of host-plant use is new and intriguing for insects that produce substances de novo. In other systems with sequestered compounds, there is a direct link between the host plants on which the insect feeds and the chemical profile of their defense secretions (Malcolm et al.1989; Kopf et al.
1998; Moranz and Brower1998; Wahlberg 2001; Verdon et al.2007). For autogenously produced cardenolides, however, the relationship was unexpected. It is probably explained by the fact that cardenolides are synthesized from plant sterols (and possibly from other compounds such as sugars) that vary between plant species and provide an initial source of variation.
Those cardenolides that could be explained neither by genetic inheritance nor by the tested environmental factors must be the consequence of other sources of variation, such as geographical differences in plant chemistry, phenotypic plasticity, cyclic variation (e.g., seasonal cycles [Fordyce et al.2005]), other biotic or abiotic environmental pressures (e.g., temperature), or simple random processes. Antagonistic or synergistic interactions between genetic and environmental factors could also explain the fact that many substances did not show a simple correlation with single phylogenetic or environmental distances.
The evolutionary forces driving this intraspecific polymorphism are clearly complex, involving both genetic and environmental influences. Divergence among populations is in part influenced directly by host-plant use, but may also be under natural selection depending on the level of predation or type of predators encountered. Genetic drift is likely to contribute, perhaps if the overall level of cardenolide defense is fixed but the individual Table 4 (continued)
Cardenolide (retention time) Present in N Sites F Value P Value
39.9 6 15.91 <0.001*
40.4 1 2.35 0.126
a
Monomorphic cardenolides: these compounds were found in all populations b
Tetrahydroxylated aglycon-hexopyranoside cSignificant after Bonferroni’s correction dPeriplogenin-3-O-[ β-D-xylopyranosyl-(1→4)-β-D-allopyranoside] e Tetrahydroxylated aglycon-acetyl-hexopyranoside fDidehydroperiplogenin-3-O- β-D-allopyranoside gPeriplogenin-3-O- β-D-allopyranoside h Didehydroperiplogenin-O-acetyl-β-D-allopyranoside i Periplogenin-3-O-acetyl-β-D-allopyranoside
†Didehydrodigitoxigenin-3-O-[-O-acetyl-β-D-xylopyranosyl-(1→4)-O-acetyl-β-D-allopyranoside] *
components are free to vary. There also seem to be constraints acting, with 14 of the components invariable across populations.
The number of cardenolides found within each population was remarkable, with between 19 and 42 compounds present. These secretions were pooled samples from 5 to 10 beetles, but because most of the variation in defense within Oreina populations is quantitative rather than qualitative (Eggenberger and Rowell-Rahier1992), individuals are likely to possess the full blend of cardenolides typical of a population. The compounds varied in the number of sugars and the identity of both the sugar and aglycone components (Table 1). The complexity may have a functional explanation, if a blend is more efficient in promoting predator learning or deterrence. It could also simply be a result of the process of synthesis, with a mixed diet providing variation in the initial sterols and the inclusion of by-products and precursors in the secretion further increasing its diversity.
The geographical coherence of cardenolide composition was also striking. Populations were clustered into broadly eastern and western groups (consisting of an E-Alps/Balkan/ Rhone valley group and a SW-Alps/Jura/Massif Central group, Fig.1). This is not a result of host-plant use through host shifts or intraspecific variation in host chemistry, for the plants show no such structuring and are thoroughly mixed throughout the distribution (Table1with the one exception of Seseli libanotis found only at FR9). It is also not related to differences in the mean altitude of the two groups (Table 1), and so probably not influenced by current climatic conditions. It may be a product of the shared evolutionary history of populations, with two main clusters possibly corresponding to two different Pleistocene refugia and subsequent migration. Similar large-scale structuring is seen in other alpine insects and plants (Schönswetter et al.2005; Schmitt et al.2006; Margraf et al.
2007), and future phylogenetic work will test if the different lineages within O. speciosa present a biogeographic signal compatible with the history of climatic oscillations in Europe. The revelation of this east/west split shows the value of extending chemo-systematics to the use of chemical markers at the intraspecific level. Although chemical defense based on cardenolides is typical of several lineages within the subtribe Chrysolinina to which Oreina belongs, there is sufficient variation within a species to group populations and investigate the interaction between their current ecology and evolutionary history.
Acknowledgments The authors wish to thank Matthias Borer for help during fieldwork, Eliane Abou-Mansour for help with chemical analysis, and the National Centre of Competence in Research (NCCR) Plant Survival for funding chemical and genetic analyses.
References
BOWERS, D. 1992. The evolution of unpalatability and the cost of chemical defense in insects, pp. 216–244, in B. Roitberg and M. Isman (eds.). Insect Chemical Ecology: An Evolutionary Approach. Chapman and Hall, New York.
CASGRAIN, P. and LEGENDRE, P. 2001. The R package for multivariate and spatial analysis, version 4.0. Distributed by the author. University of Montreal, Montreal.
DOBLER, S. and ROWELL-RAHIER, M. 1994. Production of cardenolides versus sequestration of pyrrolizidine alkaloids in larvae of Oreina species (Coleoptera, Chrysomelidae). J. Chem. Ecol. 20:555–568. DOBLER, S., MARDULYN, P., PASTEELS, J. M., and ROWELL-RAHIER, M. 1996. Host-plant switches and the
evolution of chemical defense and life history in the leaf beetle genus Oreina. Evolution 50:2373–2386. DUFFEY, S. S. 1980. Sequestration of plant natural-products by insects. Annu. Rev. Entomol. 25:447–477. EGGENBERGER, F. and ROWELL-RAHIER, M. 1992. Genetic component of variation in chemical defense of
EGGENBERGER, F. and ROWELL-RAHIER, M. 1993. Physiological sources of variation in chemical defense of Oreina gloriosa (Coleoptera, Chrysomelidae). J. Chem. Ecol. 19:395–410.
FELD, B. K., PASTEELS, J. M., and BOLAND, W. 2001. Phaedon cochleariae and Gastrophysa viridula (Coleoptera: Chrysomelidae) produce defensive iridoid monoterpenes de novo and are able to sequester glycosidically bound terpenoid precursors. Chemoecology 11:191–198.
FELSENSTEIN, J. 2004. PHYLIP (Phylogeny Inference Package) version 3.6. Distributed by the author. Department of Genomic Sciences, University of Washington, Seattle.
FORDYCE, J. A., MARION, Z. H., and SHAPIRO, A. M. 2005. Phenological variation in chemical defense of the pipevine swallowtail Battus philenor. J. Chem. Ecol. 31:2835–2846.
FORDYCE, J. A., NICE, C. C., and SHAPIRO, A. M. 2006. A novel trade-off of insect diapause affecting a sequestered chemical defense. Oecologia 149:101–106.
HARTMANN, T., THEURING, C., BEUERLE, T., ERNST, L., SINGER, M. S., and BERNAYS, E. A. 2004. Acquired and partially de novo synthesized pyrrolizidine alkaloids in two polyphagous arctiids and the alkaloid profiles of their larval food-plants. J. Chem. Ecol. 30:229–254.
HOLLOWAY, G. J., DEJONG, P. W., and OTTENHEIM, M. 1993. The genetics and cost of chemical defense in the two-spot ladybird (Adalia bipunctata L.). Evolution 47:1229–1239.
JACCARD, P. 1900. Contribution au problème de l′immigration post-glaciaire de la flore alpin. Bull. Soc. Vaud. Sci. Nat. 36:87–130.
JOLIVET, P., PETITPIERRE, E., and DACCORDI, M. 1986. Les plantes-hôtes des Chrysomelidae. Quelques nouvelles précisions et additions (Coleoptera). Nouvelle Revue Entomologique 3:342–357.
JORDAL, B. H. and HEWITT, G. M. 2004. The origin and radiation of Macaronesian beetles breeding in Euphorbia: The relative importance of multiple data partitions and population sampling. Syst. Biol. 53:711–734.
KOPF, A., RANK, N. E., ROININEN, H., JULKUNEN-TIITTO, R., PASTEELS, J. M., and TAHVANAINEN, J. 1998. The evolution of host-plant use and sequestration in the leaf beetle genus Phratora (Coleoptera: Chrysomelidae). Evolution 52:517–528.
LOHSE, G. A. and LUCHT, W. H. 1994. Die Käfer Mitteleuropas, Vol. 14. Goecke und Evers Verlag, Krefeld, Germany.
MALCOLM, S. B., COCKRELL, B. J., and BROWER, L. P. 1989. Cardenolide fingerprint of monarch butterflies reared on common milkweed, Asclepias syriaca L. J. Chem. Ecol. 15:819–853.
MARDULYN, P., MILINKOVITCH, M. C., and PASTEELS, J. M. 1997. Phylogenetic analyses of DNA and allozyme data suggest that Gonioctena leaf beetles (Coleoptera; Chrysomelidae) experienced convergent evolution in their history of host-plant family shifts. Syst. Biol. 46:722–747.
MARGRAF, N., VERDON, A., RAHIER, M., and NAISBIT, R. E. 2007. Glacial survival and local adaptation in an alpine leaf beetle. Mol. Ecol. 16:2333–2343.
MORANZ, R. and BROWER, L. P. 1998. Geographic and temporal variation of cardenolide-based chemical defenses of queen butterfly (Danaus gilippus) in northern Florida. J. Chem. Ecol. 24:905–932. NISHIDA, R. 2002. Sequestration of defensive substances from plants by Lepidoptera. Annu. Rev. Entomol.
47:57–92.
NYLANDER, J. A. A., RONQUIST, F., HUELSENBECK, J. P., and NIEVES-ALDREY, J. L. 2004. Bayesian phylogenetic analysis of combined data. Syst. Biol. 53:47–67.
PASTEELS, J. M. and DALOZE, D. 1977. Cardiac glycosides in the defensive secretion of chrysomelid beetles: evidence for their production. Science 197:70–72.
PASTEELS, J. M., EGGENBERGER, F., ROWELL-RAHIER, M., EHMKE, A., and HARTMANN, T. 1992. Chemical defense in chrysomelid leaf beetles. Storage of host-derived pyrrolizidine alkaloids versus de novo synthesized cardenolides. Naturwissenschaften 79:521–523.
PERRIER, X., FLORI, A., and BONNOT, F. 2003. Data analysis methods, pp. 43–76, in P. Hamon, M. Seguin, X. Perrier and J. C. Glaszmann (eds.). Genetic Diversity of Cultivated Tropical Plants. Science Publishers, Enfield, New Hampshire.
POSADA, D. and CRANDALL, K. A. 1998. MODELTEST: testing the model of DNA substitution. Bioinformatics 14:817–818.
POSADA, D. and BUCKLEY, T. R. 2004. Model selection and model averaging in phylogenetics: advantages of Akaike information criterion and Bayesian approaches over likelihood ratio tests. Syst. Biol. 53:793–808. RONQUIST, F. and HUELSENBECK, J. P. 2003. MrBayes 3: Bayesian phylogenetic inference under mixed
models. Bioinformatics 19:1572–1574.
ROWELL-RAHIER, M. and PASTEELS, J. M. 1994. A comparison between allozyme data and phenotypic distances from defensive secretion in Oreina leaf beetles (Chrysomelinae). J. Evol. Biol. 7:489–500. ROWELL-RAHIER, M., WITTE, L., EHMKE, A., HARTMANN, T., and PASTEELS, J. M. 1991. Sequestration of
plant pyrrolizidine alkaloids by chrysomelid beetles and selective transfer into the defensive secretion. Chemoecology 2:41–48.
RUXTON, G. D., SHERRATT, T. N., and SPEED, M. P. 2004. Avoiding Attack: The Evolutionary Ecology of Camouflage, Warning Signals and Mimicry. Oxford University Press, Oxford.
SATTATH, S. and TVERSKY, A. 1977. Additive similarity trees. Psychometrika 42:319–345
SCHMITT, T., HEWITT, G. M., and MÜLLER, P. 2006. Disjunct distributions during glacial and interglacial periods in mountain butterflies: Erebia epiphron as an example. J. Evol. Biol. 19:108–113.
SCHÖNSWETTERP., STEHLIK, I., HOLDEREGGER, R., and TRIBSCH, A. 2005. Molecular evidence for glacial refugia of mountain plants in the European Alps. Mol. Ecol. 14:3547–3555.
SIMON, C., FRATI, F., BECKENBACH, A., CRESPI, B., LIU, H., and FLOOK, P. 1994. Evolution, weighting, and phylogenetic utility of mitochondrial gene-sequences and a compilation of conserved polymerase chain-reaction primers. Ann. Entomol. Soc. Am. 87:651–701.
SKELHORN, J. and ROWE, C. 2005. Tasting the difference: do multiple defence chemicals interact in Müllerian mimicry? Proc. R. Soc. Lond. B Biol. Sci. 272:339–345.
SOE, A. R. B., BARTRAM, S., GATTO, N., and BOLAND, W. 2004. Are iridoids in leaf beetle larvae synthesized de novo or derived from plant precursors? A methodological approach. Isot. Environ. Health Stud. 40:175–180.
SPENCER, K. C. 1988. Chemical Mediation of Coevolution. Academic, San Diego, CA, USA.
THOMPSON, J. D., GIBSON, T. J., PLEWNIAK, F., JEANMOUGIN, F., and HIGGINS, D. G. 1997. The clustalX windows interface: flexible strategies for multiple sequence alignment aided by quality analysis tools. Nucleic Acids Res. 24:4876–4882.
TRIGO, J. R. 2000. The chemistry of antipredator defense by secondary compounds in neotropical Lepidoptera: facts, perspectives and caveats. J. Braz. Chem. Soc. 11:551–561.
VANOYCKE, S., BRAEKMAN, J. C., DALOZE, D., and PASTEELS, J. M. 1987. Cardenolide biosynthesis in chrysomelid beetles. Experientia 43:460–462.
VERDON, A., MARGRAF, N., DAVISON, A. C., RAHIER, M., and NAISBIT, R. E. 2007. Conserved oviposition preferences in alpine leaf beetle populations despite host shifts and isolation. Ecol. Entomol. 32:62–69. WAHLBERG, N. 2001. The phylogenetics and biochemistry of host-plant specialization in Melitaeine