O-15–labeled water PET imaging: Validation of a
new fast factor analysis
Itaru Adachi, MD,aOliver Gaemperli, MD,a Ines Valenta, MD,a Tiziano Schepis, MD,a Patrick T. Siegrist, MD,a Valerie Treyer, PhD,aCyrill Burger, PhD,a
Koichi Morita, MD,b and Philipp A. Kaufmann, MDac
Background. Factor analysis (FA) is an established method for separating myocardium from blood pool by use of oxygen 15–labeled water and positron emission tomography for analyzing myocardial blood flow (MBF). Conventional FA methods generating images from sinograms (sinoFA) are time-consuming, whereas FA can be performed on the reconstructed images (reconFA) in a fraction of time. We validated the MBF values obtained by reconFA versus sinoFA.
Methods and Results. In 23 volunteers (mean age, 26.6 ⴞ 3.4 years) MBF was calculated from sinoFA and reconFA and blindly reanalyzed 1 month later by the same observer. Intraobserver agreement and reconFA-versus-sinoFA agreement were assessed according to Bland and Altman (BA). Reproducibility proved excellent for global sinoFA (rⴝ 0.968; P < .001; BA limits,ⴚ0.617 to 0.676 mL · minⴚ1· gⴚ1) and slightly superior for reconFA (rⴝ 0.979; P < .001; BA limits, ⴚ0.538 to 0.558 mL · minⴚ1· gⴚ1), with wider limits of agreement for segmental MBF from sinoFA (rⴝ 0.777; P < .001; BA limits, ⴚ1.676 to 1.656 mL · minⴚ1· gⴚ1) and reconFA (rⴝ 0.844; P < .001; BA limits, ⴚ1.999 to 1.992 mL · minⴚ1· gⴚ1). In addition, sinoFA and reconFA showed excellent correlation (r ⴝ 0.975, P < .001) and agreement (BA limits,ⴚ0.528 to 0.648 mL · minⴚ1· gⴚ1) for global and segmental values (rⴝ 0.955; P < .001; BA limits,ⴚ1.371 to 1.491 mL · minⴚ1· gⴚ1).
Conclusions. Use of reconFA allows rapid and reliable quantitative MBF assessment with O-15–labeled water. (J Nucl Cardiol 2007;14:698-705.)
Key Words: Positron emission tomography • myocardial blood flow • water • factor analysis • reproducibility
Positron emission tomography (PET) with oxygen 15–labeled water is a noninvasive method for accurately quantifying the regional myocardial blood flow (MBF), because O-15–labeled water has the following major advantages: free diffusion, kinetics independent of changes in the myocardial metabolism, and a short half-life (2.1 minutes), allowing sequential
measure-ments with a low radiation burden for patients.1-4 The myocardial tissue cannot be directly distinguished from blood pool on the dynamic O-15–labeled water images, because O-15–labeled water is not trapped by the myo-cardial cells. This limitation hinders the use of this tracer in routine clinical practice. O-15–labeled carbon monox-ide, which permits labeling of the vascular volume, has been used in combination with O-15–labeled water for delineation of the myocardial wall from other anatomic structures to obtain tissue O-15–labeled water time-activity curves (TACs) suitable for MBF measurement via compartmental analysis.5This method is standard in several centers for the determination of myocardial perfusion.6-8 Alternatively, processing of O-15–labeled water PET dynamic image sequences with factor analy-sis (FA) methods has been proposed and validated to generate high-quality myocardial factor images from the sinograms, avoiding the use for the O-15–labeled carbon monoxide scan.9,10 This method is relatively time-con-suming, because of the involved iterative reconstruc-tions. Some investigators proposed another method that
From the Department of Medical Radiology, University Hospital Zurich, Zurich, Switzerland,aZurich Center for Integrative Human
Physiology, University of Zurich, Zurich, Switzerland,band
Depart-ment of Nuclear Medicine, Hokkaido University, Sapporo, Japan.c
This study was supported by a grant from the Swiss National Science Foundation (professorship grant PP00A-114706).
Received for publication Jan 19, 2007; final revision accepted May 29, 2007.
Reprint requests: Philipp A. Kaufmann, MD, Nuclear Cardiology, Cardiovascular Center, and Nuclear Medicine, University Hospital NUK C 32, Ramistrasse, 100, CH-8091 Zurich, Switzerland;
1071-3581/$32.00
Copyright © 2007 by the American Society of Nuclear Cardiology. doi:10.1016/j.nuclcard.2007.05.012
was close to FA and based on the linear reduction of signal in the ventricular cavity.11 This method can perform FA on the reconstructed images (reconFA), not the sinograms, and therefore it can create factor images more quickly than the conventional method. However, the MBF values obtained from images by reconFA have not been validated. The aim of this study, therefore, was to validate the MBF values obtained by reconFA versus those obtained from sinograms (sinoFA) and to docu-ment their interchangeability.
METHODS Study population
We consecutively enrolled 23 healthy volunteers (17 men and 6 women; mean age, 26.6⫾ 3.4 years) in our study. This group was chosen because the incidence of coronary artery disease (CAD) increases sharply beyond 50 years of age.12None of the volunteers had a history of a prior cardiac event or elevated total or low-density lipoprotein cholesterol levels, hypertension, or diabetes mellitus. The inclusion criteria were normal resting electrocardiogram, normal heart rate, normal blood pres-sure, and unremarkable excursive cardiopulmonary ex-amination. All female study participants had a negative urine pregnancy test. The study protocol was approved by the local institutional review board, and all subjects gave written informed consent before enrollment in the study.
PET
All subjects refrained from ingesting caffeinated beverages or theophylline-containing medications for 24 hours before the PET study. The MBF at rest and during continuous administration of adenosine, 0.140 mg · kg⫺1· min⫺1, infused intravenously over a period of at least 6 minutes (stress) was quantified noninva-sively with O-15–labeled water and serial PET imag-ing.13Scanning was performed with an Advance PET scanner (GE Healthcare Technologies, Waukesha, Wis). This device records 35 image planes simulta-neously in 2-dimensional mode. The axial field of view was 14.5 cm. A 30-minute blank scan was recorded as part of the daily routine practice. A 20-minute transmission scan via an external germa-nium 68 source was performed for attenuation correc-tion. Starting after the background frame, a dose of 500 to 700 MBq of O-15–labeled water was injected as an intravenous bolus over a period of 20 seconds at an infusion rate of 24 mL/min to assess MBF. Dy-namic images were obtained for 4 minutes 40 seconds (14 frames for 5 seconds each, 3 frames for 10
seconds, 3 frames for 20 seconds, and 4 frames for 30 seconds).
Image processing
Transaxial images of the O-15–labeled water distri-bution over time were reconstructed via filtered back-projection with an 8-mm Hanning filter and a zoom factor of 1.72. The resulting image volumes had a matrix of 128⫻ 128 ⫻ 35 and a pixel size of 2.34 ⫻ 2.34 ⫻ 4.25 mm3. Images of the transmission data were recon-structed with the same geometry so that matched emis-sion and transmisemis-sion images were available. In addition, sinograms were calculated from the raw emission data, which were corrected for attenuation and scatter.
The FA approach developed by Hermansen et al9 was used to calculate anatomic images of the myocar-dium and the ventricular blood volume. As a first step, volumes of interest (VOIs) were outlined within the left and right lungs by use of the anatomic information available in the transmission images. These lung VOIs were projected to the dynamic images for calculation of the average lung TAC. Approximations of the activity in the left ventricle (LV) and right ventricle (RV) were derived by time-shifting the lung TAC (RV,⫺5 seconds; LV, 5 seconds). A third curve representing myocardial uptake was obtained by solving the 1-compartment water model with the shifted lung TAC (8 seconds) as the input curve, a mean MBF value of 1 mL · min⫺1· g⫺1tissue, and a partition coefficient of 0.96. Two FA procedures were applied to the TACs as described by Hermansen et al. The first used the myocardium TAC as the variate and the LV and RV TACs as the covariate, resulting in the myocardium factors. The second used the lung TAC as the variate and the myocardium TAC as the covariate, resulting in the blood factors.
These factors were then applied to the emission data in two different ways. (1) As described in the original approach (sinoFA),9 the corrected sinograms were weighted by the respective factors and added, resulting in a set of myocardial factor sinograms and a set of blood volume sinograms. The factor sinograms were then reconstructed into factor images of the myocardium and the blood volume via an ordered-subsets expectation maximization algorithm with 4 iterations, 14 subsets, and 2 final expectation maximization iterations. (2) As a fast alternative (reconFA), the factors were directly applied to the dynamic emission images.
The resulting factor images of either approach were used for the quantification process as follows. First, the factor images were resliced into the standard short-axis orientation (Figure 1). Next, the myocar-dium centerline was traced in all slices from the apex to the base (at least 12 consecutive slices). From this
centerline definition, 16 segmental VOIs were gener-ated, representing the segments as recommended by the American Heart Association.14 All image pixels within a range of⫾ 1 pixel from the centerline were included in the VOIs. By use of these VOIs, the myocardial TACs in the 16 segments were calculated from the dynamic O-15–labeled water images. Two additional VOIs were outlined in the cavities of the LV and RV on 6 consecutive slices to calculate the blood LV and RV TACs.
The MBF in the segments was quantified by use of a 1-tissue compartment model with the LV TAC as the input curve and 2 spillover terms. Spillover from the LV was considered in all segments, whereas spillover from the RV was set to 0 for all non-septal segments. The analysis resulted in segmental values of MBF in millili-ters per minute per gram, and a global MBF value was obtained by volume-weighted averaging of the segmen-tal results. All post-processing was performed with commercially available software (PMOD Technologies, Adliswil, Switzerland) that includes the FA and the modeling as a part of the myocardial quantification module.
Statistical analysis
The MBF values are expressed as mean ⫾ SD at rest, at stress, and as the average of both (all pooled). Intraobserver reproducibility and comparison of MBF values obtained by sinoFA versus reconFA was per-formed by linear regression analysis and by the assess-ment of the limits of agreeassess-ment as proposed by Bland and Altman15for global and segmental MBF for rest and stress values separately and for all values pooled. Coro-nary flow reserve was calculated as the ratio of hyper-emic over resting MBF (relative values).
RESULTS
All rest and adenosine stress procedures were well tolerated, and no subjects were withdrawn from the analysis. None of the subjects had any significant elec-trocardiographic changes or intolerable alterations of blood pressure.
Intraobserver reproducibility study
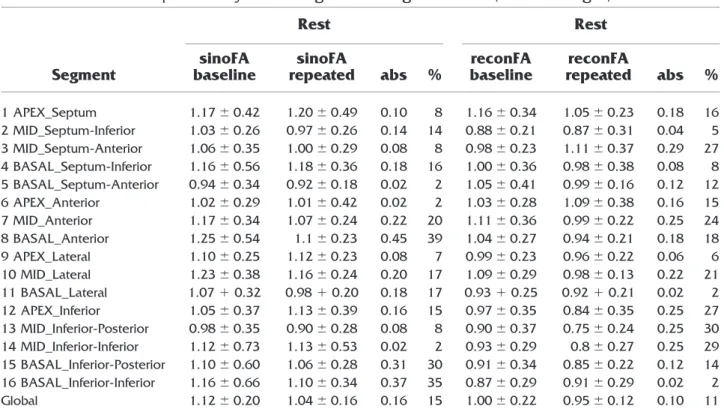
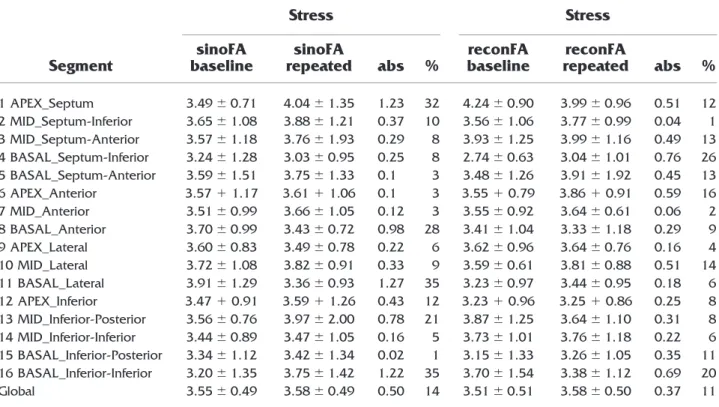
There were no significant differences between base-line and repeat analysis for the resting (Table 1) and stress MBF (Table 2) by use of sinoFA and reconFA on global MBF. The percentage of reproducibility coeffi-cient at stress was slightly lower than that at rest. Intraobserver reproducibility of baseline and repeat global MBF (rest, stress, and pooled) was excellent, as evidenced by a high correlation coefficient and narrow Bland-Altman (BA) limits of agreement for sinoFA (n⫽ 46; r ⫽ 0.968; standard error of the estimate [SEE], 0.335 mL · min⫺1· g⫺1; P⬍ .001; BA limits, ⫺0.617 to 0.676 mL · min⫺1· g⫺1) and even slightly superior for reconFA (n ⫽ 46; r ⫽ 0.979; SEE, 0.279 mL · min⫺1· g⫺1; P⬍ .001; BA limits, ⫺0.538 to 0.558 mL · min⫺1· g⫺1) (Figure 2). No significant differences between baseline and repeat analysis for the resting and stress MBF were observed by use of sinoFA and re-conFA on segmental MBF. The reproducibility coeffi-cient for segmental MBF was higher than that for global MBF. However, good reproducibility was maintained for segmental analysis with sinoFA (r⫽ 0.777; SEE, 0.992 mL · min⫺1· g⫺1; P⬍ .001; BA limits, ⫺1.676 to 1.656 mL · min⫺1· g⫺1) and with reconFA (r⫽ 0.844; SEE, 0.824 mL · min⫺1· g⫺1; P⬍ .001; BA limits, ⫺1.999 to 1.992 mL · min⫺1· g⫺1) (Figure 3).
Comparison of MBF from sinoFA versus reconFA MBF by sinoFA and reconFA compared well at rest (1.08 ⫾ 0.16 mL · min⫺1· g⫺1vs 0.97⫾ 0.14 mL · min⫺1· g⫺1) and at stress (3.56⫾ 0.44 mL · min⫺1· g⫺1vs 3.54⫾ 0.47
Figure 1. After FA, cardiac images were reoriented to short
axis (left column), vertical long axis (middle column), and horizontal long axis (right column) for both sinoFA (A and B) and reconFA (C and D) on which the regions of interest were drawn. Both methods allow clear discrimination of myocar-dium from blood pool.
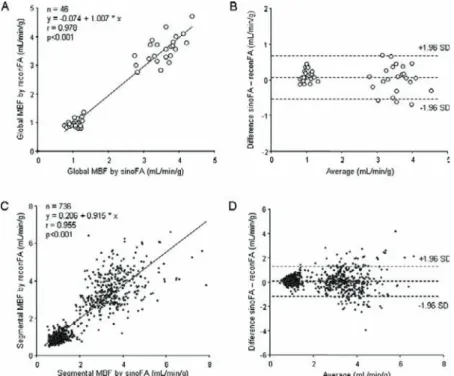
mL · min⫺1· g⫺1), resulting in similar coronary flow reserve values (3.34 ⫾ 0.5 vs 3.69 ⫾ 0.66) without a significant difference (P(( ⫽ not significant for all comparisons). The comparison of sinoFA and reconFA revealed excellent corre-lation (n⫽ 46, r ⫽ 0.978, P ⬍ .001) for global MBF values with narrow BA limits of agreement (⫺0.528 to 0.648 mL · min⫺1· g⫺1). The excellent correlation was preserved also for segmental values (n⫽ 736, r ⫽ 0.955, P ⬍ .001) with narrow BA limits of agreement (⫺1.371 to 1.491 mL ·
m
m mimm n⫺1· g⫺1) (Table 3andFigurerr 4).
DISCUSSION
This study confirms an excellent agreement of MBF assessed with O-15–labeled water and PET via both methods for FA (ie, reconFA and sinoFA). The validity and reliability of reconFA are further substan-tiated by its high intraobserver reproducibility, which was slightly superior than that for sinoFA. This equally applies to global and segmental MBF esti-mates.
The use of factor images has been introduced into nuclear cardiology by Hermansen et al,9 and its reproducibility for assessing MBF has been exten-sively validated by use of various stimuli such as adenosine, bicycle exercise stress, dobutamine, and cold pressor test.16-19
The novelty of the present method lies in the fact that the FA no longer needs to be performed on the sinograms. With sinograms, there is usually a very large data set, and therefore the processing is rather cumbersome and time-consuming. With the new method, the analysis can be performed on the recon-structed images. As these have a much smaller size, the FA on such data sets can now be done considerably more quickly, shortening the processing time by about 1 order of magnitude. This, however, is not achieved at the cost of any loss in the signal-to-noise ratio or image quality, resulting in highly comparable MBF values. A strength of our method, representing an advantage over previously reported approaches by other groups using regularized factor images,11is that we use lung regions of interest to determine lung kinetics, which improves the signal-to-noise ratio. Therefore, with our method, there was no loss in image quality at stress compared with rest, as opposed to the latter method reported by Frouin et al.11A direct comparison between the sinoFA and reconFA methods by BA analysis revealed an excellent agreement of the 2 methods for global and segmental MBF over a wide range of flow. In addition, the MBF values obtained in our study with reconFA and sinoFA compare well with the numbers in healthy volunteers reported in the literature.17,19-21
Table 1. Intraobserver reproducibility at rest for global and segmental MBF (mL · min⫺1· g⫺1)
Segment Rest Rest sinoFA baseline sinoFA repeated abs % reconFA baseline reconFA repeated abs % 1 APEX_Septum 1.17⫾ 0.42 1.20⫾ 0.49 0.10 8 1.16⫾ 0.34 1.05⫾ 0.23 0.18 16 2 MID_Septum-Inferior 1.03⫾ 0.26 0.97⫾ 0.26 0.14 14 0.88⫾ 0.21 0.87⫾ 0.31 0.04 5 3 MID_Septum-Anterior 1.06⫾ 0.35 1.00⫾ 0.29 0.08 8 0.98⫾ 0.23 1.11⫾ 0.37 0.29 27 4 BASAL_Septum-Inferior 1.16⫾ 0.56 1.18⫾ 0.36 0.18 16 1.00⫾ 0.36 0.98⫾ 0.38 0.08 8 5 BASAL_Septum-Anterior 0.94⫾ 0.34 0.92⫾ 0.18 0.02 2 1.05⫾ 0.41 0.99⫾ 0.16 0.12 12 6 APEX_Anterior 1.02⫾ 0.29 1.01⫾ 0.42 0.02 2 1.03⫾ 0.28 1.09⫾ 0.38 0.16 15 7 MID_Anterior 1.17⫾ 0.34 1.07⫾ 0.24 0.22 20 1.11⫾ 0.36 0.99⫾ 0.22 0.25 24 8 BASAL_Anterior 1.25⫾ 0.54 1.1⫾ 0.23 0.45 39 1.04⫾ 0.27 0.94⫾ 0.21 0.18 18 9 APEX_Lateral 1.10⫾ 0.25 1.12⫾ 0.23 0.08 7 0.99⫾ 0.23 0.96⫾ 0.22 0.06 6 10 MID_Lateral 1.23⫾ 0.38 1.16⫾ 0.24 0.20 17 1.09⫾ 0.29 0.98⫾ 0.13 0.22 21 11 BASAL_Lateral 1.07⫹ 0.32 0.98⫹ 0.20 0.18 17 0.93⫹ 0.25 0.92⫹ 0.21 0.02 2 12 APEX_Inferior 1.05⫾ 0.37 1.13⫾ 0.39 0.16 15 0.97⫾ 0.35 0.84⫾ 0.35 0.25 27 13 MID_Inferior-Posterior 0.98⫾ 0.35 0.90⫾ 0.28 0.08 8 0.90⫾ 0.37 0.75⫾ 0.24 0.25 30 14 MID_Inferior-Inferior 1.12⫾ 0.73 1.13⫾ 0.53 0.02 2 0.93⫾ 0.29 0.8⫾ 0.27 0.25 29 15 BASAL_Inferior-Posterior 1.10⫾ 0.60 1.06⫾ 0.28 0.31 30 0.91⫾ 0.34 0.85⫾ 0.22 0.12 14 16 BASAL_Inferior-Inferior 1.16⫾ 0.66 1.10⫾ 0.34 0.37 35 0.87⫾ 0.29 0.91⫾ 0.29 0.02 2 Global 1.12⫾ 0.20 1.04⫾ 0.16 0.16 15 1.00⫾ 0.22 0.95⫾ 0.12 0.10 11
Reproducibility
As mentioned previously, reconFA tended to be more reproducible as compared with sinoFA. This most probably reflects that the improved signal-to-noise ratio increased the validity of the analysis despite being faster. The repeatability of PET O-15–labeled water resting MBF measurement has been reported in 5 publications to date. Four studies were conducted on human sub-jects,16-19 whereas the last one was an experimental animal study.22 Our method is different in several as-pects. All of the previous studies investigated the agree-ment of repeat MBF, whereas our study has assessed purely intraobserver reproducibility of the same data sets. By examining the resting and stress MBF, 1 observer calculated MBF using different methods (re-conFA and sinoFA). One month later, the same data sets were reanalyzed by the same observer. The reproducibil-ity of the global MBF was excellent for both sinoFA and reconFA methods in this study. In addition, we per-formed segmental comparisons, as the LV was further subdivided into a total of 16 segments. In most previous studies the subsegments were grouped to obtain the mean value of global wall perfusion. By contrast, we provide segmental data, revealing a marked variation of repro-ducibility among different segments. This dispersion, however, was within the spatial heterogeneity of MBF as previously reported both within the same individual and
between different individuals.23 Another study demon-strated a good reproducibility of 16-segmental resting MBF using an animal model.22 However, it did not include hyperemic flow conditions.
Limitations
MBF measurements in this study were not assessed independently from PET by another reference method because no other noninvasive method was available by which to quantitatively assess the myocardial perfusion. The radioactive microsphere method, as the gold stan-dard for measurement of MBF, requires postmortem tissue samples and can only be used in animals, whereas for humans, PET represents the established gold standard for MBF measurement.24 A further limitation of the study is that no CAD patients were included. However, as the maximal MBF is typically higher in healthy volunteers than in CAD patients, our study seems to appropriately cover the whole range of values.
Finally, correlation between sinoFA and reconFA revealed a markedly decreased correlation coefficient if rest and stress were analyzed separately as compared with pooled analysis. This, however, had little impact on the agreement of the 2 methods, as reflected by the limits of agreement (Table 3), which are very similar for resting (30%), hyperemic (21%), and pooled data (26%). Table 2. Intraobserver reproducibility at stress for global and segmental MBF (mL · min⫺1· g⫺1)
Segment Stress Stress sinoFA baseline sinoFA repeated abs % reconFA baseline reconFA repeated abs % 1 APEX_Septum 3.49⫾ 0.71 4.04⫾ 1.35 1.23 32 4.24⫾ 0.90 3.99⫾ 0.96 0.51 12 2 MID_Septum-Inferior 3.65⫾ 1.08 3.88⫾ 1.21 0.37 10 3.56⫾ 1.06 3.77⫾ 0.99 0.04 1 3 MID_Septum-Anterior 3.57⫾ 1.18 3.76⫾ 1.93 0.29 8 3.93⫾ 1.25 3.99⫾ 1.16 0.49 13 4 BASAL_Septum-Inferior 3.24⫾ 1.28 3.03⫾ 0.95 0.25 8 2.74⫾ 0.63 3.04⫾ 1.01 0.76 26 5 BASAL_Septum-Anterior 3.59⫾ 1.51 3.75⫾ 1.33 0.1 3 3.48⫾ 1.26 3.91⫾ 1.92 0.45 13 6 APEX_Anterior 3.57⫹ 1.17 3.61⫹ 1.06 0.1 3 3.55⫹ 0.79 3.86⫹ 0.91 0.59 16 7 MID_Anterior 3.51⫾ 0.99 3.66⫾ 1.05 0.12 3 3.55⫾ 0.92 3.64⫾ 0.61 0.06 2 8 BASAL_Anterior 3.70⫾ 0.99 3.43⫾ 0.72 0.98 28 3.41⫾ 1.04 3.33⫾ 1.18 0.29 9 9 APEX_Lateral 3.60⫾ 0.83 3.49⫾ 0.78 0.22 6 3.62⫾ 0.96 3.64⫾ 0.76 0.16 4 10 MID_Lateral 3.72⫾ 1.08 3.82⫾ 0.91 0.33 9 3.59⫾ 0.61 3.81⫾ 0.88 0.51 14 11 BASAL_Lateral 3.91⫾ 1.29 3.36⫾ 0.93 1.27 35 3.23⫾ 0.97 3.44⫾ 0.95 0.18 6 12 APEX_Inferior 3.47⫹ 0.91 3.59⫹ 1.26 0.43 12 3.23⫹ 0.96 3.25⫹ 0.86 0.25 8 13 MID_Inferior-Posterior 3.56⫾ 0.76 3.97⫾ 2.00 0.78 21 3.87⫾ 1.25 3.64⫾ 1.10 0.31 8 14 MID_Inferior-Inferior 3.44⫾ 0.89 3.47⫾ 1.05 0.16 5 3.73⫾ 1.01 3.76⫾ 1.18 0.22 6 15 BASAL_Inferior-Posterior 3.34⫾ 1.12 3.42⫾ 1.34 0.02 1 3.15⫾ 1.33 3.26⫾ 1.05 0.35 11 16 BASAL_Inferior-Inferior 3.20⫾ 1.35 3.75⫾ 1.42 1.22 35 3.70⫾ 1.54 3.38⫾ 1.12 0.69 20 Global 3.55⫾ 0.49 3.58⫾ 0.49 0.50 14 3.51⫾ 0.51 3.58⫾ 0.50 0.37 11
Figure 2. Linear regression analysis and Bland-Altman plot comparing baseline and repeat global
MBF values documenting intraobserver reproducibility for sinoFA (A and B) and reconFA (C and
D), where 1.96 SD denotes reproducibility coefficient.
Figure 3. Linear regression analysis and Bland-Altman plot comparing baseline and repeat
segmental MBF values documenting intraobserver reproducibility for sinoFA (A and B) and reconFA (C and D), where 1.96 SD denotes reproducibility coefficient.
CONCLUSIONS
Our results suggest that reconFA should be used for quantitative MBF measurement with O-15–labeled water and PET, as it considerably shortens analysis time and provides accurate values as compared with the validated sinoFA method. Its reliability is further substantiated by the excellent reproducibility, which is slightly superior to that for sinoFA.
Acknowledgment
We are grateful to Ratko Milovanovic, deputy chief radiographer, for his excellent technical support.
The authors have indicated they have no financial conflicts of interest.
References
1. Bergmann SR, Fox KA, Rand AL, McElvany KD, Welch MJ, Markham J, et al. Quantification of regional myocardial blood flow in vivo with H215O. Circulation 1984;70:724-33.
2. Knabb RM, Fox KA, Sobel BE, Bergmann SR. Characterization of the functional significance of subcritical coronary stenoses with H(2)15O and positron-emission tomography. Circulation 1985;71:1271-8.
3. Lee JS, Lee DS, Ahn JY, Yeo JS, Cheon GJ, Kim SK, et al. Generation of parametric image of regional myocardial blood flow using H(2)(15)O dynamic PET and a linear least-squares method. J Nucl Med 2005;46:1687-95.
4. Morita K, Tsukamoto T, Naya M, Noriyasu K, Inubushi M, Shiga T, et al. Smoking cessation normalizes coronary endo-thelial vasomotor response assessed with 15O-water and PET in healthy young smokers. J Nucl Med 2006;47:1914-20. 5. Kety SS. Measurement of local contribution within the brain by
means of inert, diffusible tracers: examination of the theory,
Figure 4. Linear regression analysis and Bland-Altman plot of global (A and B) and segmental (C
and D) MBF for comparison between sinoFA and reconFA, where 1.96 SD denotes reproducibility coefficient.
Table 3. Comparison of global MBF: rest and stress separate and pooled
Value (mL · minⴚ1· gⴚ1) Correlation
BA agreement
sinoFA reconFA n r P abs %
Rest MBF 1.08⫾ 0.16 0.97⫾ 0.144 23 0.61 ⬍.001 0.31 30
Stress MBF 3.56⫾ 0.44 3.54⫾ 0.47 23 0.56 ⬍.001 0.76 21
Pooled MBF 2.32⫾ 1.29 2.26⫾ 1.34 46 0.97 ⬍.001 0.58 26
assumptions and possible sources of error. Acta Neurol Scand 1965;14(Suppl):20-3.
6. Araujo LI, Lammertsma AA, Rhodes CG, McFalls EO, Iida H, Rechavia E, et al. Noninvasive quantification of regional myocar-dial blood flow in coronary artery disease with oxygen-15-labeled carbon dioxide inhalation and positron emission tomography. Circulation 1991;83:875-85.
7. Iida H, Kanno I, Takahashi A, Miura S, Murakami M, Takahashi K, et al. Measurement of absolute myocardial blood flow with H215O and dynamic positron-emission tomography. Strategy for quantification in relation to the partial-volume effect. Circulation 1988;78:104-15.
8. Katoh C, Morita K, Shiga T, Kubo N, Nakada K, Tamaki N. Improvement of algorithm for quantification of regional myocar-dial blood flow using 15O-water with PET. J Nucl Med 2004;45: 1908-16.
9. Hermansen F, Ashburner J, Spinks TJ, Kooner JS, Camici PG, Lammertsma AA. Generation of myocardial factor images directly from the dynamic 15-water scan without use of an oxygen-15-carbon monoxide blood-pool scan. J Nucl Med 1998;39:1696-702.
10. Watabe H, Jino H, Kawachi N, Teramoto N, Hayashi T, Ohta Y, et al. Parametric imaging of myocardial blood flow with 15O-water and PET using the basis function method. J Nucl Med 2005;46: 1219-24.
11. Frouin F, Merlet P, Bouchareb Y, Frouin V, Dubois-Rande JL, De Cesare A, et al. Validation of myocardial perfusion reserve measurements using regularized factor images of H(2)(15)O dy-namic PET scans. J Nucl Med 2001;42:1737-46.
12. White NK, Edwards JE, Dry TJ. The relationship of the degree of coronary arteriosclerosis with age in men. Circulation 1950;1:645-54. 13. Kaufmann PA. Differential effects of pharmacologic stressors:
more than meets the eye. J Nucl Cardiol 2006;13:311-2. 14. Cerqueira MD, Weissman NJ, Dilsizian V, Jacobs AK, Kaul S,
Laskey WK, et al. Standardized myocardial segmentation and nomenclature for tomographic imaging of the heart: a statement for healthcare professionals from the Cardiac Imaging Committee of the Council on Clinical Cardiology of the American Heart Asso-ciation. Circulation 2002;105:539 –5.
15. Bland JM, Altman DG. Statistical methods for assessing agreement between two methods of clinical measurement. Lancet 1986;1:307-10.
16. Kaufmann PA, Gnecchi-Ruscone T, Yap JT, Rimoldi O, Camici PG. Assessment of the reproducibility of baseline and hyperemic myocardial blood flow measurements with 15O-labeled water and PET. J Nucl Med 1999;40:1848-56.
17. Wyss CA, Koepfli P, Mikolajczyk K, Burger C, von Schulthess GK, Kaufmann PA. Bicycle exercise stress in PET for assessment of coronary flow reserve: repeatability and comparison with adenosine stress. J Nucl Med 2003;44:146-54.
18. Jagathesan R, Kaufmann PA, Rosen SD, Rimoldi OE, Turkeimer F, Foale R, et al. Assessment of the long-term reproducibility of baseline and dobutamine-induced myocardial blood flow in pa-tients with stable coronary artery disease. J Nucl Med 2005;46: 212-9.
19. Siegrist PT, Gaemperli O, Koepfli P, Schepis T, Namdar M, Valenta I, et al. Repeatability of cold pressor test-induced flow increase assessed with H(2)(15)O and PET. J Nucl Med 2006;47: 1420-6.
20. Wyss CA, Koepfli P, Namdar M, Siegrist PT, Luscher TF, Camici PG, et al. Tetrahydrobiopterin restores impaired coronary micro-vascular dysfunction in hypercholesterolaemia. Eur J Nucl Med Mol Imaging 2005;32:84-91.
21. Wyss CA, Koepfli P, Fretz G, Seebauer M, Schirlo C, Kaufmann PA. Influence of altitude exposure on coronary flow reserve. Circulation 2003;108:1202-7.
22. Chareonthaitawee P, Christenson SD, Anderson JL, Kemp BJ, Hodge DO, Ritman EL, et al. Reproducibility of measurements of regional myocardial blood flow in a model of coronary artery disease: comparison of H215O and 13NH3 PET techniques. J Nucl Med 2006;47:1193-201.
23. Chareonthaitawee P, Kaufmann PA, Rimoldi O, Camici PG. Heterogeneity of resting and hyperemic myocardial blood flow in healthy humans. Cardiovasc Res 2001;50:151-61.
24. Kaufmann PA, Camici PG. Myocardial blood flow measurement by PET: technical aspects and clinical applications. J Nucl Med 2005;46:75-88.