Received: 5 December 2002 Accepted: 18 May 2003 Published online: 8 July 2003 © Springer-Verlag 2003
Abstract Objective: To compare the
effects of He/O
2and external PEEP
(PEEPe) on intrinsic PEEP (PEEPi),
respiratory mechanics, gas exchange,
and ventilation/perfusion (V
.
A/Q
.
) in
mechanically ventilated COPD
pa-tients. Design and setting:
Prospec-tive, interventional study in the
in-tensive care unit of a university
hos-pital. Interventions: Ten intubated,
sedated, paralyzed, mechanically
ventilated COPD patients studied in
the following conditions: (a)
base-line settings made by clinician in
charge, air/O
2, ZEEP; (b) He/O
2,
ZEEP; (c) air/O
2, ZEEP; (d) air/O
2,
PEEPe 80% of PEEPi.
Measure-ments at each condition included
V
.
A/Q
.
by the multiple inert gas
elimi-nation technique (MIGET). Results:
PEEPi and trapped gas volume were
comparably reduced by He/O
2(4.2±4 vs. 7.7±4 cmH
2O and 98±82
vs. 217±124 ml, respectively) and
PEEPe (4.4±1.3 vs. 7.8±3.6 cmH
2O
and 120±107 vs. 216±115 ml,
re-spectively). He/O
2reduced
inspirato-ry and expiratoinspirato-ry respiratoinspirato-ry system
resistance (15.5±4.4 vs. 20.7±6.9
and 19±9 vs. 28.8±15 cmH
2O l
−1s
−1,
respectively) and plateau pressure
(13±4 vs. 17±6 cmH
2O). PEEPe
in-creased airway pressures, including
total PEEP, and elastance. PaO
2/FIO
2was slightly reduced by He/O
2(225±83 vs. 245±82) without
signifi-cant V
.
A/Q
.
change. Conclusions:
He/O
2and PEEPe comparably
re-duced PEEPi and trapped gas
vol-ume. However, He/O
2decreased
air-way resistance and intrathoracic
pressures, at a small cost in arterial
oxygenation. He/O
2could offer an
attractive option in COPD patients
with PEEPi/dynamic hyperinflation.
Keywords Chronic obstructive
pulmonary disease · Helium · Heliox ·
Ventilation/perfusion · Multiple inert
gas elimination technique
Philippe Jolliet
Christine Watremez
Jean Roeseler
J. C. Ngengiyumva
Marc de Kock
Thierry Clerbaux
Didier Tassaux
Marc Reynaert
Bruno Detry
Giuseppe Liistro
Comparative effects of helium-oxygen
and external positive end-expiratory pressure
on respiratory mechanics, gas exchange,
and ventilation-perfusion relationships
in mechanically ventilated patients with
chronic obstructive pulmonary disease
Introduction
In mechanically ventilated patients with chronic
obstruc-tive pulmonary disease (COPD), incomplete exhalation
of inspired tidal volume (VT) due to elevated airway
re-sistance and decreased lung elastic recoil can lead to an
increase in end-expiratory lung volume, termed “dynamic
hyperinflation” [1, 2] or “intrinsic” positive
end-expirato-ry pressure (PEEPi) [3, 4]. The numerous deleterious
ef-fects of PEEPi on respiratory mechanics, gas exchange,
hemodynamics, oxygen transport, and work of breathing
[3, 4, 5] can be attenuated by measures aimed at reducing
dynamic hyperinflation, such as reduction in VT and
res-piratory rate [6], bronchodilators [7], and applying
exter-nal PEEP (PEEPe) [8]. However, the latter is difficult to
titrate [4] and may by itself be detrimental by increasing
lung volumes and intrathoracic pressures [9, 10], and
worsening of hemodynamics [9, 11]. Alternatively,
re-placing the inhaled air-oxygen mixture by
helium-oxy-gen, which reduces resistance to flow in the airways [12]
P. Jolliet (
✉
) · D. Tassaux Medical Intensive Care Division, University Hospital, 1211 Geneva 14, Switzerland e-mail: [email protected] Tel.: +41-22-3729093 Fax: +41-22-3729105 C. Watremez · J. C. Ngengiyumva M. de Kock Division of Anesthesiology, Clinique Universitaire St.-Luc, Brussels, BelgiumJ. Roeseler · M. Reynaert Departement of Emergency and Intensive Care,
Clinique Universitaire St.-Luc, Brussels, Belgium
T. Clerbaux · B. Detry · G. Liistro Division of Pneumology, Clinique Universitaire St.-Luc, Brussels, Belgium
D. Tassaux
Division of Anesthesiology, University Hospital, 1211 Geneva 14, Switzerland
and trapped gas volume [13]. However, He/O
2also raises
concerns, among which are interference with ventilator
function [14] and worsening of hypoxemia, the latter
hav-ing been documented in spontaneously breathhav-ing COPD
patients [15, 16]. The purpose of this study was thus to
compare the effects of He/O
2and PEEPe on PEEPi,
res-piratory mechanics, gas exchange, and
ventilation/perfu-sion (V
.
A/Q
.
) in mechanically ventilated COPD patients.
Methods
Patients
The study was conducted in the Division of Intensive Care, St.-Luc Hospital, Brussels. Intubated patients consecutively admitted to the ICU were included if they met diagnostic criteria of COPD [17] and had been mechanically ventilated for no longer than 48 h. Patients were excluded if pneumothorax was present or the in-spired O2 fraction (FIO2) was 0.4 or higher. The study included ten patients (aged 64±9 years) after a mean of 28±5 h of mechani-cal ventilation. Individual baseline characteristics, main ventilator settings, PEEPi measurement and arterial blood gases of the pa-tients are summarized in Table 1. The study protocol was ap-proved by the ethics committee of the Catholic University of Lou-vain, Brussels. Consent was obtained from next of kin.
Procedures and measurement techniques
Patients were sedated and paralyzed by a continuous infusion of propofol or midazolam, and vecuronium or atracurium. All pa-tients were ventilated with a Siemens Servo 300 (Siemens-Elema, Solna, Sweden) which is easily compatible with the use of helium [14]. Helium was delivered from a 50-l canister containing a 78:22 mixture of He and O2, pressurized at 200 bar, through a pressure regulator at 6 bar into the ventilator’s air inlet [18]. Ven-tilator mode was volume-controlled pressure limited ventilation. Set VT was not corrected for He/O2 since on the machine used the change in density does not affect delivered VT, while expired VT (VTe) readings were corrected using appropriate factors [14]. As a final precaution VTe was monitored with a density-indepen-dent spirometer (5420 Volume Monitor, Ohmeda, Louisville, Col., USA).
were kept constant. Maximum pressure limit was set at 40 cmH2O. Inspiratory flow rate was 60 l/min, square wave flow pattern. No PEEP was set on the ventilator except during the last step of the study at which time an PEEPe of 80% of PEEPi mea-sured at air/O2zero end-expiratory pressure (ZEEP) 2 was applied (see below).
Respiratory rate, airway pressure, flow, and inspiratory:expira-tory (I:E) ratio were recorded from the ventilator. Respirainspiratory:expira-tory system static elastance (Ers) and inspiratory (Rinsp) and expiratory (Rexp) resistances were computed by the automatic measuring al-gorithms of the ventilator after a brief end-inspiratory pause. PE-EPi was measured by an end-expiratory occlusion [3], also per-formed automatically on the Servo 300. This end-expiratory oc-clusion technique actually measures total PEEP in static condi-tions. Therefore when no PEEPe is applied, the readout is equiva-lent to the value of PEEPi, whereas when PEEPe is applied, PE-EPi is equal to the value of total PEEP (PEEPtot) obtained by end-expiratory occlusion minus that of PEEPe set on the ventilator [4, 19]. For each set of measurements the end-expiratory occlusion was performed three times at 1-min intervals and PEEPi reported as the mean of the three readings. End-expiratory trapped lung volume (Vtrapped) was determined by the end-inspiratory apnea technique [6]. Briefly, the patient was disconnected from the ven-tilator at end-inspiration, and the total exhaled volume measured with the spirometer, until expiratory flow was no longer detect-able. Total exhaled volume represents total end-inspiratory volume (VEI) above functional residual capacity. Vtrappedat end-expiration was then computed as: Vtrapped=VEI−measured VT. Measured VT was determined as the mean of the last five breaths before the ma-neuver [6].
Heart rate and mean systemic arterial pressure were continu-ously monitored by standard three-lead monitoring electrodes and an indwelling arterial catheter, respectively. Arterial oxygen satu-ration was continuously monitored by pulse oximetry.
Ventilation-perfusion relationships
by the multiple inert gas elimination technique
The distribution of the V.A/Q. values was assessed by the multiple inert gas elimination technique (MIGET) [20]. Briefly, six inert gases of varying solubility (SF6, ethane, cyclopropane, halo-thane, ether, and acetone) were equilibrated in 0.9% NaCl and were infused at a constant rate of 3 ml/min through the central venous line. After a 30-min equilibration period 10 ml blood
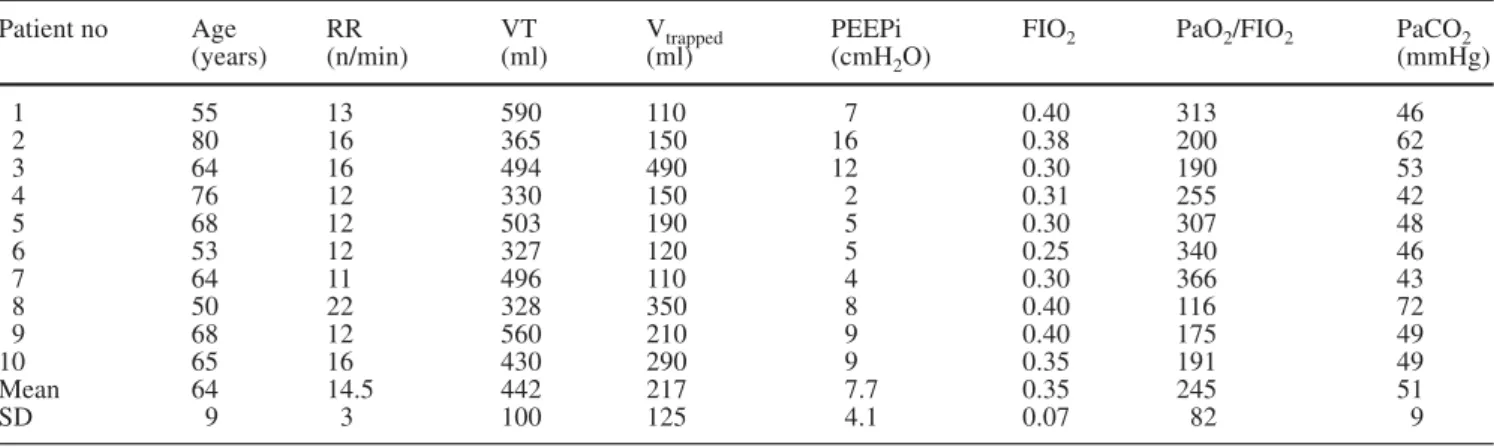
Table 1 Patients’ baseline characteristics (PEEPi intrinsic positive end-expiratory pressure, RR respiratory rate, VT tidal volume,
Vtrappedvolume of gas trapped in the lungs at end-expiration)
Patient no Age RR VT Vtrapped PEEPi FIO2 PaO2/FIO2 PaCO2
(years) (n/min) (ml) (ml) (cmH2O) (mmHg) 1 55 13 590 110 7 0.40 313 46 2 80 16 365 150 16 0.38 200 62 3 64 16 494 490 12 0.30 190 53 4 76 12 330 150 2 0.31 255 42 5 68 12 503 190 5 0.30 307 48 6 53 12 327 120 5 0.25 340 46 7 64 11 496 110 4 0.30 366 43 8 50 22 328 350 8 0.40 116 72 9 68 12 560 210 9 0.40 175 49 10 65 16 430 290 9 0.35 191 49 Mean 64 14.5 442 217 7.7 0.35 245 51 SD 9 3 100 125 4.1 0.07 82 9
samples from the peripheral artery and 5 ml blood samples from the pulmonary artery catheter, if present, or the central venous line were withdrawn into 20-ml heparinized glass syringes. Cen-tral venous sampling is an acceptable alternative in the absence of a pulmonary artery catheter [21]. Samples of mixed expired gas were collected from the exhaust port of the ventilator into 50 ml gas-tight syringes (Hamilton 50 TLL, Hamilton, Reno, Nev., USA). A gas chromatograph (Perkin Elmer, Shelton Conn., USA) equipped with an electron capture detector for SF6 and a flame ionization detector for the other five gases was used to de-termine the inert gas concentrations. Retention (ratio of arterial to mixed venous concentration) and excretion (ratio of mixed ex-pired air to mixed venous concentration) were computed for each gas. The continuous distribution of blood flow and ventilation against the ventilation-perfusion ratios from these data were calculated by the computer program developed by Evans and Wagner [22]. Disp R-E*, an overall index of V.A/Q. heterogeneity, was also determined. The residual sum of squares, a quantitative estimation of the overall experimental error in the procedure, was computed [23]. In high-quality measurements the residual sum of squares between the measured and calculated V.A/Q. distributions should be less than 5.3 in 50% and less than 10.6 in 90% of all data sets [23].
Cardiac output and oxygen transport
If a pulmonary artery catheter was in place, cardiac output was de-termined by thermodilution. In the absence of such a catheter, car-diac output was estimated by the Fick method, using central ve-nous rather than mixed veve-nous blood samples. Oxygen transport (D.O2) was computed according to standard equations. Oxygen consumption (V.O2) was determined from the inspired-expired O2 concentrations.
Measurement protocol
A complete set of all measurements was performed at the follow-ing time points: (a) upon startfollow-ing the protocol, no PEEPe (air/O2 ZEEP1); (b) after 30 min of He/O2inhalation, no PEEPe (He/O2 ZEEP); (c) after 30 min of air/O2inhalation, no PEEPe (air/O2 ZEEP 2); (d) after 30 min of air/O2inhalation, PEEPe, set as 80% of PEEPi measured at air/O2ZEEP 2 (air/O2PEEPe). The mean level of PEEP applied at air/O2PEEPe was 6.4±4 cmH2O.
Statistical methods
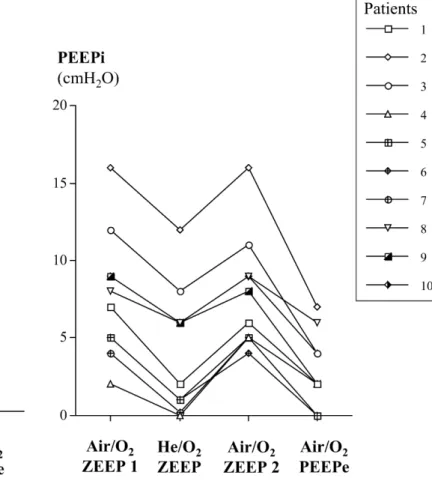
Values are reported as mean ±standard deviation. One-way analy-sis of variance for repeated measures was used to compare the val-ues obtained at each of the four conditions. Significance between time points was determined by Fisher’s protected least signifi-cance test. A p value less than 0.05 was considered significant. Fig. 1 Intrinsic PEEP and trapped gas volume. Individual values
of trapped gas volume (Vtrapped, left) and intrinsic PEEP (PEEPi,
right) under all conditions tested. Air/O2ZEEP 1 Initial settings
made by clinician, no PEEP; He/O2ZEEP after 30 min of He/O2
inhalation, no PEEPe; air/O2ZEEP 2 after 30 min of air/O2 inha-lation, no PEEP; air/O2PEEPe after 30 min of air/O2inhalation, PEEPe 80% of PEEPi measured at air/O2ZEEP 2
Results
Ventilatory parameters PEEPi and respiratory mechanics
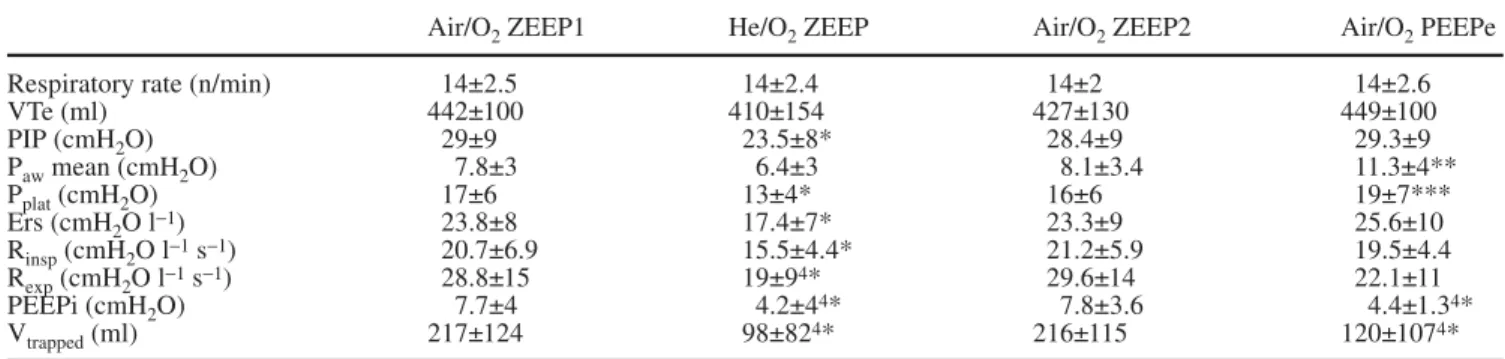
As shown in Table 2, He/O
2led to a significant reduction
in peak (PIP) and plateau (P
plat) pressures, Ers, and both
R
inspand R
exp. Conversely, PEEPe significantly increased
mean airway pressure and P
plat, while there was a trend
to-wards a rise in PIP and Ers. R
inspand R
expwere not
signif-icantly affected by PEEPe. V
trappedand PEEPi were both
comparably reduced by He/O
2and PEEPe (Table 2), this
response being present in all patients, as shown in Fig. 1.
Fig. 2 Total and external PEEP. Individual measured levels of to-tal PEEP (PEEPtot), determined by the end-expiratory occlusion technique, during He/O2 inhalation (A, left) and external PEEP (PEEPe) application (B, right). A Magnitude of PEEPtot (i.e., in-trinsic PEEP, since no PEEPe was applied) during air/O2(white
bars) and He/O2(black bars) inhalation. B Magnitude of PEEPtot with air/O2and ZEEP (white bars), and air/O2and PEEPe applica-tion, partitioned into PEEPi (black area) and PEEPe (hatched
area) components
peak inspiratory pressure, Paw airway pressure, Pplat plateau pres- expiration) trapped
Air/O2ZEEP1 He/O2ZEEP Air/O2ZEEP2 Air/O2PEEPe
Respiratory rate (n/min) 14±2.5 14±2.4 14±2 14±2.6
VTe (ml) 442±100 410±154 427±130 449±100 PIP (cmH2O) 29±9 23.5±8* 28.4±9 29.3±9 Pawmean (cmH2O) 7.8±3 6.4±3 8.1±3.4 11.3±4** Pplat(cmH2O) 17±6 13±4* 16±6 19±7*** Ers (cmH2O l−1) 23.8±8 17.4±7* 23.3±9 25.6±10 Rinsp(cmH2O l−1s−1) 20.7±6.9 15.5±4.4* 21.2±5.9 19.5±4.4 Rexp(cmH2O l−1s−1) 28.8±15 19±94* 29.6±14 22.1±11 PEEPi (cmH2O) 7.7±4 4.2±44* 7.8±3.6 4.4±1.34* Vtrapped(ml) 217±124 98±824* 216±115 120±1074*
*p<0.001 vs. air/O2ZEEP 1, ZEEP 2 and air/O2 PEEPe, **p<0.01 vs. air/O2 ZEEP 1, ZEEP 2 and He/O2ZEEP, ***p<0.05 vs. air/O2ZEEP 2, 4*p<0.001 vs. air/O
However, PEEPtot differed markedly between these two
conditions (Fig. 2). With He/O
2, as expected, since PEEPi
was reduced in all patients and no PEEPe was applied,
PEEPtot was also decreased in all patients. With PEEPe,
even though PEEPi decreased in all patients, PEEPtot
de-creased in only two (patients 5 and 7), was unchanged in
three (patients 1, 6, and 9), and increased in five (patients
2, 3, 4, 8, and 10), as shown in Fig. 2.
Arterial blood gases and V
.
A/Q
.
relationships
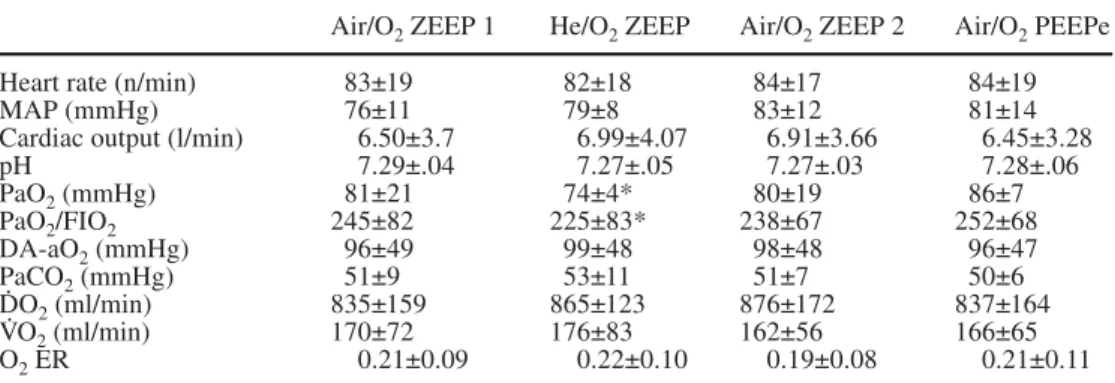
No significant modification in arterial pH or arterial
blood gases was observed during the study, with the
ex-ception of a decrease in arterial oxygenation during
He/O
2inhalation (Table 3). MIGET analysis (Table 4)
showed a small shunt at baseline, with most of the
perfu-sion directed to areas of intermediate or normal V
.
A/Q
.
. A
high deadspace fraction was present at baseline, the
re-maining ventilation being distributed mainly to areas of
intermediate or normal V
.
A/Q
.
. He/O
2exerted little change
on V
.
A/Q
.
relationships. No significant V
.
A/Q
.
modification
was observed with PEEPe. MIGET tracings from a
typi-cal patient are shown in Fig. 3. V
.
A/Q
.
heterogeneity,
quantified by the Disp R-E* index, was not significantly
modified by either He/O
2or PEEPe (Table 4). Mean
overall residual sum of squares was 3.02±1.84, and was
less than 5.3 in 80% of data sets, well within the range of
high technical quality measurements [23].
Hemodynamics and oxygen transport
No significant changes in arterial blood pressure, heart
rate D
.
O
2, or V
.
O
2were noted during the various phases
of the study (Table 3)
Table 3 Hemodynamics, arterial blood gases and oxygen transport (DA-aO2 alveoloarterial O2 difference, D.O2 O2transport,
MAP mean systemic arterial
pressure, V.O2 O2consumption,
O2ER O2extraction ratio)
Air/O2ZEEP 1 He/O2ZEEP Air/O2ZEEP 2 Air/O2PEEPe
Heart rate (n/min) 83±19 82±18 84±17 84±19
MAP (mmHg) 76±11 79±8 83±12 81±14
Cardiac output (l/min) 6.50±3.7 6.99±4.07 6.91±3.66 6.45±3.28
pH 7.29±.04 7.27±.05 7.27±.03 7.28±.06 PaO2(mmHg) 81±21 74±4* 80±19 86±7 PaO2/FIO2 245±82 225±83* 238±67 252±68 DA-aO2(mmHg) 96±49 99±48 98±48 96±47 PaCO2(mmHg) 51±9 53±11 51±7 50±6 D.O2(ml/min) 835±159 865±123 876±172 837±164 V.O2(ml/min) 170±72 176±83 162±56 166±65 O2ER 0.21±0.09 0.22±0.10 0.19±0.08 0.21±0.11 *p<0.01 vs. air/O2 ZEEP 1 and air/O2PEEP
(analysis of variance)
Table 4 Results of multiple in-ert gas elimination technique (DISP R-E* index of dispersion of ventilation/perfusion ratios, corrected for deadspace, RSS residual sum of squares, %Q.T
percentage of pulmonary blood flow,V.A/Q.ventilation to perfu-sion ratio, % VE percentage of minute ventilation, Log SD Q. log standard deviation of perfu-sion, LogSD V.log standard de-viation of ventilation distribu-tion)
Air/O2ZEEP1 He/O2ZEEP Air/O2ZEEP2 Air/O2PEEPe Perfusion Shunt (% Q.T) 6.8±10 7.5±12.2 5.9±10.3 7.7±13.6 0.005<V.A/Q.<0.01 (% Q.T) 4.4±6.1 4.1±4.7 4.1±3.9 2.7±2.5 0.01<V.A/Q.<0.1 (% Q.T) 15.8±10.6 23.7±12.7 23.4±14.9 17.2±14.1 0.1<V.A/Q.<1 (% Q.T) 62.1±18 56.4±18.7 57.1±18.2 61.3±17.8 1<V.A/Q.<10 (% Q.T) 10.9±8.8 8.3±8.1 9.5±9.2 11.1±9.8 10<V.A/Q.<100 (% Q.T) 0.05±0.08 0.07±0.13 0.00±0.00 0.02±0.06 Mean Q. (l/min) 0.27±0.12 0.20±0.09* 0.21±0.09 0.27±0.11 Log SD Q. 1.34±0.33 1.44±0.33 1.42±0.31 1.31±0.28 Ventilation Deadspace (% VE) 64.9±8.4 66.3±7.6 65.2±9.0 65.4±8.1 0.005<V.A/Q.<0.01 (% VE) 0.02±0.04 0.03±0.05 0.02±0.04 0.01±0.03 0.01<V.A/Q.<0.1 (% VE) 0.5±0.4 1.0±0.8 0.8±0.6 0.6±0.6 0.1<V.A/Q.<1 (% VE) 19.9±.71 18.7±5.5 20.7±7.1 20.2±6.9 1<V.A/Q.<10 (%VE) 14.3±7.2 13.75±7.6 13.2±6.9 13.6±7.1 10<V.A/Q.<100 (% VE) 0.43±0.71 0.57±1.03 0.00±0.00 0.02±0.06 Mean V.A(l/min) 0.99±0.36 0.95±0.22 0.84±0.25 0.88±0.36 Log SD V. 1.0±0.26 1.08±0.24 0.97±0.22 0.89±0.30 RSS 2.61±1.92 3.92±2.39 3.23±1.75 2.31±0.80 Disp R-E* 17.6±10.2 21.9±7.9 19.2±7.7 18±8.8
Complications
No complication occurred during any of the protocol
phases.
Discussion
The main findings of this study in a group of sedated,
paralyzed, and mechanically ventilated COPD patients
with moderate levels of PEEPi are that He/O
2reduced
PEEPi and V
trapped, airway pressures and resistances, and
elastance at a small cost in arterial oxygenation.
Con-versely, PEEPe set at 80% of measured PEEPi, reduced
PEEPi and V
trappedbut increased airway pressures and in
most patients PEEPtot. Neither approach significantly
affected V
.
A/Q
.
distribution.
Effects of He/O
2The observed effects of He/O
2on PEEPi and respiratory
mechanics are consistent with those documented in a
previous study in intubated, sedated, paralyzed patients
undergoing controlled mechanical ventilation, with
com-parable levels of PEEPi, in which He/O
2led to a marked
decrease in V
trappedand PEEPi in 22/23 patients [13].
The concordant results from the two studies, with effects
observed in almost every patient, provides further
evi-dence that He/O
2, due to its low density and resultant
re-duction in airway resistance, effectively attenuates
dy-namic hyperinflation/PEEPi in this setting. It should be
noted nonetheless that He/O
2has no impact on the cause
of obstructive disease and airflow limitation. Thus its
ef-fects disappear once its administration is discontinued,
as shown by the rapid return to baseline values of PEEPi
and V
trappedin both our studies when He/O
2inhalation
was stopped. Consequently the use of He/O
2should not
deter ICU physicians from aiming to decrease airway
ob-struction with bronchodilating drugs, and avoiding
ex-cessive respiratory rate and VT settings on the ventilator
[4]. Among concerns regarding the use of He/O
2in
Fig. 3 MIGET evaluation of V.A/Q. relationships. Representative MIGET tracings obtained in the four study conditions in one patient. White dots Ventilation; black dots perfusion; S shunt; Ds deadspace
COPD patients is a possible worsening of arterial
oxy-genation, documented in studies performed in
spontane-ously breathing nondecompensated patients [15, 16]. In
one study He/O
2breathing entailed a decrease in PaO
2,
hypothesized to result from an increase in the
heteroge-neity of V
.
A/Q
.
distribution [16]. Another study
document-ed an increase in the alveoloarterial O
2gradient during
He/O
2inhalation [15]. MIGET analysis was consistent
with a diffusion impairment for O
2, attributed by the
au-thors to a proximal displacement of the transition from
convective to diffusive gas transfer processes [15, 24].
Finally, a slight decrease in PaO
2with He/O
2compared
to air/O
2was also noted in a study by Christopherson
and Hlastala [25], in mechanically ventilated dogs,
with-out significant change in MIGET results, and also
attrib-uted by the authors to displacement of the
convec-tive/diffusive front in the airways [15, 24, 25]. However,
whether these results can be extrapolated to
decompen-sated and mechanically ventilated patients is unclear
since in a previous study on patients undergoing
me-chanical ventilation we found no impact of He/O
2on
ar-terial oxygenation [13]. It should also be noted that a
de-crease in alveolar ventilation, suggested by the slight rise
in PaCO
2with He/O
2, could also have contributed in the
decrease in PaO
2.
Our MIGET results are in line with these observations.
Overall the baseline pattern of a small fraction of shunt
and perfusion to low V
.
A/Q
.
regions, perfusion
predominat-ing in regions of V
.
A/Q
.
=1, and high deadspace (Table 4) is
consistent with both the so-called “H” pattern described
by Wagner et al. [26] in stable spontaneously breathing
patients with severe COPD and the profile found in two
studies in COPD patients during controlled mechanical
ventilation [8, 27]. In our study no significant change was
observed with He/O
2, thus excluding a major effect of
He/O
2on shunt, low V
.
A/Q
.
or worsening of V
.
A/Q
.
inequali-ty. The convective/diffusion front theory mentioned above
could explain these results [24], the small magnitude of
worsening hypoxemia being in line with that observed in
other studies [15, 25]. Indeed, the magnitude of worsening
of hypoxemia was small (8%) and is probably of
negligi-ble clinical importance in patients receiving a mean FIO
2of 0.35. Why these findings differed from those of our
preceding study [13] in a comparable patient population
and setting is not immediately clear. However, in the
earli-er study patients wearli-ere ventilated for 45 min with He/O
2,
compared to the 30 min in the present study, possibly
al-lowing any time-dependent short-term V
.
A/Q
.
heterogeneity
to subside. Furthermore, there was a trend towards a
de-crease in PaO
2in the former study with He/O
2, by 6%,
al-though the difference was not statistically significant [13].
Of importance, and in the same line of thought, no
wors-ening of hypoxemia was noted during noninvasive
pres-sure support with He/O
2in decompensated COPD patients
in two recent studies [18, 28]. Finally, a recent study on
the impact of various inspiratory flow waveforms in
me-chanically ventilated COPD patients demonstrated that
square wave inspiratory flow as used in the present study
was less favorable on gas exchange than decelerating flow
[29]. This factor might have contributed to our results. To
summarize, it seems that a reduction in PaO
2during
He/O
2inhalation in this setting is either absent or of very
small magnitude and probably represents a minor price to
pay for the major beneficial effects on dynamic
hyperin-flation and respiratory mechanics.
Regarding PaCO
2, the absence of change with He/O
2was somewhat surprising, given that two studies using
noninvasive ventilation documented a reduction in
PaCO
2with He/O
2, possibly due to improved CO
2diffu-sion [18, 28]. However, the results are in accord with
those of our previous study in intubated and
mechanical-ly ventilated patients [13] and are in line with the
ab-sence of change in the V
.
A/Q
.
results, in particular
dead-space (Table 4).
Effects of PEEPe
In patients with PEEPi undergoing spontaneous/assisted
mechanical ventilation, applying PEEPe has been shown
to reduce the inspiratory threshold load, ease triggering of
the ventilator, and reduce work of breathing [30, 31].
However, any benefit of PEEPe during controlled
ventila-tion is much less obvious [4], as underlined in a recent
publication [19] and as demonstrated in various studies
[8, 11, 32]. In a study using the MIGET in COPD patients
during controlled ventilation, Rossi et al. [8] showed that
when PEEPe at 50% of measured PEEPi was applied, no
change in respiratory mechanics was noted, while PaO
2increased as a result of a rise in the mean value of the
dis-tribution of perfusion. However, when PEEPe equivalent
to 100% of PEEPi was applied, airway pressures rose,
and no further improvement in gas exchange was noted
[8]. It should also be mentioned that no change in oxygen
transport was noted with the application pf PEEPe, while
reducing PEEPi through controlled hypoventilation
in-creased cardiac output and oxygen transport [8]. This
could have resulted from a reduction of the adverse
he-modynamic effects of PEEPi and could also be observed
when PEEPi is decreased by He/O
2. However, we made
no such observation in our patients, probably because
there appeared to be little hemodynamic impact from
PE-EPi, as observed in a prior study [13]. Baigorri et al. [11]
showed that applying a PEEPe equal to measured PEEPi
led to an increase in end-expiratory volume, a rise in
in-trathoracic pressures, and no improvement in arterial
blood gases, while a decrease in cardiac output was noted
with a PEEPe exceeding PEEPi. Fernandez et al. [32]
ob-served that the increase in end-expiratory volume when
setting PEEPe equal to PEEPi was directly proportional
to respiratory system compliance, and hence that its
mag-nitude was difficult to predict in routine clinical
condi-ence of expiratory flow limitation added increments of
PEEPe progressively replace PEEPi, without increasing
total PEEP and lung volume, until a critical value of
PEEPe is reached, above which total PEEP and lung
vol-ume both increase [33, 34]. When the latter occurs,
in-creased respiratory system elastance, dein-creased cardiac
output and worsening of gas exchange occur [34].
These various issues have led to the recommendation
of either refraining from using PEEPe in the presence of
PEEPi during controlled mechanical ventilation [19], or
to not exceed values of 50–85% of measured PEEPi,
while carefully monitoring the consequences of its
appli-cation [4]. In our study the goal was to apply a PEEPe
equivalent to 80% of PEEPi. However, it is difficult to
as-certain that this goal was always attained, since although
we used the PEEPi measured during the third step (air/O
2ZEEP 2), it is well known that PEEPi can change fairly
quickly [35]. Thus it is possible that PEEPe levels equal
to or exceeding PEEPi were applied in some patients, as
our results suggest. Indeed, as shown in Fig. 2, in most
patients PEEPi was replaced by PEEPe, but total PEEP
was mainly unchanged or even increased. This
observa-tion is in line with the studies cited above demonstrating
that, in the absence of expiratory flow limitation, or if
ex-cessive PEEPe levels are used even if such a limitation is
present, worsening dynamic hyperinflation and its
com-plications can occur. A seminal study by Tuxen [9] has
il-lustrated how severe the latter can be. Interestingly, in the
latter study, as overall lung volume and total PEEP
in-creased when high levels of PEEPe were applied, V
trappeddecrease in airway resistance associated with the higher
lung volume [9]. A similar observation was made in our
patients (Fig. 1), probably for identical reasons.
Regard-ing gas exchange, the blood gas and MIGET results
showed no effect of PEEPe, which is in apparent
con-tradiction with the improvement in PaO
2due to a higher
mean value of the perfusion distribution observed by
Rossi et al. [8]. However, those favorable effects
oc-curred at a lower PEEPe (50% of PEEPi), and
disap-peared when PEEPe was equal to PEEPi, which again
suggests excessive PEEPe levels in at least some of our
patients. These observations underline the difficulty of
correctly titrating PEEPe in this context. Having said this,
low levels of PEEPe (
≤
50% of PEEPi) may still be of
benefit, by preventing alveolar derecruitment, as shown
by the study by Rossi et al. [8].
In conclusion, the present study shows that in COPD
patients undergoing controlled mechanical ventilation,
with PEEPi, He/O
2can be a valuable approach to
reduc-ing dynamic hyperinflation/PEEPi, while only slightly
impairing arterial oxygenation due to a reduction in the
mean value of perfusion distribution. Conversely, PEEPe
can prove difficult to titrate and can induce worsening of
dynamic hyperinflation, the latter probably offsetting
any benefit of PEEPe on arterial oxygenation. Hence in
patients with severe and symptomatic dynamic
hyperin-flation, as can occur during the first few days of
mechan-ical ventilation, He/O
2could prove to be a valuable
ap-proach, provided the various technical issues associated
with its use are known by ICU physicians.
References
1. Macklem PT (1984) Hyperinflation. Am Rev Respir Dis 129:1–2
2. Marini JJ (1989) Should PEEP be used in airflow obstruction? Am Rev Respir Dis 140:1–3
3. Pepe, P Marini J (1982) Occult positive end-expiratory pressure in mechanical-ly ventilated patients with airflow obstruction. Am Rev Respir Dis 126:166–170
4. Rossi A, Polese G, Brandi G, Conti G (1995) Intrinsic positive end-expiratory pressure. Intensive Care Med
21:522–536
5. Smith TC, Marini JJ (1988) Impact of PEEP on lung mechanics and work of breathing in severe airflow obstruction. J Appl Physiol 65:1488–1499
6. Tuxen D, Lane S (1987) The effects of ventilatory pattern on hyperinflation, airway pressures, and circulation in mechanical ventilation of patients with severe airflow obstruction. Am Rev Respir Dis 136:872–879
7. Bernasconi M, Brandolese R, R, Manzin E, Rossi A (1990) Dose-response effects and time course of effects of inhaled fenoterol on respiratory mechanics and arterial oxygen tension in mechanically venti-lated patients with chronic airflow obstruction. Intensive Care Med 16:108–114
8. Rossi A, Santos C, Roca J, Torres A, Félez MA, Rodriguez-Roisin R (1994) Effects of PEEP on VA/Q mismatching in ventilated patients with chronic air-flow obstruction. Am J Respir Crit Care Med 149:1077–1084
9. Tuxen D (1989) Detrimental effects of positive end-expiratory pressure during controlled mechanical ventilation of patients with severe airflow obstruc-tion. Am Rev Respir Dis 140:5–9 10. Georgopoulos D, Gianoulli E, Patakas
D (1993) Effects of extrinsic positive end-expiratory pressure on mechanical-ly ventilated patients with chronic obstructive pulmonary disease and dynamic hyperinflation. Intensive Care Med 19:197–203
11. Baigorri F, De Monte A, Blanch L, Fernandez R, Vallés J, Mestre J, Saura P, Artigas A (1994) Hemodynamic responses to external counterbalancing of auto-positive end-expiratory pres-sure in mechanically ventilated patients with chronic obstructive pulmonary disease. Crit Care Med 22:1782–1791 12. Papamoschou D (1995) Theoretical
validation of the respiratory benefits of helium-oxygen mixtures. Respir Physiol 99:183–199
13. Tassaux D, Jolliet P, Roeseler J, Chevrolet JC (2000) Effects of helium-oxygen on intrinsic positive end-expi-ratory pressure in intubated and mechanically ventilated patients with severe chronic obstructive pulmonary disease. Crit Care Med 28:2721–2728 14. Tassaux D, Jolliet P, Thouret JM,
Roeseler J, Dorne R, Chevrolet JC (1999) Calibration of seven ICU ventilators for mechanical ventilation with helium-oxygen mixtures. Am J Respir Crit Care Med 160:22–32
15. Manier G, Guénard H, Castaing Y, Varène N (1983) Respiratory gas exchange under heliox breathing in COPD studied by the inert gas method. Bull Eur Physiopathol Respir
19:401–406
16. Thiriet M, Douguet D, Bonnet JC, Canonne C, Hatzfeld C (1979) The ef-fect on gas mixing of a He-O2mixture in chronic obstructive lung disease. Bull Eur Physiopathol Respir 15:1053–1068
17. Pauwels RA, Buist S, Calverley PMA, Jenkins CR, Hurd SS (2001) Global strategy for the diagnosis, manage-ment, and prevention of chronic ob-structive pulmonary disease. Am J Re-spir Crit Care Med 163:1256–1276 18. Jolliet P, Tassaux D, Thouret JM,
Chevrolet JC (1999) Beneficial effects of helium-oxygen vs. air-oxygen non-invasive pressure support in decom-pensated COPD patients. Crit Care Med 27:2422–2429
19. Brochard L (2002) Intrinsic (or auto-) PEEP during controlled mechanical ventilation. Intensive Care Med 28:1376–1378
20. Wagner PD, Saltzmann HA, West JB (1974) Measurement of continuous distributions of ventilation-perfusion ratios: theory. J Appl Physiol 36:588–599
21. Wagner PD, Smith CM, Davies NJH, McEvoy RD, Gale GE (1985) Estima-tion of ventilaEstima-tion-perfusion inequality by inert gas elimination without arterial sampling. J Appl Physiol 59:376–383
22. Evans JW, Wagner PD (1977) Limits on VA/Q distributions from analysis of experimental inert gas elimination. J Appl Physiol 42:889–898
23. Roca J, Wagner PD (1994) Principles and information content of the multiple inert gas elimination technique. Thorax 49:815–824
24. Paiva M, Engel LA (1979) Pulmonary interdependence of gas transport. J Appl Physiol 47:296–305 25. Christopherson SK, Hlastala MP
(1982) Pulmonary gas exchange during altered density gas breathing. J Appl Physiol 52:221–225
26. Wagner PD, Dantzker DR, Dueck R, Clausen JL, West JB (1977) Ventila-tion-perfusion inequality in chronic obstructive pulmonary disease. J Clin Invest 59:203–216
27. Torres A, Reyes A, Roca J, Wagner PD, Rodriguez-Roisin R (1989) Ventilation-perfusion mismatching in chronic obstructive pulmonary disease during ventilator weaning. Am Rev Respir Dis 140:1246–1250 28. Jaber S, Fodil R, Carlucci A,
Boussarsar M, Pigeot J, Lemaire F, Harf A, Lofaso F, Isabey D, Brochard L (2000) Noninvasive ventilation with helium-oxygen in acute exacerbations of chronic obstructive pulmonary disease. Am J Respir Crit Care Med 161:1191–1200
29. Yang SC, Yang SP (2002) Effects of inspiratory flow waveforms on lung mechanics, gas exchange, and respira-tory metabolism in COPD patients during mechanical ventilation. Chest 122:2096–2104
30. Guérin C, Milic-Emili J, Fournier G (2000) Effect of PEEP on work of breathing in mechanically ventilated COPD patients. Intensive Care Med 26:1207–1214
31. Nava S, Bruschi C, Rubini F, Palo A, Iotti G, Braschi A (1995) Respiratory response and inspiratory effort during pressure support ventilation in COPD patients. Intensive Care Med 21:871–879
32. Fernandez Mondejar E, Mata GV, Navarro PN, Fernandez RR, Ruiz JMT, Carazo E (1992) Increase in lung volume originated by extrinsic PEEP
in patients with auto-PEEP. Intensive Care Med 18:269–273
33. Gay P, Rodarte J, Hubmayr R (1989) The effects of positive expiratory pres-sure on isovolume flow and dynamic hyperinflation in patients receiving mechanical ventilation. Am Rev Respir Dis 139:621–626
34. Ranieri VM, Giuliani R, Cinnella G, Pesce C, Brienza N, Ippolito EL, Pomo V, Fiore T, Gottfried SB, Brienza A (1993) Physiologic effects of positive end-expiratory pressure in patients with chronic obstructive pulmonary disease during acute ventilatory failure and controlled mechanical ventilation. Am Rev Respir Dis 147:5–13
35. Patel H, Yang KL (1995) The variabili-ty of intrinsic positive end-expiratory pressure in patients receiving mechani-cal ventilation. Crit Care Med 23:1074–1079