Élisabeth Algava
(**), Catherine Cavalin
(***), Sylvie Célérier
(****)The category of “self-employed” workers covers situations which are quite heterogeneous. The only
thing these workers seem to have in common is a similar pattern of working time characterized by
extensive working hours, flexitime, and a relative decisional autonomy. This article follows another
common feature, their health status, which the self-employed declare to be better than that of salaried
employees, even though on average the self-employed are a little older. This hypothesis is tested and
validated from several angles in particular by excluding the influence of socio-professional categories
which underlie the differences in employment status. The article also compares the consequences
of illness on professional activity in the different professional situations considered. The results
both confirm the relatively better health of the self-employed as well as suggest a unique mode of
articulation between health and work, justifying the continuation of studies on the health of this
particular group so as to better understand its characteristics and to complement our knowledge of
the general mechanisms by which health and work constantly reflect on each other.
Researchers’ interest in the category of self‑ employed workers has recently been reactivated by
the creation of a new auto-entrepreneur status. (1)
The success of the latter has furthered critical reflec‑ tions on the proposed solutions to unemployment and the deregulation this may entail. The new status is suspected of transferring the risks of productive activity to the individual without the latter gaining
any particular advantages. (2) Apart from this recent
interest, the situation of independents has rarely been studied. It is true that the boundaries of this group present sensitive questions reported on by the authors from the very first lines of their texts. They group together a variety of professional situations which are at the same time very typical and yet quite distinct from each other, whether in the nature of the activity; the socio‑professional categories involved; the status of employer or self‑employed individ‑
ual; (3) the type and amount of income; or the system
(*) Article published in French in Travail et emploi, nº 132, octobre‑décembre 2012.
(**) Ministère du Travail, de l’Emploi, de la Formation profes‑ sionnelle et du Dialogue social, Direction de l’animation de la recherche, des études et des statistiques (Dares); elisabeth. [email protected]
(***) Centre d’études européennes de Sciences Po, Centre d’études de l’emploi; [email protected]
(****) Centre d’études de l’emploi, Centre Pierre Naville‑Université d’Évry‑Val‑d’Essonne; sylvie.celerier@cee‑ recherche.fr
(1) Loi du 4 août 2008 de modernisation de l’économie, n° 2008‑776, JO, 5 August 2008, p. 1271.
(2) See for example: Levratto, Serverin (2009); Domens,
Pignier (2012).
(3) In 2005, 51% were self‑employed working alone, 40% were employers and 9% were unpaid family workers (Algava,
Vinck, 2009).
of social insurance utilized. In addition, statistical studies have to deal with populations whose size is often inadequate in conducting detailed analyses. The legal status of self‑employed does not designate a stabilized employment or work reality. It calls for extreme caution when it comes to looking for features which might be common to all its components.
Yet the literature recognizes one common feature of the self‑employed, one which it merely notes rather than studies. This concerns their working time, considered from the point of view of the temporal organization of their professional activities, and the control over it which they claim to have. We propose in this article to argue the case of another common characteristic, this time concerning their health status, particularly their better health relative to that of salaried workers. This seemingly more favour‑ able situation for the self‑employed has already been
noted in the literature and in part discussed. (4) But
these analyses are derived from a limited number of indicators, sometimes extracted from data which
are unrepresentative of the general population. (5)
Also the comparison with employees has been a general one while differing situations in status call for a differentiation by subgroup. A comparison of working conditions between salaried and non‑ salaried workers from the data of the Conditions de
travail, 2005 survey (Dares), for example, shows
the importance of such a differentiation. The results
(4) For example : Inserm (2011), chapter 5 : “État de santé
des travailleurs indépendants selon le secteur professionnel”, pp. 83‑97 ; Ha‑Vinh et al. (2010, 2011).
(5) For example: the data on long‑term illnesses (Affections de
highlight the similarities between the self‑employed and employees engaged in the same areas of activ‑ ity, including individual farmers and self‑employed crafts workers on the one hand and salaried workers on the other (Algava, Vinck, 2009). They thus reflect
the lesser importance of status.
If proven, the hypothesis of a correlation between self‑employment and relatively better health would indicate a singular mode of articulation between work and health that it would be of interest to study. Indeed, there is no reason to expect such a result, especially as it is well known that the self‑employed are on average older than employees. This would raise the question of what mechanisms might explain this singularity. The first that comes to mind –which primarily motivates our investigations– refers to the social insurance system attached to the status of self‑employment which is known to differ from that
of employees. (6) The health declarations of the self‑
employed give precisely the opportunity to explore this rarely considered but certainly formative aspect in understanding the links between health and work. In part related to this, we can also study the speci‑ ficity of this group’s statements concerning health conditions or their specificity in health care behav‑
iour, as some recent studies suggest (Amossé et
al., 2012). In short, this documents the need for a
research program which, however, necessitates as a first step establishing as rigorously as possible the reality of the relatively better health of the self‑ employed. A part of this article is devoted to this question.
The hypothesis of the relatively better health of the self‑employed is tested on the basis of statistical surveys conducted in representative samples of the general population which also offer a greater range of health indicators. The health characteristics discussed here are derived from these health indicators. It is reported by the workers and not inferred from
the characteristics of their working conditions. (7)
Specifically, we have used the following surveys:
Handicap Santé –volet ménages (HSM, handicap,
health‑household sample) organized by Drees and
Insee (8) in 2008, which surveyed 39,000 people,
including 931 employed non‑salaried workers; (9)
and Santé et itinéraire professionnel (SIP, health and professional career), organized by Drees and Dares in 2006, which surveyed 14,000 people, including 879
(6) For a detailed analysis of these differences, see Algava,
Cavalin, Célérier (2011).
(7) For a detailed presentation of this option, see Cavalin,
Célérier (2012a) and for an examination of the different
ways of understanding the links between work and health, see Cavalin, Célérier (2012b).
(8) Drees : Direction de la recherche, des études, de l’évaluation et des statistiques ; Insee : Institut national de la statistique et des études économiques.
(9) This survey links the themes of health and handicaps and continues the decadal survey Santé 2003 and Handicaps
Incapacités Dépendance (HID, 1998‑2001).
employed non‑salaried workers. These two surveys provide a wealth of indicators which are quite suffi‑ cient for our project. The size of their respective samples also allows for studying the different popu‑ lations in sufficient detail without many challenges to the statistical robustness of the results.
The study aimed at excluding three main statisti‑ cal devices which could form an artificial correlation between employment status and health. First are the structural effects of other variables such as age and gender that are known to be decisive in declarations of health conditions and which directly affect the self‑employed, as they are on average older than employees and are more often men. Second is the
possible effect of the social gradient (10) within the
statutory group –like the known gradient among salaried employees from managerial personnel to workers– which might favourably distinguish the independent professions. Solid advances in
the literature on this subject (11) indicate taking
into account the personal PCS (Classification of Socioprofessional Categories) supplemented today by other social characteristics of individuals such as income (itself linked to PCS), education, and the
social insurance status of the individual (Tubeuf,
2010) (12) which seem to structure health declarations
and health care behaviour. Finally, the last device to
consider is a possible selection by health status (13)
at the moment one enters or exits the employment status, such as exists for night work.
Our analyses confirm and clarify the relative health advantage of the self‑employed which can be considered as sufficiently robust to be a basis for a research program which will deepen our under‑ standing of the question. These analyses reject the hypothesis of indirect structural effects or internal compensation between subgroups which the litera‑ ture on health inequalities invites us to study. Where they exist, the inequality between individual farmers,
(10) This idea refers to what is also designated as social inequalities in health. The World Health Organisation (WHO) defines it in reference to a regular and general result:
“The data show that in general in a given country the more disadvantaged the socio‑economic position of an individual, the worse is his health: this social gradient concerns the entire socio‑economic scale, from top to bottom. It is a world‑wide phenomenon which can be seen in low‑ and middle‑income countries as well as those with high income. The social gradi‑ ent indicates that health inequalities affect everyone.” For a complete definition of the concept see the web site of the WHO: http://www.who.int/social_determinants/thecommission/ finalreport/key_concepts/en/
(11) Particularly Cambois et al. (2008) for life expectancy and
disability‑free life expectancy and, more generally on the same theme, see the complete bibliography compiled by the Institut de recherche et documentation en économie de la santé (IRDES) in 2012 and available at the following address: http://www. irdes.fr/EspaceDoc/DossiersBiblios/InegalitesSocialesSante. pdf. See also Beh (2011).
(12) See also Chauvel (2001) for the complexity of the “social
classes” approach.
(13) Also called the “effet du travailleur en bonne santé” or the “Healthy Worker Effect”.
merchants and self‑employed crafts workers on the one hand and the self‑employed professionals on the other are never as complete, nor do they always act in the same direction as those observed between management personnel and salaried workers. This non‑conformity with a repeatedly and universally observed result is an unexpected consequence of our investigation, confirming the interest which the question presents and for which we now define the contours. There remains the possibility of a selec‑ tion by health criteria which cannot be ruled out as
strongly in the absence of longitudinal data. (14)
The available cross‑sectional surveys are not, however, lacking in possibilities. We have used the retrospective data of the SIP survey, asking respondents about what they remember of their professional career and the health problems they have encountered. When health problems occur, the data describe a slight evolution from the non‑ salaried status towards the salaried personnel one. However, the data is not sufficiently clear to demon‑ strate a healthy worker effect. The population and the size of the changes involved are low, and survey respondents’ memory may be uncertain. However, efforts in this direction are far from being useless. They encourage to study the compared effects of the occurrence of a health problem on the course of a professional career according to the employ‑ ment status and to take into consideration certain events such as sick leave or modulation of working hours. In these incidents we find some characteris‑ tics specific to the status of self-employed, both in terms of the type of work done (hours) as well as in the characteristics of their insurance systems (sick leave). In raising the question of a possible healthy worker effect, we are therefore already considering the sources of the health advantage found.
In presenting all of these analyses, our remarks are divided into two relatively independent sections concerning the issues addressed and the resources mobilized. The first considers the statistical finding of the relatively better health of the self‑employed which we attempt to prove by distinguishing the effects of structure and the interaction of social inequalities in health. We also note some key dimen‑ sions of the temporal organization of self‑employed activity that are specific to the group and may weigh as constraints on health. The second part presents the consequences of the considerations on the healthy worker effect and compares the situation of the self‑employed to that of employees when illness strikes. We follow over several years the effects of illness on the course of their professional career, the nature and intensity of their use of sick leave and the extent of their ability to adjust their working time.
(14) The 2010 edition of the SIP survey will make this possible with 11,000 of the 14,000 of those who had answered the 2006 questionnaire having been questioned again for the more recent survey.
T
he Health of the Self-Employed:
the Other Specificity of a
Heterogeneous Group
As a diverse group, the self‑employed pose a question at the outset concerning their defin‑ ing characteristics, none of which having up to now achieved consensus agreement. The most commonly used, and which we will use ourselves despite its ambiguities, comes from public statis‑
tics. This is the category of non‑salaried workers (15)
in contrast to wage labour, although there is not a perfect distinction between the two. This distinction is questionable as the border between self‑employ‑ ment and wage‑earning sometimes seems to be a
rather weak one (Rolle, 1988). Many legal deci‑
sions in France regularly recognize multiple forms of subjugation which are disguised under formal
situations of legal “independence” (Maurin et al.,
1999; Supiot, 2009). Conversely, some groups of
employees such as managerial personnel and higher intellectual professions or even some intermedi‑ ate professions enjoy a professional independence which is quite comparable to that which is supposed to characterize the self‑employed. Finally, indi‑ viduals often cross employment status borders themselves during their careers. The SIP survey of 2006 tells us that more often they cross over from‑wage earners to self‑employed, most of the self‑employed (71%) having already had an expe‑ rience as wage‑earners. The reverse evolution only applies to 5% of employees who say that they had gone through a period with the employment status of self‑employed.
Based on the statistical convention adopted, some three million people make up the non‑sala‑
ried group in 2010, (16) more than in 2009 and
2008. These three million represented 11% of the employed labour force, with an obvious –and for this group a systematic– imbalance between men
(68%) and women. (17) The data collected in Table
1 complete the presentation of the group demon‑ strating its heterogeneity, presented here in terms of
(15) The Insee nomenclature groups together the self‑ employed, those who declare helping a member of their family in his work without being paid (unpaid family workers), and non‑salaried entrepreneurs who employ other workers. The category is not without ambiguities, however, as it also includes general managers, minority managers and their part‑ ners. Although the “self‑employed” workers do not exactly match the “non‑salaried” group as they include some salaried workers in the French statistical nomenclature, in this text we will use the terms “self‑employed” and “non‑salaried” as approximate equivalents in accordance with the established French practice.
(16) Emploi en continu survey (EEC, Insee, 2010).
(17) Another internal imbalance among the self‑employed: three quarters of the unpaid family workers are women while they represent 30 per cent of the self‑employed and entrepre‑ neurs (EEC, Insee, 2013).
living standards and diplomas (see the shaded boxes for each sub‑category). (18)
Working Time
The diversity of this group is also confirmed in terms of the working conditions of the various components of non‑salaried workers. The analy‑ ses confirm the importance of the actual activity for which, as we have seen, they are much closer to their equivalent wage‑earners than they are to
those who share their self‑employed status (Gollac,
Volkoff, 2000). However, one dimension is an
exception, bringing together all self‑employed and distinguishing them from employees. This concerns the temporal organization of their professional activities, from the dual point of view of the time spent working and what is still called the influence of work over daily life. (19) Indeed, regardless of the
survey considered, non‑salaried workers still report a greater number of hours worked than salaried workers do, even when they are managerial person‑ nel. The last measure of the Emploi du temps survey (2010) records working time for the self‑employed
(18) “The available information on self‑employed income is approximate and difficult to use” (Bessière et al., 2011) due
to the annual variations in the revenues of individual farmers, the revenue which a non‑salaried worker may or may not pay himself according to the amount of profits he reinvests in his business, and the reliability of tax declarations. The limited relevance of the “standard of living” variable (Insee, 2009)
calls for looking at the patrimony of the self‑employed. But this is not available in the declarative survey data on health used here.
(19) This indicator demonstrates a strong permeability between work time and time in private life. It includes five characteris‑ tics of work organisation which are given in detail in Table 2 and which, if three of these conditions are fulfilled, would indi‑ cate “a very strong influence of work on private life.”
as being 10.5 hours per week higher on the average
than for employees (Ricroch, Roumier, 2011). (20)
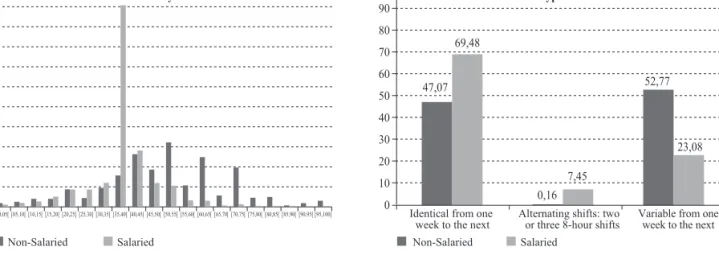
Depending on employment status, the data from the Emploi en continu 2010 survey (Insee) also draw very different temporal profiles regarding reported work time and weekly rhythm. While weekly working hours for employees are centred, as expected, around the legal limit, those of non‑salaried workers are much more spread out, extending to the 60‑65 hour range (see Graph). The self‑employed report a greater variability of their working time from one week to another, as in the data from the Conditions de travail survey (2005) which have also shown that they work a greater number of days of the week, usually includ‑ ing Saturday and, more rarely, Sunday. Adding other constraints linked to working time, the same survey has concluded that work has a ten times great influ‑ ence over daily life for non‑salaried workers than it has for employees (see Table 2). While it is true that the distinction by component of non‑salaried workers shows disparities –especially between farmers and self‑employed professionals– nevertheless the respec‑ tive values are higher than those for employees. (21)
The regularity with which the literature records the differences in work time profiles of employees and non‑salaried workers demonstrates the robustness of this characteristic and its quasi‑structural char‑ acter. In the typology of working time organization
which Alain Chenu has distinguished from the data
of the Emploi du temps survey of 1999, the working time of the self-employed is sufficient to distinguish them from all others interviewed, creating by them‑
selves one of the six identified types (Chenu, 2002).
(20) That is a difference which is four hours less than during the previous equivalent survey conducted in 1999. This reduction can essentially be explained by a greater number of vacation days for the self‑employed and not by a reduction in the average work time for a full work week.
(21) With the exception of night work which is always less.
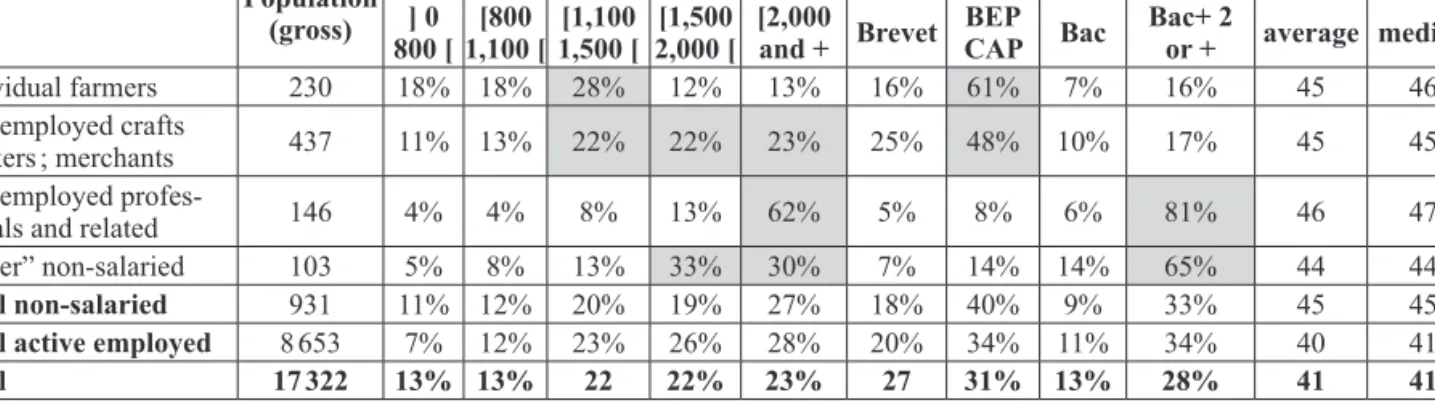
Table 1: Characteristics of Self-Employed by Component Sub-Categories Population
(gross)
Standard of living (euros) Highest diploma obtained* Age
] 0
800 [1,100 [[800 1,500 [[1,100 2,000 [[1,500 [2,000 and + Brevet BEP CAP Bac Bac+ 2 or + average median
Individual farmers 230 18% 18% 28% 12% 13% 16% 61% 7% 16% 45 46
Self‑employed crafts
workers ; merchants 437 11% 13% 22% 22% 23% 25% 48% 10% 17% 45 45
Self‑employed profes‑
sionals and related 146 4% 4% 8% 13% 62% 5% 8% 6% 81% 46 47
“Other” non‑salaried 103 5% 8% 13% 33% 30% 7% 14% 14% 65% 44 44
Total non-salaried 931 11% 12% 20% 19% 27% 18% 40% 9% 33% 45 45
Total active employed 8 653 7% 12% 23% 26% 28% 20% 34% 11% 34% 40 41
Total 17 322 13% 13% 22 22% 23% 27 31% 13% 28% 41 41
* Brevet = middle school diploma; BEP, CAP = professional and vocational diplomas; BAC = high school diploma; BAC+ 2 or + = post-high school diplomas.
Reading note: 18 per cent of individual farmers receive an income per consumer unit of less than 800 euros while 4 per cent of self-employed professionals and related are in the same case.
Population: Residents in metropolitan France in ordinary households from 18 to 65 years old. Source: Handicap Santé Ménages, 2008 survey, Insee-Drees.
In this type are combined long working time hours, spread over at least six weekdays, with large varia‑ tions from one week to another; work done at home being more common; very little night work; a rela‑ tive autonomy of temporal organization detected through a greater freedom to decide when to take
breaks; and the feeling of a constant lack of time. (22)
Common Health Features
We propose adding another characteristic to this distinctive feature of the self‑employed regarding the temporal organization of their work: their decla‑ rations concerning their health. The proposal calls
(22) Several years earlier, Nathalie Missègue (2000) came to similar conclusions from the data of the Emploi survey of 2005 and of its ad hoc module on working time.
for some clarification because, if we admit –some‑ times a bit too rapidly– that the special commitment of the self‑employed to their work could lead to a heavier work time load and a greater permeability between the various areas of their social life, the reasons that would lead them to share similar condi‑ tions of health are less clear.
At a descriptive level, we find that the relatively high average age of non‑salaried workers (see
Table 1) (23) does not seem to affect their health as
(23) With the exception of farmers –and there are changes with the increase in life expectancy for the older generation and the rising costs of installation– the self‑employed rarely begin their professional career in this status. They enter the status of self‑ employed after previous experiences as wage‑earners or, in the case of the self‑employed professionals, after a long period of study (Evain, Amar, 2006).
Graph: Working Time and Working Schedule
Reading note: The graph on the left compares the average number of work hours per week in the principal declared employment (regular employment) by employment status. The graph on the right compares the type of hours declared in the week and from one week to the next by employment status.
Population: Employed active population surveyed in interrogation rank 1 of the Enquête emploi en continu (2010). Source: Enquête emploi en continu (Insee, 2010).
Table 2: Work Influence on Daily Life
Sala-ried salariedNon-
Non‑salaried (CSP) Individual farmers Self‑ employed crafts workers Merchants Heads of firms with 10 employees or more Self‑ employed professio‑ nals Inter‑ mediate profes‑ sions Unable to modify work hours by
arrangement with colleagues in case of
unexpected events 38.2% 57.4% 63.2% 59.4% 64.7% 24.8% 47% 47.7%
Does not know work hours for the next
day 5% 13.3% 19.4% 11.4 11.5% 12.3 10.4% 9.5%
Works more than 50 hours a week 3.4% 45.1% 56.2% 42.1% 45.6% 56.8% 33.5% 27.4%
Works six days out of seven 7.7% 57.1% 82.1% 46.1% 62% 46.9% 38% 33.3%
Generally works nights 7.4% 3.9% 2.4% 5.7% 4.6% 0% 4.6% 1.7%
Generally works Sundays 11.9% 31.6% 59.8% 14.6% 37.8% 9.4% 8.7% 32.3%
Very strong work influence on daily
life (at least three of the above criteria) 3.8% 38.9% 62.3% 28.5% 47.5% 17.5% 19.8% 14.3%
Reading note: 38.9 per cent of non-salaried workers have a very strong work influence on their daily life according to the criteria measured by the Conditions de travail survey (2005).
Source: Conditions de travail Survey (2005), in Algava, Vinck (2009).
Non-Salaried
Non-Salaried Salaried Salaried
50 45 40 35 30 25 20 15 10 5 0 55 [90,95[ [85,90[ [80,85[ [75,80[ [70,75[ [65,70[ [60,65[ [55,60[ [50,55[ [45,50[ [40,45[ [35,40[ [30,35[ [25,30[ [20,25[ [15,20[ [10,15[ [05,10[ [00,05[ [95,100[ 100 90 80 70 60 47,07 69,48 0,16 7,45 52,77 23,08 50 40 30 20 10
0 Identical from one
week to the next Variable from one week to the next
Weekly hours Types of hours
Alternating shifts: two or three 8-hour shifts
one might expect. The responses they give to the three questions from the Mini European Health
Module (MEHM) (24) (HSM 2008) put them in an
intermediate position between salaried management personnel (the most advantaged) and salaried non‑
managerial employees. (25) Relying on an analysis
“all things being equal” which helps separate out the structural effects, Table 3 indicates the nature of this health advantage. The analysis here includes the following control variables: age, gender, employment status (see Box), standard of living and supplemental health coverage, that is to say the fact of having or not having a complementary health insurance plan.
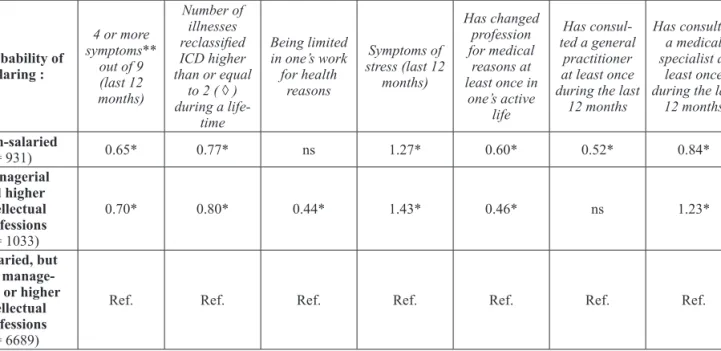
The self‑employed have a lower likelihood of reporting combined symptoms (column I) and illnesses (column II) than do non‑management employees. On these two points, managerial person‑ nel enjoy an advantage comparable to that of the self‑employed.
Their relative position is better concerning limitations experienced at work (column III), while the self‑employed are close to the position of non‑managerial employees. We should also note (column IV) the position of non‑salaried workers and of managerial personnel concerning stress, the only health criterion for which they are less favourably positioned than non‑managerial employees. This result confirms the value of the recently opened field of study on the stress of the
self‑employed (Inserm, 2011), but it should be
read with caution. The HSM survey question on “stress” does not indicate any directive outline to this concept which remains rather ill-defined. The results of column V also emphasize the lower propensity for the self‑employed to change occupation for health reasons, even though this characteristic is still less for managerial person‑ nel. However, this latter measure remains fairly general and we would need further clarification to better understand the extent of the changes that are available to individuals.
(24) The Mini European Health Module (MEHM) is composed of three questions which structure Table 1. These questions were fixed around the middle of the decade of the 2000s which was the result of a long process of coordina‑ tion between national and international (Eurostat) bodies in charge of following health‑related questions. They are already present in most general population surveys and have been regularly exploited by researchers. Most of the documentation work concerning these surveys has been particularly based on medical or epidemiological questions which have illuminated the “objectivizing” or even predic‑ tive impact of declarations on subjectively perceived health status (Desalvo et al., 2005; Erdogan‑Ciftci et al., 2010;
Miilunpalo et al., 1997).
(25) For a detailed comparative study of the responses to the Mini European Health Module see: Algava, Cavalin, Célérier
(2011) and particularly the table 3, page 10.
Finally, the last two columns of the table (VI and VII) which compare the use of two types of health care have a dual interest. They identify the most distinctive health characteristic (or rather health care behaviour) of non‑salaried workers and suggest that their relative advantage differs in kind from that of managerial personnel. With given characteristics, the latter do indeed have a lower likelihood of reporting illness, multiple symptoms or limitations than do other employees, while at the same time utilising more health care, including consultations of medical specialists. In other words, as the work on health inequalities has consistently demonstrated, their health advantage is obtained, or accompanied by, stronger preventive and curative practices.
Box
Details of the Subgroups of Salaried and Non-Salaried Workers as Defined to
Make Logistic Regressions
In these logistic regressions, the employment status is based in the first place, as indicated above, on the “STATUT” variable which, in the Insee surveys, includes among “non-salaried” workers, those who are “self-employed” (STATUT= 5), “unpaid family workers” (STATUT= 6), “salaried entrepreneurs, general managers, minority mana-gers or partners” (STATUT= 7). On the basis of this variable, the tables 3 and 4 distinguish wage-earners and non-wage wage-earners and, inside of these groups, identify “managerial personnel and higher intellectual professions” by the socioprofessional group “3”, the other wage-earners being attached to all the other groups in the PCS nomenclature. Table 5 goes further, distinguishing salaried and non-salaried workers with the employment status and PCS as follows:
Non-salaried:
– Farmers, merchants and crafts workers: STATUT= 5, 6, 7 and CS= 10, 21, 22 (n= 667)
– Self-employed professionals, managerial, profes-sional and technical workers and higher intellec-tual professions, heads of firms with 10 or more employees: STATUT= 5, 6, 7 and CS= 23, 31, 32, 36 (n= 146);
– “Other non-salaried”: STATUT= 5, 6, 7 and CS= 41, 46, 47, 48, 54, 55, 56, 61, 66, 69, (n= 103).
Salaried:
– Salaried managerial personnel and higher intel-lectual professionals: STATUT= 1, 2, 3, 4 and CS= 31, 32, 36 (n= 1033);
– Salaried intermediate professions: STATUT: 1, 2, 3, 4 and CS= 41, 46, 47, 48 (n= 1789);
– Salaried employees and workers: STATUT= 1, 2, 3, 4 and CS= 51, 54, 55, 56, 61, 66, 69 (n= 4784).
Table 3: Probability of Declaring a Number of Health Characteristics and of Utilizing Health Care According to Employment Status I II III IV V VI VII Probability of declaring : 4 or more symptoms** out of 9 (last 12 months) Number of illnesses reclassified ICD higher than or equal to 2 ( ◊ ) during a life-time Being limited in one’s work for health reasons Symptoms of stress (last 12 months) Has changed profession for medical reasons at least once in one’s active life Has consul-ted a general practitioner at least once during the last
12 months
Has consulted a medical specialist at
least once during the last
12 months Non-salaried (n = 931) 0.65* 0.77* ns 1.27* 0.60* 0.52* 0.84* Managerial and higher intellectual professions (n = 1033) 0.70* 0.80* 0.44* 1.43* 0.46* ns 1.23* Salaried, but not manage-rial or higher intellectual professions (n = 6689)
Ref. Ref. Ref. Ref. Ref. Ref. Ref.
* Odds ratio significant at the 5 percent threshold.
** 4 symptoms including: sleep disorders, fatigue, eating disorders, chronic heartburn, reflux, heart palpitations, tachycardia, fainting, vertigo, dizzy spells, blackouts, shortness of breath, colitis, intestinal pains, stress.
(◊) The median and average numbers of chronic illness after reclassification ICD (International Classification of Diseases) among those 18 to 65 years old are 1 and 1.67 (among active employed 18 to 65 years old it is 1 and 1.46 respectively); 41 per cent of those 18 to 65 years old (and 38 per cent of active employed 18 to 65 years old) have two or more diseases classified ICD during their lifetime. Analysis at a given age avoids reading the growth in the number of illnesses as the fruit of advancing age (the mechanical effect of time passing plus the growing probability of illness with advancing age).
Reading note: Non-salaried workers have a 35 per cent lower probability than salaried non-managerial, technical and profession workers at a given age, gender, employment status, standard of living and complementary medical insurance, of having four or more symptoms (in a list of 9) for the 12 months preceding the survey.
Population: Active employed, 18-65 years. Source: HSM 2008.
For self‑employed workers, the relative health advantage clearly does not flow from such prac‑
tices. Either their needs (26) to utilise health care
are less than those of other groups or they delay more in utilising health care with the risk, in this case, of developing poor health in the long term. The reasons they give for not utilising health care at least once during the previous twelve months are significantly associated with the part that work takes up in their daily life. While managerial personnel and other employees mainly evoke the cost of health care (54% and 52% respectively), the self‑employed refer to costs (37%) as frequently as to a lack of time (38%). (27)
The less favourable character of social security for self‑employed health care can also affect their
(26) At least those they identify as such. (27) HSM 2008 (Drees‑Insee).
lower medical consumption. (28) In fact, our analyses
conducted “all things being equal” demonstrate that, by incorporating the presence or absence of comple‑ mentary health care insurance in the controlled variables, the self‑employed status is less frequently
associated with a complementary insurance. (29) The
“employment status” effect is therefore probably linked to a “social insurance status” effect, thus confirming that insurance status plays a crucial role in relation to the health care of individuals. This result confirms our interest in the subject and calls for continuing the investigation through appropriate surveys. (30)
(28) The general regime is still the most protective one (Tabuteau, 2010). The amount as well as the duration of
compensation is greater. Compensation for accidents and occu‑ pational diseases does not exist for those affiliated to the RSI (Régime social des indépendants which is the self‑employed insurance plan) who either do not enjoy the possibility of modulating their work time to help their return to work follow‑ ing an illness (e. g., therapeutic part‑time work). For the details of the differences between the regimes, see Algava, Cavalin,
Célérier (2011).
(29) In spite of the 1994 Madelin Law which provided for tax deductions for the charges (Perronnin et al., 2011).
(30) For example, see particularly the biennial survey Santé et
Table 4: Probability of Declaring a Number of Health Characteristics and of Utilizing Health Care According to Employment Status
Mini European Health Module (MEHM)
I II III IV V Probability of declaring : Health seen as very good, fairly good or good Currently has at least one chronic disease Incapacitated (strongly or not) for health
reasons Declares 4 or more symp-toms** out of 9 (last 12 months) Has a number of diseases classified ICD higher than or equal to 2 ( ◊ ) (life time) Farmers, merchants (and related),
crafts workers (n = 667) [1.05 ; 2.76]1.69* [0.79 ; 1.13]0.95 [0.54 ; 0.88]0.69* [0.55 ; 0.90]0.70* [0.69 ; 0.98]0.82*
Self-employed professionals, mana-gerial, professional and technical workers and higher intellectual profes-sions, heads of firms with 10 or more employees (n = 146)
2.37
[0.67 ; 8.33] [0.71 ; 1.43]1.01 [0.61 ; 1.52]0.96 [0.42 ; 1.15]0.69 [0.61 ; 1.21]0.86
Other non-salaried (n = 103) [0.45 ; 4.44]1.42 [0.36 ; 0.88]0.57* [0.30 ; 1.02]0.55 [0.17 ; 0.67]0.34* [0.24 ; 0.59]0.37* Managerial and higher intellectual
professions (n = 1033) [1.13 ; 3.14]1.88* [0.81 ; 1.09]0.94 [0.49 ; 0.77]0.61* [0.58 ; 0.87]0.71* [0.68 ; 0.91]0.78*
Intermediary professions (n = 1789) [1.13 ; 2.39]1.65* [0.97 ; 1.23 ;]1.09 [0.71 ; 0.98]0.83* [0.86 ; 1.15]1.00 [0.85 ; 1.07]0.96
Workers and employees (n = 4784) Ref. Ref. Ref. Ref. Ref.
VI VII VIII IX X
Probability of declaring : work for health Limited at reasons Symptoms of stress (last 12 months) Has changed profession at least once during active life for medical
reasons
Has consulted a general prac-titioner at least once in the last
12 months
Has consulted a medical
specia-list at least once in the last
12 months Farmers, merchants (and related),
crafts workers (n = 667) [0.62 ; 1.11]0.83 [1.19 ; 1.66]1.41* [0.22 ; 0.67]0.38* [0.48 ; 0.72]0.58* [0.74 ; 1.05]0.88
Self-employed professionals, mana-gerial and higher intellectual profes-sions, heads of firms with 10 or more employees (n = 146)
0.47
[0.22 ; 1.02] [1.45 ; 2.83]2.03* [0.80 ; 3.15]1.59 [0.30 ; 0.63]0.44* [0.89 ; 1.79]1.26
Other non-salaried (n = 103) [0,08 ; 0,78]0,24* [0.75 ; 2.61]1,10 [0.18 ; 2.05]0.60 [0.36 ; 0.94]0.59* [0.67 ; 1.54]1.02 Managerial and higher intellectual
professions (n = 1033) [0.27 ; 0.54]0.38* [1.49 ; 1.98]1.72* [0.26 ; 0.71]0.43* [0.76 ; 1.12]0.92 [1.22 ; 1.66]1.42*
Intermediary professions (n = 1789) [0.59 ; 0.91]0.73* [1.31 ; 1.65]1.47* [0.58 ; 2.09]0.80 [1.00 ; 1.40]1.19 [1.21 ; 1.55]1.37*
Workers and employees (n = 4784) Ref. Ref. Ref. Ref. Ref.
* Odds ratio significant at the 5 percent threshold.
** 4 symptoms including: sleep disorders, fatigue, eating disorders, chronic heartburn, reflux, heart palpitations, tachycardia, fainting, vertigo, dizzy spells, blackouts, shortness of breath, colitis, intestinal pains, stress.
(◊) The median and average numbers of chronic illness after reclassification ICD (International Classification of Diseases) among those 18 to 65 years old are 1 and 1.67 (among active employed 18 to 65 years old it is 1 and 1.46 respectively); 41 per cent of those 18 to 65 years old (and 38 per cent of active employed 18 to 65 years old) have two or more diseases classified ICD during their lifetime. Analysis at a given age avoids reading the growth in the number of illnesses as the fruit of advancing age (the mechanical effect of time passing plus the growing probability of illness with advancing age).
Reading note: A farmer, merchant or crafts worker with a given age, gender, employment status, standard of living and complementary medical insurance multiplies by 1.69 his chance of declaring that he is in very good, fairly good or good health (question 1 of the mini-module) as compared to a worker or employee.
Population: Active employed, 18-65 years old. Source: HSM 2008.
To validate the idea of a relative health advan‑ tage for non‑salaried workers, we still have to rule out a statistical artefact that might mix together very different, even polarized, health situations among the components of the group. On the one hand are the self‑employed professionals whose income and diplomas are close to those of manage‑ rial workers and on the other are the self‑employed
crafts workers, merchants, and individual farmers whose health may be as unfavourable as that of workers, for example, with whom they share many of the same working conditions. In other words, one might think that the relatively good health of non‑ salaried workers would result in large part from the social inequalities in health which are internal to the group, the most favoured within it (by diplomas
or standard of living) pulling up the average health performance of the whole group.
Consequently, we have tested the internal diversity of non‑salaried workers, distinguishing three groups within them: individual farmers‑self‑ employed‑crafts workers‑merchants; self‑employed professionals and related, heads of businesses with ten or more employees; and “other” non‑salaried
workers. (31) We have compared these groups to all
salaried employees within which we have also distin‑ guished three groups: salaried managerial personnel and higher intellectual professionals; intermediate professionals; and employees and workers. Table 4 gives the probabilities for declarations concern‑ ing ten health indicators by taking the subgroup of workers and employees as the reference independ‑ ent variable of employment status. Overall, we can see that the self‑employed report relatively good health for all indicators in columns I to VIII of the table. The self‑employed professionals and related do not stand out in this case and, except for reports
of stress (column VII (32)), are not on the same level
as that of salaried management personnel. For these indicators, individual farmers, self‑employed crafts workers and merchants have relatively more favour‑ able positions than expected, in many respects close to that of the salaried intermediate professions.
Considering the overall active population of eighteen to sixty-five years old, we find the results anticipated by research on health inequali‑ ties. Managerial personnel and higher intellectual professionals stand out with a significant advantage. For the vast majority of our first eight indicators, they have indeed a better chance of reporting better health than the other groups of actively employed, other characteristics being equal. This result which is readable in terms of PCS is very clear and, once again, we see the known gradient of health inequalities.
However, this gradient is not exactly observ‑ able when we take into account employment status. While taking the “workers and employees” employ‑ ment status as a reference, no matter what the given characteristics, salaried managerial personnel and
(31) These “other” non‑salaried illustrate the diversity of the self‑employed status. While they have the status of “self‑ employed” in the sense of the Insee variable which we have utilised, they have declared themselves to be in the sociopro‑ fessional category of group 4 (intermediary professions), group 5 (employees) or group 6 (workers). This “other” non‑salaried group include 103 people in the 2008 HSM survey with a great diversity of professional activities, as demonstrated by the socioprofessional categories listed in the box. Note, for example, the intermediate professions: in health care (nurses, physiotherapists); advertising and communications; hostesses and security workers; translators; and specialised occupations in stock raising and forestry.
(32) Table 3 has already indicated this in reference to the declared symptoms of stress, that is, the nearly universal increased probability of these symptoms outside of the group of workers and employees.
non‑salaried self‑employed professionals do not have, as we have noted, the same social health advantage. To check this point, we have made addi‑ tional logistical regressions incorporating the same health indicators as dependent variables, the same independent variables and the same subgroups as in Table 4, but this time operating separately on the sub-field of non-salaried workers on the one hand and salaried employees on the other. We have compared the health inequalities between manage‑ rial personnel and workers‑employees (within the sub-field of wage-earners) to those that distinguish the self‑employed professionals from the individual farmers, self‑employed crafts workers and merchants (within the sub-field of the self-employed).
The results confirm the previous ones, namely the remarkable advantages for managerial person‑
nel (33) but no significant differences among
non‑salaried workers, for nine of the ten indicators considered. Only the probability of having changed profession for medical reasons at least once in his life clearly distinguishes the self‑employed profes‑
sional (34) but this result, based on a population
which is too small, does not have sufficient statisti‑ cal robustness to be relied on without reservation. In any case, we clearly see that the PCS variable is no longer universally operative when employment status is taken into account. This is a robust result of our analysis.
W
hen Illness Strikes
The last mechanism which may play a role in the relatively better health of the self‑employed concerns the selection process which operates when one enters or leaves the employment status. Those who are in poor health or who might feel less confident on this point might avoid joining an employment status that would expose them to greater risks and they would leave it with the first doubts. So in this status we would find “health-selected” workers which would explain their generally more favour‑ able position despite a relatively high average age. Our investigations on this point are severely limited by the lack of longitudinal data. To approach this question, however, we have used the retrospec‑ tive data from the SIP (2006) survey which asked the respondents to restore their career paths from memory and to identify health problems they say they have encountered during their lifetime. With due caution imposed through the use of such
(33) Odds ratios for managerial personnel and higher intellec‑ tual professions (reference: workers and employees), respecting the order of columns I to X of Table 4: 1.79; ns; 0.62; 0.73; 0.80; 0.39; 1.78; 0.42; ns; 1.43.
(34) Odds ratio: 4.96 (within the sub-field of non-salaried workers, the referenced status was individual farmers, self‑ employed crafts workers and merchants).
material, we have sought the comparative effects of illness in relation to employment status.
Indeed, while the self‑employed enjoy rela‑ tively good health despite their age, they have not, however, been spared illness, which affects them as it does other groups. To give an example –also related to their average age– they are affected by 9 of the 60 cancer cases identified in the HSM survey in 2008, while managerial personnel whose numbers are equivalent are only affected by 4 of them. This second part of our article therefore explores what happens when –whether salaried or self‑employed– illness, disability or limitations of various kinds disturb the course of working life. We have monitored the effects of these problems on the course of a professional career by selecting three a priori possible effects for which the survey data provided the most appropriate information. We treat the first one in the register of the reorientation of career, which the literature discusses in terms of the increasingly precarious nature of employment situations in case of illness. The next two effects, the temporary interruption of professional activity and the modulation of the temporal organization of work, are grouped and analysed as arrangements of professional activities.
The Effects on Professional Career
The impact of a particular illness on the progres‑ sion of a professional career is a question posed by all disease specialists in their monitoring of the evolution of those who have fallen ill. The obser‑ vation is worthwhile, even if this concern remains marginal in relation to following the effects of treat‑ ment, especially if the illness has high lethal risks.
The cancers give an archetypal example (Célérier,
2008). The Anglo‑Saxon current particularly ques‑ tions the effects of chronic diseases in terms of the return to work, wholly or partially accomplished
and more or less “delayed” (Spelten et al., 2002). In
France, the reflection has been broader and marked by the observation made since the 1980s of large health differences between the employed and the unemployed, with the latter always having a health
condition less favourable than the former (Khlat,
Sermet, 2004).
Comparative causality research underlying this observation has installed a tradition of analysing the impact of illness as to unemployment or inac‑ tivity most often detailing the situations for women
and men (Mesrine, 2000; Saurel‑Cubizolles,
2001; Malenfant et al., 2004; jusot et al., 2006).
These studies generally conclude with the cost for the patients, although estimates vary widely from one study to another, and they can also be read in an encouraging light. A recent study on the impact of cancer shows that many people survive it today
and a large majority of them live in conditions close to those of the general population two years
after diagnosis (Eichenbaum‑Volin et al., 2008,
pp. 126‑127). (35)
Following the line of research opened by the work in France, we have investigated three types of reorientations of professional careers: unem‑
ployment, inactivity and unstable employment, (36)
to which we have added a change of employment status from non‑salaried workers to wage‑earners and vice versa. We have started from illnesses as reported by SIP respondents, distinguishing those who reported according to whether they had held a salaried or non‑salaried position in the year (n‑ 1) for an illness that started in the year (n). We have recorded their respective positions at the end of this year (n), at one year (n+ 1), and at two years (n+ 2) after the onset of the illness. Table 5 presents the results, distinguishing the evolution of the self‑ employed on the left from that of salaried employees on the right. The table also distinguishes whether or not they have reached fifty years of age, since the passage to inactivity when an illness strikes is more common at a later age.
In total, some 7,500 illnesses were reported (37)
in SIP which in its large majority involved salaried employees and, more specifically, employees under fifty years old who were by far the most repre‑ sented in the survey. The data in Table 5 reveal two significant results. On the one hand, illness does not involve movement towards self‑employment on the part of salaried employees, regardless of
their age. (38) If there is any movement, it is from
the non‑salaried to the salaried employees, at least for the youngest of those who were non‑salaried. If short‑term and long‑term salaried jobs are added together, some 8% of the youngest non‑salaried changed employment status two years after the health incident. This observation is rather in the sense of a healthy worker effect. However, it cannot completely decide the question.
(35) There nevertheless remains the disadvantage for manual workers who are always severely penalized by illness even when there is a favourable prognosis.
(36) The SIP survey defines long term employment as having held the same job for more than five years and short term employment as less than five years with occasional periods of unemployment or inactivity of less than one year. Unemployment itself was defined as lasting more than one year and inactivity as having left all employment for one year minimum.
(37) We have not taken into account the future of those persons who are in short term employment at n‑ 1 (1,642 cases of illness declared). The figures at points n, n+ 1 and n+ 2 on the “Short Term Employment” line of Table 5 only list the entry of wage earners and non‑wage earners into this type of employment. (38) Qualitative surveys sometimes present the passage to self‑ employment as a solution applied by persons who are ill. For those who declare having a cancer, see Chassaing et al. (2011).
Table 5: Professional Situation the Year of an Illness and One and Two Years Later as a Function of Age and Employment Status One Year Before the Illness
First, it only affects one side of the issue by ignor‑ ing, by definition, healthy employees who may have become self‑employed. Since this observation took place two years after the illness, it may result from
other causes, including short‑term ones, (39) and
the effect may therefore have been attenuated. The second result in Table 5 stems from the comparison of the upper and lower parts of the table –both older and younger than fifty years old– hence the structural character of age, which is greater than that of employ‑ ment status. The evolution of salaried and non‑salaried workers over fifty years old are similar and logically oriented towards inactivity which is probably, in this case, a form of retirement. We find the same similarity for the youngest group, although salaried employees who have been ill are found to be more frequently unemployed than their non‑salaried counterparts.
(39) Without, of course, taking into account the problems of memory.
On the question of career reorientation, we can also judge the risk of unemployment following an illness by controlling several variables: the age at the onset of an illness; the gender; the type of disease; and the employment status in the year preceding the disease. Detailed in Table 6, this risk is not signifi‑ cantly different for the self‑employed from what it is for salaried employees in long‑term employment, the year of the occurrence of the disease, as well as for the following year. It only becomes significant two years later, when the probability of the self‑ employed leaving employment is reduced by one third as compared to that of a salaried employee on long‑term employment with all other characteristics being equal. The clearest effect as demonstrated in Table 6, however, concerns employment instabil‑ ity which severely aggravates the risk of job loss, rather than the employment status itself. Falling ill while working in unstable employment multiplies the chance of leaving employment by almost four times.
Table 6: Leaving Employment in the Years Following the Onset of a Medical Problem
Situation one year prior to the onset of a medical problem
Per cent of those no longer employed
Year of the start of
a medical problem Following year Two years later In % OR* In % OR* In % OR* Non‑salaried long‑term employment 16.2 ns** 24.8 ns** 29.0 0.65 Salaried long‑term employment 13.1 1 21.4 1 28.8 1 Salaried short‑term employment 30.3 4.2 40.9 4.1 46.0 3.7
* OR: Odds ratios (significant at the 5 percent threshold) from logistical regressions determining the probability of leaving active employment as a function of the age at the onset of an illness, of gender, type of illness and employment status the year preceding the onset of the illness.
** ns: OR not significant at the 5 percent threshold.
Reading note: For a non-salaried person in long-term employment at n- 1, the probability of not being in active employment at n+ 2 for an illness which started at the year n is 35 per cent less than it is for a salaried worker in long-term employment.
Population: All health problems having affected persons in long-term employment, whether salaried or non-salaried, and in short-term employment the preceding year (n= 9123).
Source: SIP 2006 (Drees-Dares).
Modulating Professional Activity
In this second form of the impact of an illness, we no longer observe a rupture or reorientation in career, but a modulation whose framework is very much determined by the insurance systems (whether or not there are interruptions of activity in relation to temporary work leave) and by the nature of the activ‑ ity (adaptations of the temporal dimensions whose shared characteristics were discussed in the first part). Non-salaried at n- 1, less than 50 years (n = 554) n n+ 1 n+ 2 % % % Unem‑ ployed 1 1 0 Inactive 8 13 15 Non‑sala‑ ried 90 82 77 Salaried 0 1 4 Short‑term employ‑ ment 1 2 4 Salaried at n- 1, less than 50 years (n = 4 676) n n+ 1 n+ 2 % % % Unem‑ ployed 1 2 2 Inactive 8 13 18 Non‑sala‑ ried 0 0 0 Salaried 89 83 77 Short‑term employ‑ ment 1 2 3 Non-salaried at n- 1, 50 years or older (n = 434) n n+ 1 n+ 2 % % % Unem‑ ployed 1 1 0 Inactive 24 36 46 Non‑sala‑ ried 73 61 52 Salaried 0 0 0 Short‑term employ‑ ment 1 1 1 Salaried at n- 1, 50 years or older (n = 1817) n n+ 1 n+ 2 % % % Unem‑ ployed 1 2 4 Inactive 22 36 48 Non‑sala‑ ried 0 0 0 Salaried 76 61 48 Short‑term employ‑ ment 0 1 0
Reading note: For all illnesses declared by non-salaried persons in long-term employment aged 50 or more in the year n- 1, some 46 per cent of those persons were inactive in n+ 2.
Population: All diseases affecting persons in long-term employ-ment, salaried or non-salaried in the previous year (n = 7481). Source: SIP 2006 (Drees-Dares).
Interruption of Activity
The comparison of salaried employees and non‑ salaried workers reveals radically different behaviour patterns concerning temporary work leave which echoes what was earlier observed in the utilisation of health care. The probability for non‑salaried workers
stopping work when illness strikes (40) is two‑thirds
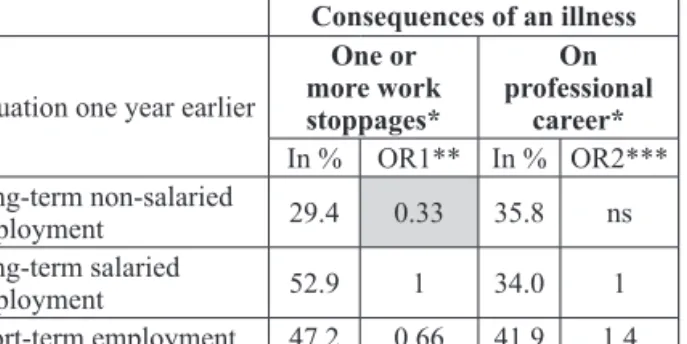
less than for that of employees in long‑term employ‑ ment, whether the work leave is singular or repetitive (see Table 7). Non‑salaried workers seem to main‑ tain their work activity much more than do salaried employees, but their respective rights in this area are so different that the comparability of their behaviour cannot be guaranteed.
Table 7: Consequences of an Illness in Terms of Work Stoppages and Changes in Professional Career
Consequences of an illness
Situation one year earlier
One or more work stoppages* On professional career* In % OR1** In % OR2*** Long‑term non‑salaried employment 29.4 0.33 35.8 ns Long‑term salaried employment 52.9 1 34.0 1 Short‑term employment 47.2 0.66 41.9 1.4
* Using two questions from the SIP survey a propos three or more illnesses left to the choice of the person interviewed among those which “seemed the most linked to his/her professional life whether as a cause or a consequence.”
** OR1: Odds ratio from a logistical regression on the probability of having one or more work stoppages linked to an illness as a function of the age at the onset of the illness, gender, the type of illness and the employment status.
*** OR2: Same thing but a propos the probability of declaring that an illness had consequences on one’s professional career.
Reading note: For a non-salaried person in long-term employment the year preceding the illness, the probability of taking one or more sick leaves linked to the illness is two thirds less than that for a sala-ried person in long-term employment.
Population: All illnesses affecting persons in long-term employment, whether salaried or non-salaried, or in short-term employment the year preceding the illness.
Source: SIP 2006 (Drees-Dares).
Just as in the case of the utilisation of health care, sick leave is highly dependent on legal provisions. This temporary interruption for salaried employ‑
ees has been regulated by law for a long time (41)
suspending their work contract and complement‑ ing their temporary loss of income with per diem indemnities funded by active employees and by the employers. The situation of non‑salaried workers is quite different and is less advantageous, as we have pointed out, despite the restrictions recently
(40) This only involves those illnesses that the respondents judged as having marked their lives the most, according to the
SIP survey interrogation method, that is some 83 per cent of all
the cases of illness recorded in the survey.
(41) Sylvie bourgeot and Michel Blatman (2009, p. 288)
trace the origins of this rule to a 1934 jurisprudence (Chambre civile, 3 December, Hôtel Terminus, PLM c/dame Spagnoli).
imposed on the general system. (42) Only self‑
employed crafts workers and merchants are subject to a social tax and entitled to protection against the risk of interruption of work activity, receiving daily indemnities although they are less favourable in both duration and value than those accorded to salaried employees. The self‑employed profes‑ sionals are individually insured, but without any obligation to do so, and under varying conditions of the proposed coverage and contribution levels.
The situation is similar for farmers, (43) except for
illnesses or accidents of recognized occupational origin and for which they receive daily indemnities.
Moreover, the risks associated with a tempo‑ rary suspension of activity of salaried employees and non‑salaried workers have little to do with each other. Employees are mainly threatened with dismissal and, while the risk is not zero, the law
of 12 July 1990 (44) stating that illness cannot in
and of itself be a cause for termination of employ‑ ment ensures their greater security in this respect. The risks for the self‑employed are quite different. The loss of income is not compensated, we have seen, and the inability to maintaining their activity is certainly a threat through the weakening of the network of relationships formed, in particular with clients. It is likely that interrupting work activity is only a solution of last resort for the self‑employed.
The possibility of temporarily suspending profes‑ sional activity is sensitive to employment status insofar as the rights associated with an interruption make it more or less effective and more or less dangerous to the future evolution of a career. Sick leave by salaried employees and non‑salaried workers are very differ‑ ent and difficult to compare. To those who establish a firm or even a virtuous link between job retention and a weaker, and thus economically incentive, social protection, one might object by pointing out the cost which maintaining work activity engenders for the individual and the community in terms of delays in health care and ultimately the possibility of worsen‑ ing health. Here again we find the question which was raised earlier of the self-employed significantly under-utilizing consultations of medical specialists and especially of general practitioners over a twelve‑month period. For the time being, the SIP survey does not inform us of these aspects which, however, should remain present in interpreting the results.
(42) The decree of 26 December 2011, for example, has installed a method of calculating per diem indemnities which is less favourable to those who are insured by the general insur‑ ance plan (JORF n° 0299, 27 December 2011, p. 22,309). This had been preceded by two previous decrees of 29 October 2010 which had already lowered the calculation of cash indemnities. And look at article 105 of the financial law of 2012 (n° 2011-1977 of 28 December 2011) which installed an unpaid sick leave day in the civil service.
(43) Negotiations are underway to set up per diem indemnities for illnesses other than those recognized as being work‑related. (44) Which has become article L. 1132‑1 of the Labour Code.
Modulating Working Time
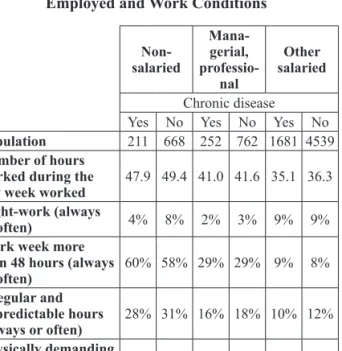
The second adaptation considered here concerns working time whose specificities for the self-employed we have seen and which we have translated in terms of “influence over daily life.” We wanted to know how these specific characteris‑ tics are reflected in the context of an illness so as to know if they were additional constraints due to the number of hours worked and the influence of work over daily life, or if they were resources for the self‑employed. Illness and the consequent medical treatment are indeed likely to generate tensions in the temporal organization of self‑employed activities and we therefore wanted to identify the necessary adjustments. In undertaking this analysis, we distinguished 211 people who reported at least one chronic illness among the 879 non‑salaried workers interviewed in SIP and we did the same for salaried managerial personnel and for other employees. Table 8 presents the results of some key dimensions of working time for each group consid‑ ered by separating the statements of people who reported having a chronic disease (column Chronic Disease) from the others. The limited numbers call for considerable caution in the interpretation. Despite these reservations, we present the results for some of the interesting reported differences, taking them as so many lines to be adopted in future studies so as to either confirm or reformulate them. So Table 8 is here used to formulate very tentative hypotheses.
Table 8: Chronic Diseases Among the Actively Employed and Work Conditions
Non- salaried Mana-gerial, professio-nal Other salaried Chronic disease Yes No Yes No Yes No
Population 211 668 252 762 1681 4539
Number of hours worked during the
last week worked 47.9 49.4 41.0 41.6 35.1 36.3
Night-work (always
or often) 4% 8% 2% 3% 9% 9%
Work week more than 48 hours (always
or often) 60% 58% 29% 29% 9% 8% Irregular and unpredictable hours (always or often) 28% 31% 16% 18% 10% 12% Physically demanding work 52% 49% 17% 14% 40% 32%
Work under pressure 29% 30% 53% 43% 29% 23%
Reading note: Non-salaried workers declaring at least one chronic illness work 47.9 hours per week on the average. Those who declared no illness worked 49.4 hours. Some 52 per cent of the former feel that their work is physically demanding as compared to 49 per cent of the latter.
Population: Active employed 15 years and over. Source: SIP 2006 (Drees-Dares).
The data in Table 8 already clearly confirm the impact of illness regardless of the employ‑ ment status considered. Those who are ill always consider their work as “physically demanding” (line 5), more so than for those who are healthy and have the same employment status. This result is gener‑ ally understood as the result of two mechanisms: health problems make them more susceptible to the difficulties of work and these in turn contrib‑
ute to health deterioration. (45) Note, however, that
the self‑employed more often report encountering such physical demands than do other categories of employed persons (whether or not they have declared a chronic illness).
Whether sick or not, non‑salaried workers always reported the highest weekly working hours (lines 1 and 3). They also practice irregular hours less often when they are ill rather than healthy, but this is also the case for salaried managerial personnel and other employees. However, the gap concerning night work (line 2) between those who are ill and those who are healthy among the self‑employed seems to be more sensitive than it is for other employment statuses. There are only half as many self‑employed who are ill but who always or often work at night, than is the case for those who are not ill. When these results are controlled by the variables of age, gender and industry, they are, however, no longer signifi‑ cant. Employment status “does not explain” the differences in night work for those self‑employed that are ill compared to those who are not.
Nevertheless, it seems useful to keep these results within the framework of the exploratory approach which we have presented here and to which we have referred above, the objective of which is to form tentative hypotheses to guide future research. Even from this limited point of view, the data in Table 8 suggest that maintaining a high number of hours worked by non‑salaried workers when they are ill may be accompanied by an adjustment in the degree to which they are exposed to atypical hours (in proportions equivalent to those of salaried employees) and to night work. We may have here an obvious effect of the autonomy of work organization that the self‑employed typically present as a feature of their activity and is sometimes considered the major difference with respect to salaried employees. However, in an analysis with all the rest being equal, the employment status variable is not significantly correlated to adjustments of working time in case of illness. In other words, the consequences of illness
(45) This leads to better understanding of the choice of French statistical surveys on work conditions which develop individual’s subjective appreciation about “objectivable” work conditions. Swedish studies, for example, have taken a completely different road by describing work conditions uniquely from objective measures: weight lifted, temperature, decibels, etc. See Gollac, Volkoff (2010). And concerning the
endogenous character of the declarations on work conditions, see Coutrot, Wolff (2005).