HAL Id: hal-03189435
https://hal.archives-ouvertes.fr/hal-03189435
Submitted on 4 Apr 2021HAL is a multi-disciplinary open access archive for the deposit and dissemination of sci-entific research documents, whether they are pub-lished or not. The documents may come from teaching and research institutions in France or abroad, or from public or private research centers.
L’archive ouverte pluridisciplinaire HAL, est destinée au dépôt et à la diffusion de documents scientifiques de niveau recherche, publiés ou non, émanant des établissements d’enseignement et de recherche français ou étrangers, des laboratoires publics ou privés.
Distributed under a Creative Commons Attribution - NoDerivatives| 4.0 International
Growth strategy, phylogeny and stoichiometry determine
the allelopathic potential of native and non-native plants
Bart Grutters, Benedetta Saccomanno, Elisabeth Maria Gross, Dedmer van
de Waal, Ellen van Donk, Elisabeth Bakker
To cite this version:
Bart Grutters, Benedetta Saccomanno, Elisabeth Maria Gross, Dedmer van de Waal, Ellen van Donk, et al.. Growth strategy, phylogeny and stoichiometry determine the allelopathic potential of native and non-native plants. Oikos, Nordic Ecological Society, 2017, 126 (12), pp.1770-1779. �10.1111/oik.03956�. �hal-03189435�
Growth strategy, phylogeny and stoichiometry determine the
allelopathic potential of native and non-native plants
Bart M. C. Grutters, Benedetta Saccomanno, Elisabeth M. Gross, Dedmer B. Van de Waal, Ellen van Donk and Elisabeth S. Bakker
B. M. C. Grutters (orcid.org/0000-0002-4807-6480) (b.grutters@nioo.knaw.nl), B. Saccomanno, D. B. Van de Waal, E. van Donk and E. S. Bakker, Dept of Aquatic Ecology, Netherlands Inst. of Ecology (NIOO-KNAW), Droevendaalsesteeg 10, NL-6708 PB Wageningen, the Netherlands. EvD also at: Dept of Ecology and Biodiversity, Utrecht Univ., Utrecht, the Netherlands. – E. M. Gross, Laboratoire Interdisciplinaire des Environnements Continentaux (LIEC), Univ. de Lorraine, Metz, France.
Secondary compounds can contribute to the success of non-native plant species if they reduce damage by native herbivores or inhibit the growth of native plant competitors. However, there is opposing evidence on whether the secondary com-pounds of non-native plant species are stronger than those of natives. This may be explained by other factors, besides plant origin, that affect the potential of plant secondary compounds. We tested how plant origin, phylogeny, growth strategy and stoichiometry affected the allelopathic potential of 34 aquatic plants. The allelopathic potential was quantified using bioassays with the cyanobacterium Dolichospermum flos-aquae. The allelopathic potential showed a strong phylogenetic signal, but was similar for native and non-native species. Growth strategy was important, and emergent plants had twice the allelopathic potential as compared to submerged plants. Furthermore, the allelopathic potential was positively cor-related to the foliar carbon-to-phosphorus (C:P) and total phenolic content. We conclude that eudicot plant species with an emergent growth strategy and high plant C:P ratio exhibit a high allelopathic potential. Unless non-native plant species match this profile, they generally have a similar allelopathic potential as natives.
Plants contain secondary compounds that improve plant fitness in various ways, for instance by reducing the growth of competitors through allelopathy (Mulderij et al. 2007, Hilt and Gross 2008, Aschehoug et al. 2014), by repelling herbivores (Callaway and Ridenour 2004, Dorenbosch and Bakker 2011, Fornoff and Gross 2014), resisting patho-gens (Harborne 1977, Lattanzio et al. 2006) and interfer-ing with decomposition (Horner et al. 1988, Bardon et al. 2014, Suseela et al. 2015, McLeod et al. 2016). Secondary compounds contribute to the success of exotic plant species, because many exotic plants possess secondary compounds that are novel to the native community (reviewed by Callaway and Ridenour 2004, Cappuccino and Carpenter 2005, Macel et al. 2014). These novel compounds are known to be bioactive (Cappuccino and Arnason 2006), and may deter native herbivores (Macel et al. 2014) or inhibit the growth of native plants (Ridenour and Callaway 2001, Svensson et al. 2013), thus improving the fitness of non-native plants, which can provide a competitive advantage over native plant
species (Callaway and Ridenour 2004, Kim and Lee 2011). However, native and non-native plants were also shown to equally deter a generalist caterpillar (Lind and Parker 2010, Grutters et al. 2016), had a similar allelopathic potential (Meiners 2014) and produced litter that was equally toxic to amphibians (Cohen et al. 2012). Thus, the activity of secondary metabolites is sometimes related to plant origin, but not always. These contrasting results may be due to natu-ral inter- and intraspecific variation in secondary compound composition and levels, which are determined by multiple factors, including, but not limited to, plant phylogeny, plant growth strategy and elemental composition.
The secondary metabolite composition of plants is phylogenetically determined (Choi et al. 2002, Wink 2003, Gross and Bakker 2012). For example, in freshwater plants,
Myriophyllum species contain much more phenolic
com-pounds, specifically the deterrent tellimagrandin II, than
Potamogeton species (Choi et al. 2002). The growth
strat-egy of plants also affects levels of secondary compounds that are higher in forbs than in graminoids (Scharfy et al. 2011), herbaceous species are more allelopathic than woody species (Meiners 2014) and in wetlands, emergent species contain more phenolics than submerged plant species (Smolders et al. 2000). Besides phylogeny and growth strategy, the composition of plant secondary compounds may also be
© 2017 The Authors. This is an Online Open article Subject Editor: Richard Michalet. Editor-in-Chief: Dries Bonte. Accepted 15 May 2017
Oikos 126: 1770–1779, 2017
doi: 10.1111/oik.03956
This work is licensed under the terms of a Creative Commons Attribution 4.0 International License (CC-BY) < http:// creativecommons.org/licenses/by/4.0/ >. The license permits use, distribution and reproduction in any medium, provided the original work is properly cited.
linked to relative availabilities of carbon (C), nitrogen (N) and phosphorus (P) (Bryant et al. 1985, Tuomi et al. 1988, Herms and Mattson 1992, Jones and Hartley 1999)(but see Koricheva 2002, Stamp 2003). Nutrient-limited vascular plant species were shown to contain more C-rich phenolics than nutrient replete plants (Wright et al. 2010). Phenotypic plasticity can thus affect within-species variation in phenolic compounds. Similarly, the synthesis of C-rich toxic metabo-lites by phytoplankton is generally enhanced under N or P limitation (Van de Waal et al. 2014).
These factors regulating secondary metabolites do not act on their own, but are interrelated. Non-native plants, for instance, often differ in phylogeny from natives, which can provide a competitive advantage (Hill and Kotanen 2009, Parker et al. 2012). Furthermore, the growth strategy of plants is generally phylogenetically determined (Scharfy et al. 2011) and the growth strategy can make certain invad-ers more dominant, for example forbs over graminoids, or floating over submerged plants (Scharfy et al. 2011, van Gerven et al. 2015). Although multiple factors control variation in secondary metabolites in concert, they are often studied separately.
Here, we tested whether non-native plants differ from natives in the activity of their secondary compounds, hereaf-ter hereaf-termed allelopathic potential, while accounting for effects of phylogeny, growth strategy and stoichiometry. Some freshwater plants are notorious invaders with a strong impact on native ecosystem structure and functioning (Vilà et al. 2009) and excrete secondary compounds that inhibit phy-toplankton and cyanobacterial competitors (Gross 2003a), a feature that may support survival of aquatic plants in eutro-phic freshwater systems (Hilt and Gross 2008). Here, we hypothesised that 1) non-native plants possess a higher allel-opathic potential than native plants, 2) interspecific varia-tion in allelopathic potential has an evoluvaria-tionary origin, and 3) emergent plants possess a higher allelopathic potential than submerged species. Furthermore, we hypothesised that 4) the allelopathic potential increases with increasing plant phenolic content and carbon-to-nutrient stoichiometry.
To test these hypotheses, we quantified the allelopathic potential of 34 freshwater plants, including 17 plant species non-native to northwestern Europe, using plant extracts and agar diffusion assays with the cyanobacterium
Dolichosper-mum flos-aquae. We also analysed the C, N, P and total
phe-nolics content (TPC) of plants. TPC is the most common and widespread class of secondary compounds in aquatic plants (Lodge 1991, Smolders et al. 2000, Gross and Bakker 2012).
Material and methods
Plant species
Fresh non-apical plant material was collected for 34 plant species from which 17 were native and 17 were non-native to northwestern Europe (Table 1). The native versus non-native distinction thus refers to plant origin. The selected non-native plants have all been reported to cause economic or ecological damage (Hussner 2012). We selected a wide array of vascular aquatic plants adapted to living underwater,
or to living on permanently waterlogged soils. In addition to vascular plants, we also included one species belonging to the
Charales and two Salviniales ferns to create a phylogenetically
diverse selection of plant species. From the 34 plant species, 21 were harvested from 11 field sites in the Netherlands from late September to early October 2012 (see Supplementary material Appendix 1 Table A1 for coordinates). In addition, 13 plant species (…native and … non-native) were bought from a plant breeder (Table 1). Of all species, 22 plant spe-cies were kept in a greenhouse on artificial pond sediment (Pokon Naturado, Veenendaal, the Netherlands) for a mini-mum of two weeks prior to collecting leaf tissue samples. This period in the greenhouse served to keep the collected plant material healthy, or to let the species grow more bio-mass, until they were used for analysis (see also Grutters et al. 2017a). Tissue of the other species was sampled upon collec-tion (Table 1). Species kept in the greenhouse did not dif-fer in morphological and physiological traits from those not kept in the greenhouse (t-tests p 0.05). We classified the plant growth strategy as submerged or emergent plants, with floating-leaved plants listed as emergent because their bio-chemistry resembles emergent plants more than submerged ones (Smolders et al. 2000). The distribution of plant growth strategy was kept as balanced as possible: nine of the 17 native and seven of the 17 non-native plant species were sub-merged. The role of phylogeny was tested in two ways. In the first, plant species were grouped into monocot and eudicot for use in linear models (ANOVA). However, this excluded six species because these species could not be grouped into mono- or eudicot (Table 1). In addition, a basic monocot vs eudicot analysis may fail to capture the phylogenetic signal in secondary compounds (Zhi-Yuan et al. 2016). Therefore, all plant species were included in the second phylogenetic analysis using generalized least squares.
Chemical analyses of plant material
To analyse physiological traits, namely C, N, P content and TPC, fresh plant material was split into eight aliquots that were all thoroughly rinsed with tap water and weighed (Table 1 gives details on the sampled plant parts). Five aliqots were then oven dried (60°C for 72 h), weighed and ground with a ball grinder. The remaining three aliquotes were freeze-dried, weighed and then ground also using a ball grinder. To quantify TPC, 10 mg of oven-dried ground plant mate-rial was extracted with 5 ml of 80% EtOH for 10 min at 80°C before SDS solution and FeCl3 reagent were added
(Smolders et al. 2000). The resulting reduction of Fe3 to
Fe2 by phenolic compounds was measured at 510 nm on
a spectrophotometer against a tannic acid calibration curve and expressed as mg tannic acid equivalents per gram plant dry weight. We used oven-dried material instead of the more commonly applied freeze-dried material because insufficient freeze-dried biomass was available. We note that this may have affected the absolute levels of phenolics, but probably not the relative levels (Asami et al. 2003). To measure foliar C and N content, 1.5 mg of ground, oven-dried plant sample was weighed in tin cups and analysed using an elemental analyser. The plant P content was determined by incinerat-ing 1 mg of ground oven-dried sample at 500°C for 30 min, followed by digestion with 5 ml of 2.5% persulphate in an
autoclave (30 min at 121°C). Samples were then centrifuged (30 min at 2500 rpm) and the dissolved P of the supernatant was analysed using an autoanalyzer. Total soluble sugar con-tent (sum of sorbitol, mannitol, glucose, fructose, sucrose, maltose, trehalose, raffinose, melezitose and melibiose) was determined through liquid chromatography–tandem mass spectrometry (ultra-performance chromatographic system coupled to a tandem mass spectrometer) on the methanolic extracts of freeze-dried plant samples that were also used in the agar diffusion bioassays.
Agar diffusion assays
We performed bioassays to assess the allelopathic potential (Meiners 2014) of the entire array of chemicals produced by each plant species (Gross et al. 1991, Engel et al. 2006, Bauer et al. 2009). Bioassays provide a standardised measure of the allelopathic potential of many plant species without requiring knowledge on individual or unidentified com-pounds (Kubanek et al. 2001, Engel et al. 2006, Puglisi et al. 2007). Following van Dam and Oomen (2008), freeze-dried ground plant material was extracted twice with MeOH (70% v/v). For the first extraction, the material was
boiled for 5 min and sonicated for 15 min before it was centrifuged (10 000 rpm) and the supernatant collected. For the second extraction, this procedure was repeated without boiling. The supernatants of both extractions were combined and stored at –20°C until use in the bioassays. For the agar diffusion bioassays (ADA), we cultivated the cyanobacterium Dolichospermum flos-aquae (formerly
Anabaena flos-aquae; Wacklin et al. 2009) strain 141/1b in
WC medium (Guillard 1975) supplemented with the vita-mins B12, biotin and Thiamine HCl (Kilham et al. 1998). Liquid batch cultures were incubated at 24°C at a light intensity of 30 mmol photons m–2 s–1 with a photoperiod
of 16 h : 8 h, light : dark, in climate-controlled incuba-tors. The agar diffusion bioassay (ADA) was performed using inoculation densities with an optical density of 0.3 at 530 nm (Gross et al. 1991, Bauer et al. 2009). A base agar of 15 ml of WC medium (1% agar) was poured into each petri dish (ø 9 cm). Three aliquots (40 ml) of the metha-nolic extracts, which correspond to 2 mg plant dry mass, were then spotted onto the agar (Supplementary material Appendix 1 Fig. A1). After drying, the base agar was cov-ered with 10 ml of Dolichospermum suspended in 1% agar, incubated at 28°C at 80 mmol photons m–2 s–1 for seven
Table 1. Freshwater plant species used in the analyses. Species were classified into clades (monocot, eudicot and ‘other’ in case of taxa outside these clades, Fig. 1), plant origin described as native status to northwestern (NW) Europe, native range (ARS-GRIN database at < www.ars-grin.gov > and Hussner 2012), growth strategy (emergent and floating plants versus submerged plants), greenhouse acclimation (whether species were held in the greenhouse) and plant part (which part of the plant was sampled).
Plant species Clade NW EuropeNative to Growth strategy Native range Greenhouse acclimation Plant part
Alisma plantago-aquatica monocot yes emergent holarctic yes leaf
Callitriche platycarpa eudicot yes submerged Europe, Asia yes shoot
Ceratophyllum demersum other yes submerged cosmopolitan no shoot
Chara contraria other yes submerged palearctic no shoot
Hottonia palustris eudicot yes submerged worldwide yes shoot
Hydrocharis morsus-ranae monocot yes emergent Europe, Asia no leaf
Hydrocotyle vulgaris eudicot yes emergent Europe, Asia no leaf
Menyanthes trifoliata eudicot yes emergent holarctic yes leaf
Myriophyllum spicatum eudicot yes submerged Europe, Asia yes shoot
Nuphar lutea other yes emergent Europe, Asia no leaf
Nymphaea alba other yes emergent Europe, Asia no leaf
Potamogeton lucens monocot yes submerged Europe, Asia no leaf
Potamogeton natans monocot yes emergent holarctic yes leaf
Potamogeton perfoliatus monocot yes submerged holarctic, Australia no leaf
Potamogeton pusillus monocot yes submerged worldwide no shoot
Ranunculus circinatus eudicot yes submerged Europe no shoot
Stratiotes aloides monocot yes emergent Europe no leaf
Azolla filiculoides other no emergent N-,C-,S- America yes leaf
Crassula helmsii eudicot no emergent Australasia yes shoot
Egeria densa monocot no submerged South America yes shoot
Egeria naias monocot no submerged South America yes shoot
Eichhornia crassipes monocot no emergent South America yes leaf
Elodea canadensis monocot no submerged North America yes shoot
Elodea nuttallii monocot no submerged North America yes shoot
Hydrocotyle ranunculoides eudicot no emergent N-,C-,S- America yes leaf
Lagarosiphon major monocot no submerged South Africa yes shoot
Ludwigia grandiflora eudicot no emergent South America yes leaf
Ludwigia peploides eudicot no emergent South America yes leaf
Lysichiton americanus monocot no emergent W North America yes leaf
Myriophyllum aquaticum eudicot no emergent South America yes shoot
Myriophyllum heterophyllum eudicot no submerged SW North America yes shoot
Pistia stratiotes monocot no emergent South America yes leaf
Salvinia molesta other no emergent South America yes leaf
(Chen et al. 2012a); Potamogetonaceae (Lindqvist et al. 2006); Salviniaceae (Metzgar et al. 2007); Myriophyllum
(Moody and Les 2007); Lamiales (Schäferhoff et al. 2010)]
and used it to calculate the phylogenetic signal in plant traits using Blomberg’s K (Blomberg et al. 2003). For phy-logenetic generalised least squares (PGLS) we used the Brownian model for trait evolution as correlation structure, because it fitted data better than an Ornstein–Uhlenbeck model according to AIC comparison (Burnham and Anderson 2002). We tested the significance of fixed factors in PGLS models using likelihood ratio tests.
TPC was square-root transformed to meet model assumptions. Data were analysed in R ver. 3.2.2 (< www.r-project.org >) using the doBy (Højsgaard et al. 2015), nlme (Pinheiro et al. 2015), picante (Kembel et al. 2010), ape (Paradis et al. 2004) and car packages (Fox and Weisberg 2011).
Data availability
Data are available from the Dryad Digital Repository: < https://dx.doi.org/10.5061/dryad.8jc52 > (Grutters et al. 2017b).
Results
Allelopathic potential and explanatory factors The 34 tested aquatic plant species varied considerably in their allelopathic potential (Fig. 1). Plant phylogeny, growth strategy and plant origin significantly affected the allelopathic potential when tested together in a three-way days (Gross et al. 1991), and all plates were subsequently
scanned to a photo using a digital scanner. Scans were then analysed to calculate the surface area in millimetres of indi-vidual clearing spots using ImageJ software. In addition to the plant extracts, we used a negative (70% aqueous MeOH v/v) and a positive control (3 ml of 1.5% NaClO in water, w/w) in the ADAs. Negative controls did not show clearing spots, whereas positive controls showed clearing spots (aver-age of 258 mm2 per spot).
Statistical analyses
We averaged the area of all three individual clearing spots on each plate for statistical analyses. This average area is referred to as plant allelopathic potential. The variance in allelopathic potential explained by plant phylogeny, growth strategy and plant origin was tested separately using t-tests that assumed heteroscedasticity, and tested simultaneously using heteroscedasticity-corrected three-way ANOVA. In addition, we applied (multiple) linear regression to test whether plant traits explained interspecific patterns in allelo-pathic potential. Variance inflation factors were calculated to assess multicollinearity and we found no severe problems as the highest variance inflation factor detected, in this case for C:P, was only 6.1. We used Pearson correlation to assess the linear correlation among variables.
For phylogenetic analyses more thorough than the dichotomous classification in the ANOVA, we con-structed a plant phylogenetic tree using Phylomatic (Webb and Donoghue 2005) in combination with adjust-ments to branch lengths using recent molecular litera-ture [Nymphaeales (Yoo et al. 2005, Biswal et al. 2012); Hydrocharitaceae (Chen et al. 2012b); Alismataceae
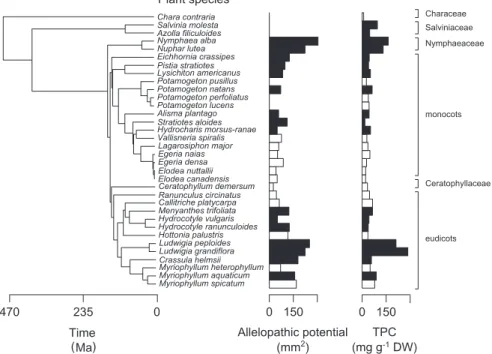
Figure 1. Phylogeny-based representation of plant allelopathic potential (clearing spot area in mm2) and total phenolics content (TPC; in mg g–1 DW) of 18 emergent (black bars) and 16 submerged aquatic plants (white bars). The time since divergence (in million years ago; Ma) is shown on the left based on recent molecular clock data (Yoo et al. 2005, Lindqvist et al. 2006, Metzgar et al. 2007, Moody and Les 2007, Schäferhoff et al. 2010, Biswal et al. 2012, Chen et al. 2012a, b). The clades to which plant species belong are displayed on the right. The absence of bars indicates undetectable clearing spots (0 mm2).
p 0.001; where a K 1 represents trait evolution that is linearly proportional to plant relatedness; Grafen 1989; Table 2). Phylogenetic generalised least squares analysis (PGLS) produced results similar to linear models. Plant origin did not explain variation in allelopathic potential, whereas plant growth strategy did (two-way PGLS, growth strategy: LR 6.8, p 0.009; origin: LR 0.22, p 0.64) when tested together.
Allelopathic potential and physiological traits
Of the measured plant traits, TPC had a significant phylo-genetic signal (K 0.50, p 0.001), whereas the signals for C content and C:P ratio were significant but much weaker (Table 2). The other traits showed no significant phylogenetic signal (Table 2). Plant traits differed most between emergent and submerged species, with TPC, C content, P content, ANOVA: plant phylogeny explained most variation in
allelopathic potential (F1,24 12.8, p 0.002), plant
growth strategy explained slightly less variation (F1,24 9.3,
p 0.005) and plant origin explained least of the variation (F1,24 8.4, p 0.008). Separate t-tests showed that eudicots
exhibited a higher allelopathic potential than monocots (Fig. 2A, t16.2 3.3, p 0.005), whereas there was no effect
of plant origin: native and non-native plant species had a similar mean allelopathic potential (Fig. 2B, t31.1 0.60,
p 0.56). For growth strategy, we found that emergent plants had a higher allelopathic potential than submerged plants (Fig. 2C, t26.7 3.1, p 0.005).
Allelopathic potential and phylogenetic analyses
There was also a strong phylogenetic signal in the allelopathic potential of aquatic plants (Fig. 1; Blomberg’s K 0.61,
(A) (B) (C)
Figure 2. Mean ( SE) plant allelopathic potential (clearing spot area in mm2) of plant species grouped according to plant clade (A), plant origin in northwestern Europe (B) and growth strategy (C). Asterisks indicate a significant statistical difference between both means tested using t-tests assuming heteroscedasticity (p 0.05). ‘n’ represents the number of plant species in each category.
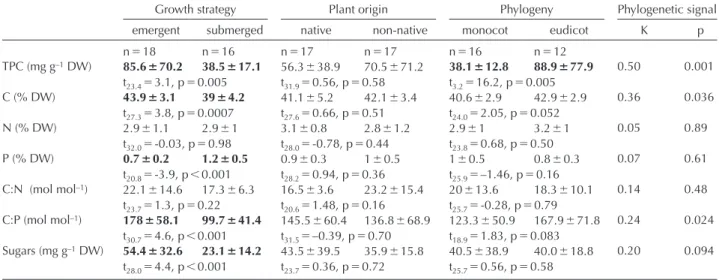
Table 2. Overview of plant traits grouped for growth strategy, origin and phylogeny. Means ( SE) of measured plant traits grouped for plant growth strategy, plant origin (native or non-native in northwestern Europe) and phylogeny. Measured traits were total phenolics content (TPC), carbon content (C), nitrogen content (N), phosphorus content (P), carbon-to-nitrogen ratio (C:N), carbon-to-phosphorus ratio (C:P) and total soluble sugars (Sugars). The phylogenetic signal displays Blomberg’s K value for each of the plant traits. Values in bold indicate statisti-cally significantly different groups, tested with t-tests assuming heteroscedasticity. ‘n’ indicates the number of plant species in each category.
Growth strategy Plant origin Phylogeny Phylogenetic signal emergent submerged native non-native monocot eudicot K p n 18 n 16 n 17 n 17 n 16 n 12 TPC (mg g–1 DW) 85.6 70.2 38.5 17.1 56.3 38.9 70.5 71.2 38.1 12.8 88.9 77.9 0.50 0.001 t23.4 3.1, p 0.005 t31.9 0.56, p 0.58 t3.2 16.2, p 0.005 C (% DW) 43.9 3.1 39 4.2 41.1 5.2 42.1 3.4 40.6 2.9 42.9 2.9 0.36 0.036 t27.3 3.8, p 0.0007 t27.6 0.66, p 0.51 t24.0 2.05, p 0.052 N (% DW) 2.9 1.1 2.9 1 3.1 0.8 2.8 1.2 2.9 1 3.2 1 0.05 0.89 t32.0 -0.03, p 0.98 t28.0 -0.78, p 0.44 t23.8 0.68, p 0.50 P (% DW) 0.7 0.2 1.2 0.5 0.9 0.3 1 0.5 1 0.5 0.8 0.3 0.07 0.61 t20.8 -3.9, p 0.001 t28.2 0.94, p 0.36 t25.9 –1.46, p 0.16 C:N (mol mol–1) 22.1 14.6 17.3 6.3 16.5 3.6 23.2 15.4 20 13.6 18.3 10.1 0.14 0.48 t23.7 1.3, p 0.22 t20.6 1.48, p 0.16 t25.7 -0.28, p 0.79 C:P (mol mol–1) 178 58.1 99.7 41.4 145.5 60.4 136.8 68.9 123.3 50.9 167.9 71.8 0.24 0.024 t30.7 4.6, p 0.001 t31.5 –0.39, p 0.70 t18.9 1.83, p 0.083 Sugars (mg g–1 DW) 54.4 32.6 23.1 14.2 43.5 39.5 35.9 15.8 40.5 38.9 40.0 18.8 0.20 0.094 t28.0 4.4, p 0.001 t23.7 0.36, p 0.72 t25.7 0.56, p 0.58
Discussion
Our results show that multiple factors control the allelo-pathic potential of aquatic plants, but contrary to our hypothesis, plant origin was not one of them (hypothesis 1). Instead, the allelopathic potential was primarily constrained by phylogeny (hypothesis 2). In addition, the plant growth strategy explained much of the variation in the allelopathic potential (hypothesis 3). Besides these factors, we found that two physiological traits, the C:P ratio and total pheno-lics content (TPC), explained interspecific patterns in the allelopathic potential (hypothesis 4). Therefore, we reject our first hypothesis, whereas we confirm the other three. Phenolic compounds
Phenolic compounds presumably controlled the allelopathic potential to a large degree as TPC explained 52% of its interspecific variation. Phenolic compounds play a role in many ecological processes (Appel 1993, Close and McArthur 2002), including the induction of allelopathic effects against phytoplankton (Gross et al. 2007). Both the allelopathic potential and TPC showed a strong phylogenetic signal, with a higher allelopathic potential and TPC in eudicot species than monocot species, and no inhibition of the cyanobac-terium in ferns and stoneworts (Fig. 1). The growth strat-egy of plants was also strongly related to their allelopathic potential, with emergent species having a larger potential C:P ratio and total soluble sugar content being higher in the
former (Table 2). In addition, eudicots had a higher TPC than monocots (Table 2).
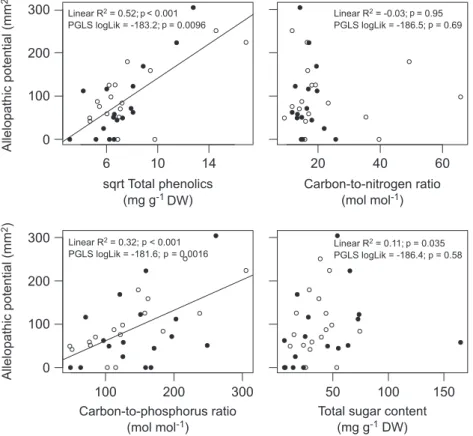
TPC best explained patterns in the allelopathic poten-tial and both showed a positive relation (R2 0.52,
p 0.001; Fig. 3). The allelopathic potential also increased with the plant C:P ratio (R2 0.32, p 0.001), but was
not related to the plant C:N ratio (R2 –0.03, p 0.95)
or sugar content (R2 0.006, p 0.28). Testing C, N and
P contents separately, plant C and P contents significantly explained variation in the allelopathic potential (respec-tively R2 0.20, p 0.005 and R2 0.15, p 0.013),
but N content did not (R2 0, p 0.30). PGLS
analy-sis on the allelopathic potential and plant traits produced qualitatively similar results (Fig. 3), however the plant C:P ratio explained the allelopathic potential better (log-Lik –181.6) than the TPC (log(log-Lik –183.2). Separately, plant C content best explained the allelopathic potential (logLik –182.0, p 0.003), followed by P content (logLik –184.1, p 0.026) and no effect of N content (logLik –186.2, p 0.41). TPC correlated positively with C content (Pearson correlation: r 0.55, p 0.001) and C:P ratio (r 0.61, p 0.001), negatively to P con-tent (r –0.39, p 0.023), and not with C:N (r –0.09, p 0.62). The C:N ratio of plants was strongly correlated with their N content (r –0.82, p 0.001), while their C:P ratio depended strongly on P content (r –0.86, p 0.001).
Figure 3. The relationship between the allelopathic potential of plants and four traits (n 34 aquatic plant species). Regression lines are shown for significant relations and represent results of linear regression. Adjusted R2 of linear regression and log-likelihood of phylogenetic generalised least squares (PGLS) analysis are shown along with p-values of respectively F-tests and likelihood ratio tests. Open symbols indicate non-native species, closed symbols indicate native species.
more carbon and sugars than submerged plants, together with a higher phenolics content (Table 2). The synthesis of plant secondary metabolites is also regulated by the relative availability of resources as suggested by the highly debated carbon–nutrient-balance hypothesis (Bryant et al. 1983, Koricheva 2002, Stamp 2003) or the more general frame-work of ecological stoichiometry (Sterner and Elser 2002). Higher carbon:nutrient ratios in plants reflect higher cellu-lar contents of C-rich biochemicals, which may also include C-rich secondary metabolites such as phenolic compounds. We indeed found positive correlations between both TPC and allelopathic potential and plant C:P ratios (but not with C:N ratios), across plant species. This may result from an enhanced allocation of carbon to phenolic compounds in plants possessing higher C:P ratios. These C:P ratios, however, differed also between plant growth strategies, and seemed higher in emergent plant species that require more carbon for structural biomass and for phenolic-based light screens (Close and McArthur 2002), but also have easier access to light and CO2 compared to submerged species
(Bornette and Puijalon 2011)(Table 1). It is thus unclear to what extent the allelopathic potential is directly related to the cellular availabilities of carbon, or whether it is indirectly coupled via distinct functional traits of emergent plants. Allelopathic potential
Our results demonstrate substantial allelopathic effects of the tested plant species on the cyanobacterium
Dolicho-spermum flos-aquae, which were strongly related to
under-lying plant traits. Freshwater submerged plants are known to excrete allelochemicals that inhibit the growth of a wide variety of phytoplankton and cyanobacteria species (van Donk and van de Bund 2002). Allelopathic effects can be highly species-specific, but can also be effective against multiple cyanobacteria and algae (Erhard and Gross 2006, Gross et al. 2007). Although our study demonstrates the allelopathic potential against the common cyanobacterium
D. flos-aquae, further research should elucidate whether the
allelopathic potential extends to other species of phytoplank-ton and cyanobacteria.
An important unanswered question is the degree to which secondary compounds are excreted in the field as allelochemicals (Hilt and Gross 2008). We assessed the effect of cell extracts, but not all compounds present in extracts may be excreted in sufficiently high concentrations (Gross et al. 2007). Some excreted compounds may be rapidly metabolised by bacteria or transformed by (UV-) light and oxygen. For some algae, the allelopathic effect of whole algal cells has been shown to be stronger than extracts (Martens et al. 2016), indicating that active compounds were rap-idly excreted. Besides excretion, plants also lose compounds through leaching, which may affect cyanobacteria, phyto-plankton and other biota living in the vicinity of the plants. Leaching effects of litter can be strong: phenolics leached from emergent plant litter are toxic to amphibians (Cohen et al. 2012), whereas saponins leaching from aquatic plants and tannins leaching from bark can poison fish (Applebaum and Birk 1979, Temmink et al. 1989). We assume that the cellular level of phenolic compounds is a good proxy for excreted (exuded, leached) active compounds, as several of and containing more TPC than submerged plant species. It
is thus conceivable that the allelopathic potential depended mainly on TPC, which is in line with the widely known eco-logical effects of phenolic compounds, including lowering of fungal or herbivore damage (Lodge 1991, Vergeer and Van der Velde 1997, Elger and Lemoine 2005, Lattanzio et al. 2006), slowing down microbial decomposition (Bardon et al. 2014) and inhibiting competitors through allelopathy (Gross et al. 1996). However, phenolics form a highly diverse group of compounds and are a coarse proxy for plant allelopathic effects (Leu et al. 2002, Gross 2003a). Presumably, only a sub-set of phenolic compounds are responsible for the observed effects (Leu et al. 2002, Sotka et al. 2009), and levels of these active compounds may differ among plant species. Because the majority of active compounds in aquatic plants are still unknown (Sotka et al. 2009, Forbey et al. 2013), we could solely use TPC as a proxy to express levels of secondary com-pounds in the tested aquatic plant species. Besides phenolics, freshwater plants also produce other active compounds, such as sulphuric compounds (Wium-Andersen et al. 1983) or alkaloids (Elakovich and Yang 1996). Yet, phenolics are cur-rently the compounds most consistently related to inhibi-tory activity (Planas et al. 1981, Leu et al. 2002, Gross and Bakker 2012). Our results seem to further confirm that phe-nolic compounds play a substantial role in the allelopathic activity of aquatic plants.
The level of phenolic compounds varied greatly among plant species. Variability between replicates and sites can be due to several factors, e.g. the presence or not of verti-cal gradients along the shoot, as observed for
Myriophyl-lum spicatum and Potamogeton perfoliatus (Hempel et al.
2009), or the attack of herbivores (Fornoff and Gross 2014). While multiple biotic and abiotic stressors control the intraspecific variation and phenotypic variation in phe-nolic compounds (Dixon and Paiva 1995), less is known about the drivers underlying interspecific variation. We confirmed that emergent plants generally contain higher levels of phenolic compounds than submerged plants (Smolders et al. 2000). One explanation is that emergent plants contain more structural polyphenols, such as lignin, than submerged plants. In addition, emergent plants may increase their TPC to protect against photodamage, as phenolics are powerful antioxidants (Close and McArthur 2002). TPC was shown to generally increase with increas-ing light levels (Close and McArthur 2002, Cronin and Lodge 2003, Gross 2003b). Terrestrial plants benefitted from the evolution of phenolic compounds, which act as ‘UV light screens’, when emerging from the aquatic envi-ronment onto the land (Gershenzon et al. 2012). Interest-ingly, we observed higher phenolic contents in the eudicots (Fig. 2A), a clade that is related more to terrestrial taxa than monocots of the order Alismatales (Cook 1999). Many eudicots are emergent or amphibious and seem accustomed to high light levels.
Furthermore, emergent plants have better access to light and CO2 than submerged plants, thereby stimulating
pho-tosynthesis and increasing their primary carbon metabolism. This may stimulate the biosynthesis of phenolics, which is closely linked to carbon metabolism via the shikimate and polyketide pathways (Gershenzon et al. 2012, Cheynier et al. 2013). Indeed, the emergent plants in our study contained
Author contributions – BMCG, ESB and BS designed the
experi-ment. BMCG and BS conducted the experiexperi-ment. BMCG analysed the data and wrote the first draft. All authors gave input on developing the methodology for the experiment and contributed substantially to the writing of the manuscript.
References
Appel, H. M. 1993. Phenolics in ecological interactions: the importance of oxidation. – J. Chem. Ecol. 19: 1521–1552. Applebaum, S. and Birk, Y. 1979. Saponins. – In: Herbivores: their
interaction with secondary plant metabolites. Academic Press, pp. 539–566.
Aschehoug, E. T. et al. 2014. Fungal endophyte increases the allelopathic effects of an invasive forb. – Oecologia 175: 285–291.
Asami, D. K. et al. 2003. Comparison of the total phenolic and ascorbic acid content of freeze-dried and air-dried marion-berry, strawberry and corn grown using conventional, organic and sustainable agricultural practices. – J. Agric. Food Chem. 51: 1237–1241.
Bardon, C. et al. 2014. Evidence for biological denitrification inhibition (BDI) by plant secondary metabolites. – New Phytol. 204: 620–630.
Bauer, N. et al. 2009. Seasonal and interannual dynamics of polyphenols in Myriophyllum verticillatum and their allelopathic activity on Anabaena variabilis. – Aquat. Bot. 91: 110–116.
Biswal, D. K. et al. 2012. Phylogenetic reconstruction in the Order Nymphaeales: ITS2 secondary structure analysis and in silico testing of maturase k (matK) as a potential marker for DNA bar coding. – BMC Bioinf. 13: S26.
Blomberg, S. P. et al. 2003. Testing for phylogenetic signal in comparative data: behavioral traits are more labile. – Evolution 57: 717–745.
Bornette, G. and Puijalon, S. 2011. Response of aquatic plants to abiotic factors: a review. – Aquat. Sci. 73: 1–14.
Bryant, J. P. et al. 1983. Carbon/nutrient balance of boreal plants in relation to vertebrate herbivory. – Oikos 40: 357–368. Burnham, K. P. and Anderson, D. R. 2002. Model selection and
multimodel inference: a practical information-theoretic approach. – Springer.
Callaway, R. M. and Ridenour, W. M. 2004. Novel weapons: invasive success and the evolution of increased competitive ability. – Front. Ecol. Environ. 2: 436–443.
Cappuccino, N. and Carpenter, D. 2005. Invasive exotic plants suffer less herbivory than non-invasive exotic plants. – Biol. Lett. 1: 435–438.
Cappuccino, N. and Arnason, J. T. 2006. Novel chemistry of invasive exotic plants. – Biol. Lett. 2: 189–193.
Chen, L.-Y. et al. 2012a. Generic phylogeny and historical biogeography of Alismataceae, inferred from multiple DNA sequences. – Mol. Phylogenet. Evol. 63: 407–416.
Chen, L.-Y. et al. 2012b. Generic phylogeny, historical biogeography and character evolution of the cosmopolitan aquatic plant family Hydrocharitaceae. – BMC Evol. Biol. 12: 30.
Cheynier, V. et al. 2013. Plant phenolics: recent advances on their biosynthesis, genetics and ecophysiology. – Plant Physiol. Biochem. 72: 1–20.
Choi, C. et al. 2002. Impact of polyphenols on growth of the aquatic herbivore Acentria ephemerella. – J. Chem. Ecol. 28: 2245–2256.
Close, D. C. and McArthur, C. 2002. Rethinking the role of many plant phenolics – protection from photodamage not herbivores? – Oikos 99: 166–172.
our tested plant species with high phenolic content possess a high allelopathic activity of exudates (Gross et al. 1996, Erhard and Gross 2006).
Secondary compounds can also affect ecosystem func-tioning without being excreted, because they interfere with the microbial decomposition of plants and nutrient cycling. Polyphenolics reduce nutrient cycling in terrestrial (Hätten-schwiler and Vitousek 2000, Cornwell et al. 2008, Bardon et al. 2014) and wetland ecosystems (Freeman et al. 2004) by inhibiting microbial decomposition and by complexing nutrients.
Non-native plants
The scientific literature contains many opposing results on whether the strength of plant secondary compounds depends on plant native origin. Non-native plants can contain stron-ger or more secondary compounds than natives (Callaway and Ridenour 2004), but not in all cases (Lind and Parker 2010, Meiners 2014). We found that tested for all plant spe-cies, the allelopathic potential of aquatic plant species was unrelated to plant origin, neither when tested in combina-tion with plant phylogeny and growth strategy nor sepa-rately. Only when tested with a subset of mono- and eudicot species, non-native plants had a slightly higher allelopathic potential than native plants on top of growth strategy and plant clade. Because plant origin appears unrelated or only weakly related to the allelopathic potential, we suggest that reports on stronger secondary metabolites in non-native plants may arise from differences with natives attributable to phylogeny and growth strategy. Our study demonstrates that invading eudicots with an emergent or floating growth strategy are most likely to possess strong allelopathic poten-tial. Or possibly vice versa, species possessing these traits may be more likely to show invasive behaviour.
Conclusion
We show that interspecific variation in the allelopathic potential of aquatic plants depends on several components. First, plant phylogeny and growth strategy explain most variation. Second, plant stoichiometry, which also depends on the plant’s growth strategy, determines how much plants can invest in secondary compounds. The plant allelopathic potential was strongly correlated with the plant’s total phenolic content. Plant origin had no effect on their allelo-pathic potential: non-native plants contained similar levels of total phenolic compounds and had similar allelopathic potential as natives. We thus conclude that plant species with high allelopathic potential have a clear profile of being eudicots with an emergent growth strategy and high plant C:P ratio. Unless non-native plant species match this pro-file, they generally have similar allelopathic potential as natives.
Acknowledgements – We would like to thank Yvonne Roijendijk and
Roos Plak for practical assistance and Nico Helmsing and Ciska Raaijmakers for help with chemical analysis.
Funding – This work was financially supported by NWO-ALW
Biodiversity works grant 841.11.011. This is publication 6309 of the Netherlands Inst. of Ecology (NIOO-KNAW).
Grutters, B. M. C. et al. 2016. Insect herbivory on native and exotic aquatic plants: phosphorus and nitrogen drive insect growth and nutrient release. – Hydrobiologia 778: 209–220. Grutters, B. M. C. et al. 2017a. Plant traits and plant biogeography
control the biotic resistance provided by generalist herbivores. – Funct. Ecol. 31: 1184–1192.
Grutters, B. M. C. et al. 2017b. Data from: Growth strategy, phylogeny and stoichiometry determine the allelopathic potential of native and non-native plants. – Dryad Digital Repository. < http://dx.doi.org/10.5061/dryad.8jc52 >. Guillard, R. R. 1975. Culture of phytoplankton for feeding marine
invertebrates. – In: Smith, W. L. and Chanely, M. H. (eds), Culture of marine invertebrate animals. – Springer, pp. 29–60. Harborne, J. B. 1977. Flavonoids and the evolution of the
angiosperms. – Biochem. Syst. Ecol. 5: 7–22.
Hättenschwiler, S. and Vitousek, P. M. 2000. The role of polyphe-nols in terrestrial ecosystem nutrient cycling. – Trends Ecol. Evol. 15: 238–243.
Hempel, M. et al. 2009. Community composition of bacterial bio-films on two submerged macrophytes and an artificial substrate in a pre-alpine lake. – Aquat. Microbiol. Ecol. 58: 79–94. Herms, D. A. and Mattson, W. J. 1992. The dilemma of plants: to
grow or defend. – Q. Rev. Biol. 67: 283–335.
Hill, S. B. and Kotanen, P. M. 2009. Evidence that phylogenetically novel non-indigenous plants experience less herbivory. – Oecologia 161: 581–590.
Hilt, S. and Gross, E. M. 2008. Can allelopathically active submerged macrophytes stabilise clear-water states in shallow lakes? – Basic Appl. Ecol. 9: 422–432.
Højsgaard, S. et al. 2015. doBy: doBy – Groupwise summary statistics, LSmeans, general linear, contrasts, various utilities. – R package ver. 4.5-12 1.
Horner, J. D. et al. 1988. The role of carbon-based plant secondary metabolites in decomposition in terrestrial ecosystems. – Am. Nat. 132: 869–883.
Hussner, A. 2012. Alien aquatic plant species in European countries. – Weed Res. 52: 297–306.
Jones, C. G. and Hartley, S. E. 1999. A protein competition model of phenolic allocation. – Oikos 86: 27–44.
Kembel, S. W. et al. 2010. Picante: R tools for integrating phylogenies and ecology. – Bioinformatics 26: 1463–1464. Kilham, S. S. et al. 1998. COMBO: a defined freshwater culture
medium for algae and zooplankton. – Hydrobiologia 377: 147–159.
Kim, Y. O. and Lee, E. J. 2011. Comparison of phenolic compounds and the effects of invasive and native species in East Asia: support for the novel weapons hypothesis. – Ecol. Res. 26: 87–94.
Koricheva, J. 2002. The carbon–nutrient balance hypothesis is dead; long live the carbon–nutrient balance hypothesis? – Oikos 98: 537–539.
Körner, S. and Nicklisch, A. 2002. Allelopathic growth inhibition of selected phytoplankton species by submerged macrophytes. – J. Phycol. 38: 862–871.
Kubanek, J. et al. 2001. Lignoid chemical defenses in the freshwa-ter macrophyte Saururus cernuus. – Chemoecology 11: 1–8. Lattanzio, V. et al. 2006. Role of phenolics in the resistance
mechanisms of plants against fungal pathogens and insects. – Phytochem. Adv. Res. 661: 23–67.
Leu, E. et al. 2002. Polyphenolic allelochemicals from the aquatic angiosperm Myriophyllum spicatum inhibit photosystem II. – Plant Physiol. 130: 2011–2018.
Lind, E. M. and Parker, J. D. 2010. Novel weapons testing: are invasive plants more chemically defended than native plants? – PLoS One 5: e10429.
Lindqvist, C. et al. 2006. Molecular phylogenetics of an aquatic plant lineage, Potamogetonaceae. – Cladistics 22: 568–588. Cohen, J. S. et al. 2012. Traits, not origin, explain impacts of plants
on larval amphibians. – Ecol. Appl. 22: 218–228.
Cook, C. D. 1999. The number and kinds of embryo-bearing plants which have become aquatic: a survey. – Perspect. Plant Ecol. Evol. Syst. 2: 79–102.
Cornwell, W. K. et al. 2008. Plant species traits are the predominant control on litter decomposition rates within biomes worldwide. – Ecol. Lett. 11: 1065–1071.
Cronin, G. and Lodge, D. M. 2003. Effects of light and nutrient availability on the growth, allocation, carbon/nitrogen balance, phenolic chemistry, and resistance to herbivory of two freshwater macrophytes. – Oecologia 137: 32–41.
Dixon, R. A. and Paiva, N. L. 1995. Stress-induced phenylpropanoid metabolism. – Plant Cell 7: 1085.
Dorenbosch, M. and Bakker, E. S. 2011. Herbivory in omnivorous fishes: effect of plant secondary metabolites and prey stoichi-ometry. – Freshwater Biol. 56: 1783–1797.
Elakovich, S. D. and Yang, J. 1996. Structures and allelopathic effects of Nuphar alkaloids: Nupharolutine and 6, 6′-dihydroxythiobinupharidine. – J. Chem. Ecol. 22: 2209–2219.
Elger, A. and Lemoine D. 2005. Determinants of macrophyte palatability to the pond snail Lymnaea stagnalis. – Freshwater Biol. 50: 86–95.
Engel, S. et al. 2006. Antimicrobial activities of extracts from tropical Atlantic marine plants against marine pathogens and saprophytes. – Mar. Biol. 149: 991–1002.
Erhard, D. and Gross, E. M. 2006. Allelopathic activity of Elodea
canadensis and Elodea nuttallii against epiphytes and
phytoplankton. – Aquat. Bot. 85: 203–211.
Freeman, C. et al. 2004. A regulatory role for phenol oxidase during decomposition in peatlands. – Soil Biol. Biochem. 36: 1663–1667.
Forbey, J. S. et al. 2013. A pharm-ecological perspective of terrestrial and aquatic plant–herbivore interactions. – J. Chem. Ecol. 39: 465–480.
Fornoff, F. and Gross, E. M. 2014. Induced defense mechanisms in an aquatic angiosperm to insect herbivory. – Oecologia 175: 173–185.
Fox, J. and Weisberg, S. 2011. An R companion to applied regression. – Sage.
Gershenzon, J. et al. 2012. Mixtures of plant secondary metabolites: metabolic origins and ecological benefits. – In: The ecology of plant secondary metabolites: from genes to global processes. Cambridge Univ. Press, pp. 56–77.
Grafen, A. 1989. The phylogenetic regression. – Phil. Trans. R. Soc. B 326: 119–157.
Gross, E. M. 2003a. Allelopathy of aquatic autotrophs. – Crit. Rev. Plant Sci. 22: 313–339.
Gross, E. M. 2003b. Differential response of tellimagrandin II and total bioactive hydrolysable tannins in an aquatic angiosperm to changes in light and nitrogen. – Oikos 103: 497–504.
Gross, E. M. and Bakker, E. S. 2012. The role of plant secondary metabolites in freshwater macrophyte–herbivore interactions: limited or unexplored chemical defences. – In: The integrative role of plant secondary metabolites in ecological systems. Br. Ecol. Soc./Cambridge Univ. Press, pp. 154–169.
Gross, E. M. et al. 1991. Fischerellin, a new allelochemical from the freshwater cyanobacterium Fischerella muscicola. – J. Phycol. 27: 686–692.
Gross, E. M. et al. 1996. Release and ecological impact of algicidal hydrolysable polyphenols in Myriophyllum spicatum. – Phytochemistry 41: 133–138.
Gross, E. M. et al. 2007. Searching for allelopathic effects of submerged macrophytes on phytoplankton – state of the art and open questions. – Hydrobiologia 584: 77–88.
Stamp, N. 2003. Out of the quagmire of plant defense hypotheses. – Q. Rev. Biol. 78: 23–55.
Sterner, R. W. and Elser, J. J. 2002. Ecological stoichiometry: the biology of elements from molecules to the biosphere. – Princeton Univ. Press.
Suseela, V. et al. 2015. Plant–soil interactions regulate the identity of soil carbon in invaded ecosystems: implication for legacy effects. – Funct. Ecol. 30: 1227–1238.
Svensson, J. R. et al. 2013. Novel chemical weapon of an exotic macroalga inhibits recruitment of native competitors in the invaded range. – J. Ecol. 101: 140–148.
Temmink, J. et al. 1989. Acute and sub-acute toxicity of bark tan-nins in carp (Cyprinus carpio L.). – Water Res. 23: 341–344. Tuomi, J. et al. 1988. Defensive responses of trees in relation to
their carbon/nutrient balance. – In: Mattson, W. J. et al. (eds), Mechanisms of woody plant defenses against insects. Springer, pp. 57–72.
van Dam, N. M. and Oomen, M. W. 2008. Root and shoot jasmonic acid applications differentially affect leaf chemistry and herbivore growth. – Plant Signal Behav. 3: 91–98. Van de Waal, D. B. et al. 2014. Stoichiometric regulation of
phytoplankton toxins. – Ecol. Lett. 17: 736–742.
van Donk, E. and van de Bund, W. J. 2002. Impact of submerged macrophytes including charophytes on phyto- and zooplankton communities: allelopathy versus other mechanisms. – Aquat. Bot. 72: 261–274.
van Gerven, L. P. et al. 2015. Competition for light and nutrients in layered communities of aquatic plants. – Am. Nat. 186: 72–83. Vergeer, L. H. T. and Van Der Velde, G. 1997. Phenolic content
of daylight-exposed and shaded floating leaves of water lilies (Nymphaeaceae) in relation to infection by fungi. – Oecologia 112: 481–484.
Vilà, M. et al. 2009. How well do we understand the impacts of alien species on ecosystem services? A pan-European, cross-taxa assessment. – Front. Ecol. Environ. 8: 135–144. Wacklin, P. et al. 2009. Nomenclatural validation of the genetically
revised cyanobacterial genus Dolichospermum (Ralfs ex Bornet et Flahault) comb. nova. – Fottea 9: 59–64.
Webb, C. O. and Donoghue, M. J. 2005. Phylomatic: tree assembly for applied phylogenetics. – Mol. Ecol. Notes 5: 181–183. Wink, M. 2003. Evolution of secondary metabolites from
an ecological and molecular phylogenetic perspective. – Phytochemistry 64: 3–19.
Wium-Andersen, S. et al. 1983. Elemental sulphur, a possible allelopathic compound from Ceratophyllum demersum. – Phytochemistry 22: 2613–2613.
Wright, D. M. et al. 2010. Do leaves of plants on phosphorus-impoverished soils contain high concentrations of phenolic defence compounds? – Funct. Ecol. 24: 52–61.
Yoo, M.-J. et al. 2005. Divergence times and historical biogeogra-phy of Nymphaeales. – Syst. Bot. 30: 693–704.
Zhi-Yuan, D. et al. 2016. Phylogenetic tree of vascular plants reveals the origins of aquatic angiosperms. – J. Syst. Evol. 54: 342–348 Lodge, D. M. 1991. Herbivory on freshwater macrophytes.
– Aquat. Bot. 41: 195–224.
Macel, M. et al. 2014. Novel chemistry of invasive plants: exotic species have more unique metabolomic profiles than native congeners. – Ecol. Evol. 4: 2777–2786.
Martens, H. et al. 2016. Salinity effects on growth and toxin pro-duction in an Alexandrium ostenfeldii (Dinophyceae) isolate from the Netherlands. – J. Plankton Res. 38: 1302–1316. McLeod, M. L. et al. 2016. Exotic invasive plants increase
productivity, abundance of ammonia-oxidizing bacteria and nitrogen availability in intermountain grasslands. – J. Ecol. 104: 994–1002.
Meiners, S. J. 2014. Functional correlates of allelopathic potential in a successional plant community. – Plant Ecol. 215: 661–672.
Metzgar, J. S. et al. 2007. Phylogeny and divergence time estimates for the fern genus Azolla (Salviniaceae). – Int. J. Plant Sci. 168: 1045–1053.
Moody, M. L. and Les, D. H. 2007. Geographic distribution and genotypic composition of invasive hybrid watermilfoil (Myriophyllum spicatum x M. sibiricum) populations in North America. – Biol. Invas. 9: 559–570.
Mulderij, G. et al. 2007. Allelopathic activity of Stratiotes aloides on phytoplankton – towards identification of allelopathic substances. – Hydrobiologia 584: 89–100.
Paradis, E. et al. 2004. APE: analyses of phylogenetics and evolution in R language. – Bioinformatics 20: 289–290.
Parker, J. D. et al. 2012. Phylogenetic isolation increases plant success despite increasing susceptibility to generalist herbivores. – Divers. Distrib. 18: 1–9.
Pinheiro, J. et al. 2015. nlme: linear and non-linear mixed effects models. – R package ver. 3.1-1191.
Planas, D. et al. 1981. Ecological significance of phenolic compounds of Myriophyllum spicatum. – Verh. Int. Verein. Limnol. 21: 1492–1496.
Puglisi, M. P. et al. 2007. Antimicrobial activities of extracts from Indo-Pacific marine plants against marine pathogens and saprophytes. – Mar. Biol. 150: 531–540.
Ridenour, W. M. and Callaway, R. M. 2001. The relative importance of allelopathy in interference: the effects of an invasive weed on a native bunchgrass. – Oecologia 126: 444–450.
Schäferhoff, B. et al. 2010. Towards resolving Lamiales relationships: insights from rapidly evolving chloroplast sequences. – BMC Evol. Biol. 10: 352.
Scharfy, D. et al. 2011. Invasive forbs differ functionally from native graminoids, but are similar to native forbs. – New Phytol. 189: 818–828.
Smolders, A. J. P. et al. 2000. Phenolic contents of submerged, emergent and floating leaves of aquatic and semi-aquatic macrophyte species: why do they differ? – Oikos 91: 307–310. Sotka, E. E. et al. 2009. The emerging role of pharmacology in
understanding consumer–prey interactions in marine and freshwater systems. – Integr. Compar. Biol. 49: 291–313.
Supplementary material (available online as Appendix oik-03956 at < www.oikosjournal.org/appendix/oik-oik-03956 >). Appendix 1.