HAL Id: hal-01307075
https://hal.sorbonne-universite.fr/hal-01307075
Submitted on 26 Apr 2016
HAL is a multi-disciplinary open access archive for the deposit and dissemination of sci-entific research documents, whether they are pub-lished or not. The documents may come from teaching and research institutions in France or abroad, or from public or private research centers.
L’archive ouverte pluridisciplinaire HAL, est destinée au dépôt et à la diffusion de documents scientifiques de niveau recherche, publiés ou non, émanant des établissements d’enseignement et de recherche français ou étrangers, des laboratoires publics ou privés.
Distributed under a Creative Commons Attribution| 4.0 International License
2012 in the Chukchi Sea
John R. Dolan, Eun Jin Yang, Tae Wan Kim, Sung-Ho Kang
To cite this version:
John R. Dolan, Eun Jin Yang, Tae Wan Kim, Sung-Ho Kang. Microzooplankton in a Warming Arctic: A Comparison of Tintinnids and Radiolarians from Summer 2011 and 2012 in the Chukchi Sea. Acta Protozoologica, Jagiellonian University, 2014, 53 (1), pp.101-113. �10.4467/16890027AP.14.010.1447�. �hal-01307075�
doi:10.4467/16890027AP.14.010.1447
ACTA
PROTOZOOLOGICA
Microzooplankton in a Warming Arctic: A Comparison of Tintinnids and
Radiolarians from Summer 2011 and 2012 in the Chukchi Sea
John R. Dolan
1, 2, Eun Jin Yang
3, Tae Wan Kim
3and Sung-Ho Kang
31 Sorbonne Universités, UPMC Univ Paris 06, UMR 7093, LOV, Observatoire Océanologique, F-06230, Villefranche-sur-Mer,
France; 2 CNRS, UMR 7093, LOV, Observatoire Océanologique, F-06230, Villefranche-sur-Mer, France; 3 Korea Polar Research
Institute, KIOST, 213-3 Songdo-dong, Yeonsu-gu, Incheon, 406-840, Korea
Abstract. The Chukchi Sea was sampled in August of 2011, a year of near-normal sea ice among recent years, and again in August 2012,
a year of all time record low sea ice. We exploited this sampling to test the hypothesis that different sea ice conditions are associated with differences in abundances or species composition of microzooplankton through an examination of tintinnids and radiolarians. From 18 stations in 2011, and 19 stations in 2012, organisms were enumerated in plankton net tow material, and chlorophyll determinations made (total and ≤ 20 µm) from discrete depth samples. We found that the low sea ice conditions of 2012 were associated with higher chlorophyll concentrations (both total and the ≤ 20 µm size fraction), compared to 2011. However, tintinnid ciliates and radiolarians were much lower in concentration, by about an order of magnitude, compared to 2011. In both years the radiolarian assemblage was dominated by Amphiselma setosa. The species composition of the tintinnid ciliates was similar in the two years, but there were distinct differences in the relative abun-dances of certain species. The 2012, low sea ice assemblage, was dominated by small forms in contrast to 2011, when large species were the most abundant. We present these findings in detail and discuss possible explanations for the apparent differences in the microzooplankton communities associated with distinct sea ice conditions in the Chukchi Sea.
Keywords: Climate change, plankton, rhizaria, sea ice, Tintinnina.
Address for correspondence: John R. Dolan, Sorbonne Universi-tés, UPMC Univ Paris 06, UMR 7093, LOV, Observatoire Océ-anologique, F-06230, Villefranche-sur-Mer, France and CNRS, UMR 7093, LOV, Observatoire Océanologique, F-06230, Ville-franche-sur-Mer, France; E-mail: [email protected].
Review paper
Special issue:
Marine Heterotrophic Protists
Guest editors: John R. Dolan and David J. S. Montagnes
INTRODUCTION
Among all marine systems, the effects of climate change will likely be greatest in polar regions, as they will be directly impacted by loss of sea ice and
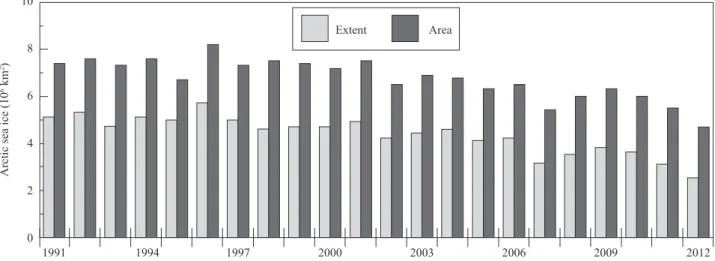
subse-quent shifts in species distributions (Doney et al. 2012). The recent dramatic declines in Arctic sea ice extent (total area containing zones of sea ice) and sea ice area (area actually occupied by sea ice) are evident (Fig. 1), and summers free of sea ice are expected within as little as 30 years from now (Wang and Overland 2009).
To date, the expected changes in the pelagic food webs of arctic seas have been assessed largely with models. Typically, models both conceptual (e.g., Was-sman 2011) and quantitative (e.g., Zhang et al. 2010), point to marked increases in primary production, due to
Fig. 1. Sea ice data for the month of August for 1991 to 2012. Data from the National Ice Data Center (nsdic.org). Note that sea ice was
lower in 2012 than the previous record low of 2007. 8
6 4 2 0
Arctic sea ice (10
6 km 2)
1991 1994 1997 2000
Extent Area
2003 2006 2009 2012
both a longer ice-free season and larger area free of sea ice, leading to higher biomass of both phytoplankton and zooplankton as well increases in flux to the ben-thos. However, most food web models have virtually ignored possible changes in microzooplankton (i.e., protists) and have focused on shifts in the timing and duration of phytoplankton blooms and possible ef-fects on the composition and abundance of metazoan zooplankton, because the latter are directly connected with certain exploited fish populations (e.g., Hunt et
al. 2011, Rubao et al. 2013). This is despite the fact
that microzooplankton are now generally recognized as a key component of pelagic food webs (e.g., Calbet and Landry 2004) and can potentially be a direct link to fish, via larval fish consumption of microzooplankton (Mon-tagnes et al. 2010).
Some have hypothesized that increases in the ice-free period, following the spring bloom of phyto-plankton, will lead to increases in the importance of microzooplankton grazing, compared to that of the me-sozooplankton (e.g. Michel et al. 2012). However, in a recent review, Caron and Hutchins (2013) postulated that there may be ‘non-intuitive’ and ‘counter-acting’ effects of even small increases in temperature on the balance between phytoplankton and their microzoo-plankton grazers. Indeed, the effects of temperature in-creases on microbial food webs appear to be particular-ly unpredictable in both marine (Vazquez-Dominguez
et al. 2012) and freshwaters (Montagnes et al. 2008).
A recent mesocosm study of Baltic communities sug-gested that small increases in temperature will reduce the time-lag between blooms of phytoplankton and their protozoan grazers (Aberle et al. 2012). Such an effect may though not occur in Arctic systems. Rose and Caron (2007) specifically suggested that in polar communities phytoplankton growth could be less con-strained by temperature than the growth of their pro-tozoan grazers; recently this view has been contested (Sherr et al. 2013). Given such large uncertainties, there is a clear need for field observations of micro-zooplankton and the establishment of empirical rela-tionships (Caron and Hutchins 2013). As it is widely acknowledged that microzooplanton are a key link in nearly every pelagic food web, the effects of changes in Arctic sea ice conditions on microzooplankton clearly merit examination.
There are good reasons to assume that changes in sea ice extent and duration as well as warmer waters will impact microzooplankton communities in some fashion. For example, changes in abundances or species compositions of a wide variety of Arctic protistan taxa have occurred with changes in sea ice conditions. Sedi-ment core material from well-studied areas indicate dis-tinct shifts in assemblages of diatoms (Weckström et al. 2013), dinoflagellates (Solignac et al. 2011), and ben-thic foraminifera (Polyak et al. 2013). However, such studies, while highly suggestive, are of limited value in predicting changes over the next decades, as sediment
core material integrates conditions over long periods, and evidence from the gradual changes of the past may be of limited value in assessing the effects of contem-porary rapid changes. The, perhaps, more appropriate sequencing-based studies have suggested that micro-bial communities (including eukaryotic forms) may be responding to recent polar changes in the form of shifts in species compositions; however, apparent changes are difficult to relate directly to abundance or compositions of functional groups (Comeau et al. 2011).
We examined certain protistan taxa of the microzoo-plankton in the Chukchi Sea as a preliminary attempt to assess the effect of changes in summer sea ice condi-tions. Among all the Arctic Seas, in the Chukchi Sea changes in sea ice have been perhaps the most marked over the past decade (Grebmeier 2012). A variety of climate change models concur in predicting ice-free summers in the Chukchi Sea in the coming decades (Wang et al. 2012). While these long-term trends are clear, there is considerable inter-annual variability. The Chukchi Sea was sampled extensively by the Korean icebreaker Araon in August of 2011, a year of near-normal sea ice among recent years, and again in August 2012, a new record summer of low sea ice (Fig. 1).
From plankton net samples we enumerated the tintinnids and radiolarians of the microzooplankton to test the hypothesis that different summer sea ice conditions of 2011 and 2012 are associated with dif-ferences in abundances or species composition of mi-crozooplankton. We focused on tintinnid ciliates and radiolarians. In most systems, both groups are gener-ally minor components of the microzooplankton, in terms of numerical concentrations or biomass, com-pared to oligotrichid ciliates or heterotrophic dinofla-gellates, including the microzooplankton of the Bering and Chukchi Seas (Sherr et al. 2009, 2013). However, in contrast to oligotrichid ciliates or dinoflagellates, changes in community composition are relatively easy to assess because species identifications can be made (with certain caveats) on the basis of the lorica in tin-tinnids or the skeleton in radiolarians, by microscopic examination of preserved, but otherwise untreated, material. Notably, there exists a considerable litera-ture on species occurrences and distributions of both tintinnids and radiolarians. Furthermore, in tintinnids, the morphology of the lorica, especially the diameter of the open, oral end of the lorica, the lorica oral di-ameter (LOD), is relatable to some ecological char-acteristics of the species, such as prey size exploited
and maximum growth rate (Dolan 2010, Montagnes 2013). Consequently, changes in the morphological characteristics of a tintinnid assemblage correspond with changes in ecological characteristics (Dolan and Pierce 2013). Data on the resources exploited by microzooplankton were gathered in the form chloro-phyll a concentrations, both total and the less than 20 µm size fraction corresponding to ‘nano-pico sized phytoplankton’.
Here we present data on the communities of tintin-nids and radiolarians found in the Chukchi Sea in Au-gust with the distinct sea ice conditions of 2011 and 2012. While limited in focus to tintinnids and radiolar-ians, this is the first study, to our knowledge, to attempt to directly examine the effects of disappearing summer sea ice in the Arctic on microzooplankton.
MATERIALS AND METHODS
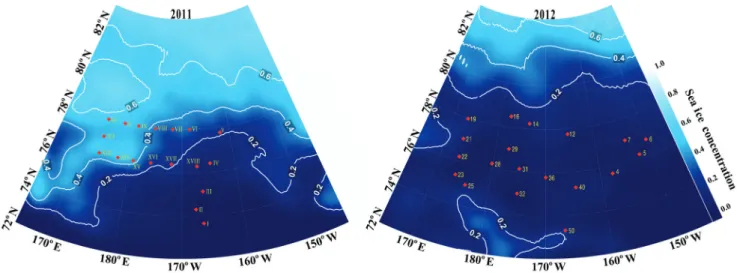
Data and samples were collected in the Chukchi Sea from on-board the Korean Research Icebreaker Araon in August 2011 and in August/early September in 2012. Data presented here are from 18 stations from the 2011 cruise and 19 stations from the 2012 cruise. Station locations and sea ice concentrations in the Chuk-chi Sea during the cruise period (based on data from the NSDIC) are shown in Fig. 2. A Niskin bottle rosette equipped with CTD probes was used to obtain discrete depth samples for chlorophyll and nutrient measures and plankton net tows were performed to assess microplankton community composition. Samples for other biological, physical and chemical parameters were taken; howev-er, sample and data analysis are in progress and data will appear later, elsewhere.
For chlorophyll a determinations, water samples of 0.3–1 l were obtained from 6–7 discrete depths between the surface and 100 m depth. Water samples were filtered through a 0.7 µm Whatman glass fiber filter (GF/F), directly for ‘total chlorophyll’ or first filtered through a 20 µm Nucleopore filter to estimate the size-fraction, ‘≤ 20 µm’. Chlorophyll concentrations were determined onboard using a Turner Designs Trilogy model fluorometer calibrated using commercial chlorophyll a standards. For details of the protocols see Lee et al. (2007).
Net tows were made with a 20-µm plankton net of 0.45 m diam-eter towed from 100 m depth to the surface. For direct microscopic examination, net tow material was fixed by standard methods (6% Bouin’s or 2% Lugol’s, final concentration). Aliquots were exam-ined in settling chambers using an inverted microscope equipped with DIC optics. Multiple aliquots were examined until a net ma-terial sample volume representing mama-terial from at least 10–20 l was analysed. Tintinnid species identifications were made based on lorica morphology using the monographs of Kofoid and Campbell (1929, 1939). Radiolarians were overwhelming dominated by a sin-gle morphotype identified by Noritoshi Suzuki (Tohoku University) as Amphimelissa setosa.
Fig. 2. Station locations and sea ice concentrations (fraction surface covered) in August 2011 and August 2012. For exact locations and
sampling dates see Table 1.
Nominal concentrations of organisms were calculated based 100 m net hauls. In general, very few tintinnids are found below the chlorophyll maximum depth (e.g., Dolan and Marassé 1995) which was usually between 20–50 m depth. Consequently, the concen-trations of tintinnids in the surface layer were likely several times higher than those reported here which represent the entire 100 m water column. With regard to the possibility of under-estimation of organismal concentrations due to net clogging, based on our experi-ence, the density of particulate matter in the net tow material was relatively sparse, particularly in the 2012 samples. Thus, we believe that net clogging did not occur.
Correlation analysis was applied to investigate the relationships between concentrations (log transformed) of organisms and chloro-phyll. Comparisons of data from 2011 to those of 2012 were made using the Mann-Whitney rank sum test, as data did not meet the requirements of normality. All differences noted in the results and discussion as “significant” refer to the Mann-Whitney U statistic with a probability level of p < 0.001.
RESULTS
Across the basin there were distinct differences in sea ice concentrations in 2011 and 2012 (Figs. 1, 2). In both years a wide variety of water column conditions were encountered (Tables 1, 2). For example, near sur-face salinity values varied between about 25–29 PSU among stations in both years. The temperature at 2 m depth averaged –1.0 ± 0.29°C at the 2011 stations, that included a wide range of sea ice concentrations, com-pared to –0.6 ± 0.40°C in 2012 when no sea ice was encountered.
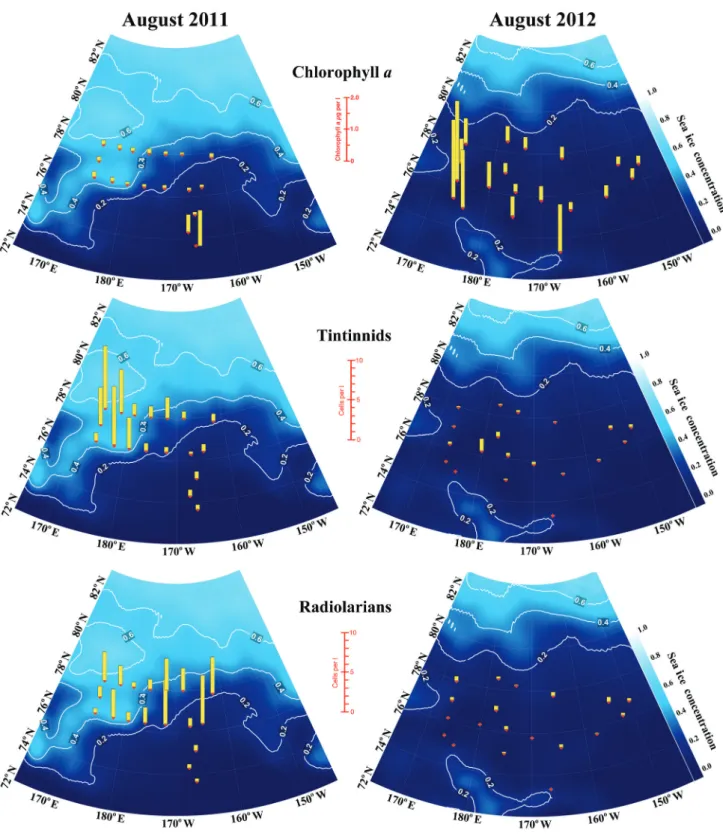
The organismal concentrations were distinctly dif-ferent in the two years. In 2011 chlorophyll a concentra-tions were low in the staconcentra-tions with sea ice (0.16 ± 0.02 µg l–1) and peaked in the ice-free stations (Fig. 3). An
inverse pattern characterized tintinnids and radiolarians all of which showed markedly lower concentrations in the ice-free stations (Fig. 3). The overall averages for the 2011 stations were 2.3 ± 4.41 tintinnids l–1 and 2.3
± 1.89 radiolarians l–1. Different organismal
concentra-tions were encountered in the sea ice-free 2012 sam-pling. Average chlorophyll concentrations were dis-tinctly and significantly higher (avg. 0.8 ± 0.75 µg l–1),
especially compared to the sea ice stations in 2011 (Fig. 3). However, concentrations of tintinnids (0.3 ± 0.42 cells l–1) and radiolarians (0.2 ± 0.19 cells l–1) were
distinctly and significantly lower, by about an order of magnitude, compared to the concentrations encoun-tered in 2011 (Fig. 3).
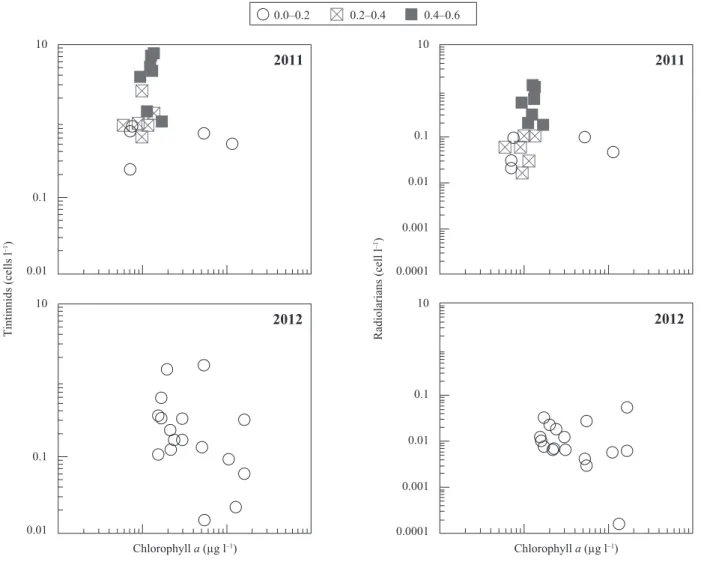
There was no significant correlation between log tintinnids and log chlorophyll a for either 2011 or 2012. However, the highest concentrations of tintinnids cor-respond to the low-chlorophyll, high sea ice stations of 2011. Log radiolarian concentrations (Fig. 4) were negatively, but weakly related to log chlorophyll con-centrations in both 2011 (r2 = 0.20, p < 0.05) and 2012
(r2 = 0.26, p < 0.05). In both years there was a
sub-stantial portion of the chlorophyll stock in the size frac-tion ≤ 20 µm. Although the proporfrac-tion of this “nano-pico-sized phytoplankton” was highest in the stations with sea ice in 2011, the absolute concentrations were
Table 1. Summary data from the August 2011 cruise. The concentrations of chlorophyll a, tintinnids and radiolarians are values per liter,
integrated through the 0–100 m depth segment of the water column. Chlorophyll concentrations were determined in 6–8 discrete depth samples between 0 and 100 m. Organismal concentrations are from plankton net tow material obtained using a 20 µm net drawn from 100 to 0 m depth.
St Lat, Long Date Salinity
@2m Temp@2m Total Chlorophyll a µg l–1 ≤ 20 µm Chlorophyll a µg l–1 Tintinnids l–1 Radiolariansl–1
I 73.6°N, 166.5°W 02 27.5 -0.2 1.17 0.51 0.51 0.30 II 74.3°N, 167.6°W 03 26.6 –0.4 0.54 0.20 0.70 0.48 III 75.1°N, 166.3°W 04 25.9 –1.1 0.08 0.05 0.86 0.69 IV 76.4°N, 164.7°W 05 25.4 –1.1 0.07 0.07 0.73 6.07 V 77.7°N, 161.9°W 06 26.5 –1.1 0.12 0.11 0.88 4.54 VI 78.0°N, 168.3°W 09 27.7 –1.1 0.06 0.06 0.88 2.71 VII 78.0°N, 172.0°W 09 27.7 –1.2 0.10 0.10 2.51 4.07 VIII 78.0°N, 175.7°W 09 27.7 –1.3 0.14 0.14 1.29 1.23 IX 78.0°N, 179.3°W 10 28.2 –1.3 0.11 0.10 1.35 0.66 X 78.0°N, 177.7°W 11 28.3 –1.3 0.13 0.13 5.24 2.31 XI 78.0°N, 174.0°W 11 28.6 –1.3 0.14 0.14 7.82 3.51 XII 77.2°N, 174.0°W 13 28.3 –1.2 0.13 0.13 4.64 1.30 XIII 76.4°N, 174.0°W 13 29.0 –1.5 0.17 0.16 1.00 0.48 XIV 76.4°N, 177.7°W 14 27.3 –1.3 0.13 0.13 7.28 3.46 XV 76.4°N, 179.3°W 14 28.3 –1.4 0.09 0.09 3.81 1.06 XVI 76.4°N, 176.3°W 15 26.4 –1.0 0.09 0.09 0.93 1.88 XVII 76.4°N, 172.0°W 16 26.0 –0.8 0.10 0.10 0.62 5.58 XVIII 76.3°N, 167.2°W 16 25.2 –0.6 0.07 0.07 0.23 1.01
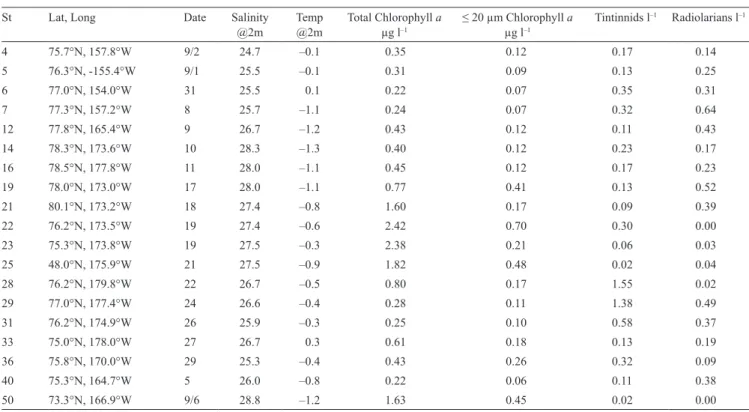
Table 2. Summary data from the August 2012 cruise. The concentrations of chlorophyll a, tintinnids, and radiolarians are values per liter,
integrated through the 0–100 m depth segment of the water column. Chlorophyll concentrations were determined in 6–8 discrete depth samples between 0 and 100 m. Organismal concentrations are from plankton net tow material obtained using a 20 µm net drawn from 100 to 0 m depth.
St Lat, Long Date Salinity
@2m Temp@2m Total Chlorophyll a µg l–1 ≤ 20 µm Chlorophyll a µg l–1 Tintinnids l
–1 Radiolarians l–1 4 75.7°N, 157.8°W 9/2 24.7 –0.1 0.35 0.12 0.17 0.14 5 76.3°N, -155.4°W 9/1 25.5 –0.1 0.31 0.09 0.13 0.25 6 77.0°N, 154.0°W 31 25.5 0.1 0.22 0.07 0.35 0.31 7 77.3°N, 157.2°W 8 25.7 –1.1 0.24 0.07 0.32 0.64 12 77.8°N, 165.4°W 9 26.7 –1.2 0.43 0.12 0.11 0.43 14 78.3°N, 173.6°W 10 28.3 –1.3 0.40 0.12 0.23 0.17 16 78.5°N, 177.8°W 11 28.0 –1.1 0.45 0.12 0.17 0.23 19 78.0°N, 173.0°W 17 28.0 –1.1 0.77 0.41 0.13 0.52 21 80.1°N, 173.2°W 18 27.4 –0.8 1.60 0.17 0.09 0.39 22 76.2°N, 173.5°W 19 27.4 –0.6 2.42 0.70 0.30 0.00 23 75.3°N, 173.8°W 19 27.5 –0.3 2.38 0.21 0.06 0.03 25 48.0°N, 175.9°W 21 27.5 –0.9 1.82 0.48 0.02 0.04 28 76.2°N, 179.8°W 22 26.7 –0.5 0.80 0.17 1.55 0.02 29 77.0°N, 177.4°W 24 26.6 –0.4 0.28 0.11 1.38 0.49 31 76.2°N, 174.9°W 26 25.9 –0.3 0.25 0.10 0.58 0.37 33 75.0°N, 178.0°W 27 26.7 0.3 0.61 0.18 0.13 0.19 36 75.8°N, 170.0°W 29 25.3 –0.4 0.43 0.26 0.32 0.09 40 75.3°N, 164.7°W 5 26.0 –0.8 0.22 0.06 0.11 0.38 50 73.3°N, 166.9°W 9/6 28.8 –1.2 1.63 0.45 0.02 0.00
Fig. 3. Spatial distribution of concentrations of chlorophyll a, tintinnid and radiolarian abundances (values per liter, integrated through the
0–100 m depth segment of the water column) in August 2011 and 2012. Station numbers are shown in Fig. 1 and exact values are given in Table 1.
10 Tintinnids (cells l –1) Chlorophyll a (µg l–1) Chlorophyll a (µg l–1) Radiolarians (cell l –1) 2011 0.1 0.01 10 2012 0.1 0.01 10 0.0–0.2 0.2–0.4 0.4–0.6 0.1 0.01 0.001 0.0001 2011 10 0.1 0.01 0.001 0.0001 2012
Fig. 4. Scatterplots of tintinnid and radiolarian abundances as a function of chlorophyll a concentration (values per liter, integrated through
the 0–100 m depth segment of the water column) in the samples from 2011 and 2012. The symbols denote different concentrations of sea ice (see Figs. 2 and 3).
significantly greater in the ice-free stations sampled in 2012 (Tables 1, 2, Fig. 5).
The tintinnid species assemblages encountered in 2011 and 2012 were nearly identical in terms of the identities of the dominant species but differed consider-ably not only in overall concentrations but also in the relative importance of individual species. Table 3 gives the overall average concentrations, the number of sta-tions at which each species was found, and the average concentrations at the stations in which it occurred. In 2011 with an extensive zone of sea ice, the most abun-dant species was the relatively large Ptychocylis
urnu-la. It was found in significantly higher concentrations in
2011 compared to 2012, at 1.4 ± 1.50 cells l–1 in 2011
and only 0.06 ± 0.039 cells l–1 in 2012. In the samples
from the ice free 2012, the small tintinnid Salpingella
faurei was the most abundant form. Concentrations
of S. faurei were not significantly different in the two years. Thus, the dominance of S. faurei in 2012 was due to the near absence of P. urnula in 2012. The two species that characterised the assemblages of 2011 and 2012 are distinct in lorica oral diameter (LOD), the an-terior open end of the lorica. The 2011 dominant, P.
ur-nula, has an LOD of ~75 µm, while the 2012 dominant, S. faurei, has an LOD of only ~10 µm (Figs. 6, 7). With
Fig. 5. Scatterplot of chlorophyll values (average integrated
con-centrations 0–100 m depth stratum), total vs. the fraction ≤ 20 µm. While the portion of the chlorophyll crop in 2012, without sea ice, was lower, the absolute concentrations of ‘nano-pico-sized’ phyto-plankton was substantially greater.
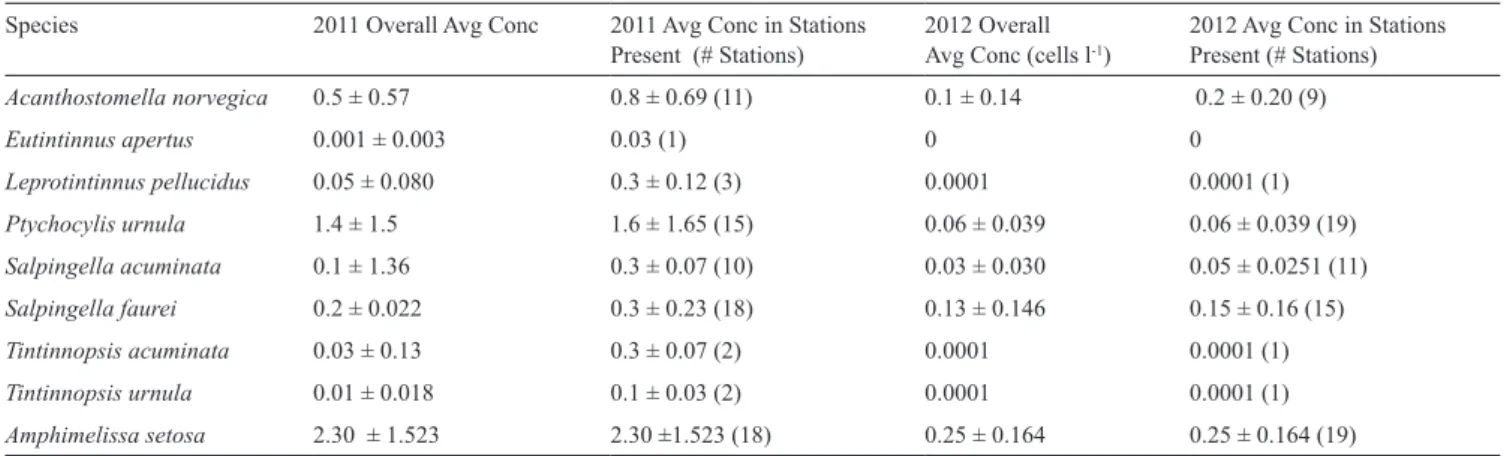
Table 3. Average concentrations (± SD) of microzooplankton species enumerated in the samples from 2011 (n = 18 stations) and 2012
(n = 19 stations).
Species 2011 Overall Avg Conc 2011 Avg Conc in Stations
Present (# Stations) 2012 OverallAvg Conc (cells l-1) 2012 Avg Conc in Stations Present (# Stations)
Acanthostomella norvegica 0.5 ± 0.57 0.8 ± 0.69 (11) 0.1 ± 0.14 0.2 ± 0.20 (9) Eutintinnus apertus 0.001 ± 0.003 0.03 (1) 0 0 Leprotintinnus pellucidus 0.05 ± 0.080 0.3 ± 0.12 (3) 0.0001 0.0001 (1) Ptychocylis urnula 1.4 ± 1.5 1.6 ± 1.65 (15) 0.06 ± 0.039 0.06 ± 0.039 (19) Salpingella acuminata 0.1 ± 1.36 0.3 ± 0.07 (10) 0.03 ± 0.030 0.05 ± 0.0251 (11) Salpingella faurei 0.2 ± 0.022 0.3 ± 0.23 (18) 0.13 ± 0.146 0.15 ± 0.16 (15) Tintinnopsis acuminata 0.03 ± 0.13 0.3 ± 0.07 (2) 0.0001 0.0001 (1) Tintinnopsis urnula 0.01 ± 0.018 0.1 ± 0.03 (2) 0.0001 0.0001 (1) Amphimelissa setosa 2.30 ± 1.523 2.30 ±1.523 (18) 0.25 ± 0.164 0.25 ± 0.164 (19) DISCUSSION
Despite remarkable differences in sea ice conditions, we found a largely similar set of species of microzoo-plankton in the Chukchi Sea in 2012, the record year of low sea ice, compared to the more normal, in terms of sea ice, summer season of 2011. The radiolarian assem-blage was dominated in both years by Amphimelissa
setosa. It is very common across the entire Arctic and
known to be the dominant species in the Chukchi Sea based on analysis of surface sediments (Bjørklund and Kruglikova 2003). The tintinnid species encountered (Table 3), similar in the two years, are quite typical for Arctic seas and form the bulk of the tintinnid communi-ties in other systems, for example, the western coast of Greenland (Levinson et al. 1999), the Greenland Sea (Boltovskoy et al. 1995) and the Barents Sea (Boltovs-koy et al. 1991, Jensen and Hansen 2000).
Overall, the tintinnid and radiolarian species found in both ice-free and more normal August conditions were largely the same set of taxa and not unexpected nor unusual. We found no evidence of incursions of forms new to the Arctic as has been reported for other areas (i.e., Bjørklund et al. 2013). What was unexpect-ed were significantly lower abundances of tintinnids and radiolarians associated with higher chlorophyll
Fig. 6. The dominant species of tintinnids and radiolaria of the Chukchi Sea: a – Ptychocylis urnula; b – Salpingella acuminata; c –
Ac-anthostomella norvegica; d – Salpingella faurei; e – Leprotintinnus pelludicus; f – Tintinnopsis acuminata; g – Amphimelissa setosa. The roman numerals denote the rank abundance of the top 4 species in the 2011 samples and the arabic numerals the rank abundance of the top 4 species in the 2012 samples. Note that the difference in the morphologies of the most abundant species in 2011 ‘I’ , P. urnula compared to the dominant species in samples from the ice free year of 2012 “1”, S. faurei. See Fig. 7 for the relative abundance of all the tintinnid species.
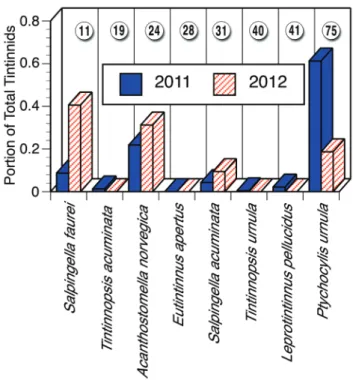
Fig. 7. Relative abundances (portion of the overall population) of
each tintinnid species found in August 2011 with extensive sea ice and August 2012 with no sea ice. The numbers in circles show the lorica oral diameter in µm of the species. Note that the 2011 as-semblage was dominated by the large-mouthed Ptychocylis urnula (LOD = 75 µm) and 2012 assemblage was dominated by the small-mouthed Salpingella faurei (LOD = 11 µm).
concentrations of 2012, the low sea ice year, compared to the preceding year of significant sea ice presence and lower chlorophyll concentrations (Figs. 2, 3, 5, Tables 1, 2). The differences of about an order of magnitude in abundance were accompanied by differences in the relative importance of tintinnid species of distinct morphologies.
The 2011 tintinnid assemblage, with relatively high abundances, was dominated by the large-mouthed (LOD = 75 µm) Ptychocylis urnula. The sparse 2012 population was dominated by the small-mouthed (LOD = 11 µm) Salpingella faurei. Given that tintinnid spe-cies feed most efficiently on prey about 25% of their LOD (Dolan 2010, Montagnes 2013), these differences in dominant species suggest that most of the tintinnid assemblage was feeding on prey of about 20 µm in size in 2011 and prey of about 3 µm in size in 2012. It should be recalled that tintinnids are usually a small part of the microzooplankton and so are unlikely to exert a signifi-cant impact on the prey they exploit; rather, the size
of the tintinnid assemblage, in terms of the identity of the dominant morpho-types (Dolan et al. 2013).
It is tempting to link the higher microzooplankon concentrations of 2011, and larger on average larger tintinnid forms, to the presence of a distinct phyto-plankton assemblages associated with summer sea ice. Unfortunately, we have no data other than chlorophyll concentrations concerning the phytoplankton. The con-centrations of chlorophyll a in the ≤ 20 µm size fraction, presumably corresponding with prey exploited by tin-tinnids and radiolarians, were significantly higher in the sea ice-free sampling of 2012 compared to the preced-ing year, respectively 0.2 ± 0.17 µg l–1 and 0.1 ± 0.10 µg
l–1, as well as concentrations of total chlorophyll. Thus,
the low abundances of tintinnids and radiolarians ap-pear paradoxical. Studies in other systems have shown that high concentrations of tintinnids are indeed associ-ated with the presence of sea ice, corresponding with diatoms dominating the phytoplankton. Bolotovskoy et
al. (1995) found peak concentrations of total tintinnids
(dominated by Ptychocylis and Acanthostomella also found in the Chukchi Sea) associated with the ice edge in the Greenland Sea in spring. However, while the sta-tions in 2011 without sea ice (Fig. 2: I, II, III, IV, XVIII) did have lower concentrations of tintinnids, the stations did not clearly differ from those with sea ice in terms of species composition, nor the identity of the dominant species (data not shown) which argues against a distinct phytoplankton assemblages in the ice-free, compared to sea ice stations. Furthermore, the concentrations of to-tal chlorophyll and ≤ 20 µm showed no consistent dif-ferences in the two sets of 2011 stations (Table 1). The radiolarian fauna provide no clear indications of pos-sible differences in microzooplankton prey abundanc-es or composition as very little is known concerning their diet. The dominant species, Amphimelisa setosa, is a nassellarian whose skeleton is composed of spicu-lar elements and two chambers, a morphology associ-ated with species who feed using a sort of an axopo-dial membrane to capture microflagellates and bacteria (Matsuoka 2007).
Qualitative differences in the compostion of the phytoplankton, not evident based on chlorophyll a con-centrations, might explain the lower abundances of tin-tinnids and radiolarians we found comparing 2011 and 2012. However, an alternative (but not exclusive) expla-nation is a difference in predation pressure. We found largely similar declines in the concentrations of
tintin-nids and radiolarians comparing 2011 to 2012, of about an order of magnitude. These similar declines were un-expected as there is no reason a priori to assume that tintinnids and radiolarians should show similar trends and there was no correlation between the abundances among stations within either year (data not shown). To our knowledge, the only existing data on both tintinnids and radiolarians in an Arctic Sea or sub-Arctic sea is that of Bathman et al. (1990) based on the sedimenta-tion of material from a site in the Norwegian Sea. The data show distinct temporal trends of tintinnids and ra-diolarians in the summer (Fig. 8) and have been taken as evidence that the two assemblages of microplankters have distinct patterns of seasonal abundance (Bathman
et al. 1990, Wassmann et al. 1991).
The lower abundances of both tintinnids and radio-larians in 2012, and in similar proportions of about an order of magnitude relative to 2011, might have been due to a higher predation pressure on microzooplank-ton. We have no data to directly evaluate this possibil-ity, only indications from other studies. A comprehen-sive study of mesozooplankton grazing conducted by Campbell et al. (2009) included experiments run in August in our study area in the years 2002 and 2004, years in which sea ice cover was similar to that found
in 2011 (Fig. 1). Predation on microzooplankton was examined, and in most experiments a dietary preference for microzooplankton was documented. However, ag-gregate grazing rates gave estimates of impact equal to clearing only about 2–10% of the water column per day (Campbell et al. 2009, Table 4). If microzooplankters grow very slowly in polar waters as suggested by Rose and Caron (2007) and Rose et al. (2013), such low ag-gregate clearance rates might have a considerable im-pact. However, there seems to be no reason to assume that growth rates are low in arctic waters. Experimental data shows that tintinnids at least can grow at high rates (1.7–0.44 d–1) in the marginal ice zone of the central
Barents Sea (Jensen and Hansen 2000). Consequently, it is likely that mesozooplankton in ‘normal’ sea ice years is unlikely to exert a strong control on microzoo-plankton. However, low sea ice years might be distinct-ly different. A recent study reported that in Judistinct-ly–August of 2007, the previous low sea ice year, copepod abun-dances were about twice that of the more normal years of 1991, 1992, and 2008; furthermore, sea ice reduction appears to correspond with the presence of large Pacific species (Matsuno et al. 2011).
It appears possible that top-down control might account for the low concentrations of tintinnids and
1-Jun Tintinnids Radiolarians 10 Flux (10 3 cells m 2 d –1) 100 1000
Norwegian Sea Summer 1986 Norwegian Sea Summer 1987
1-Jul 1-Aug 1-Sep 1-Oct 1-Jun 1-Jul 1-Aug 1-Sep 1-Oct
Fig. 8. Sedimentation rates of tintinnid loricas and radiolarian skeletons at 500 m on the Voering Plateau in the Norwegian Sea based on
data from Bathman et al. (1990). Note that the flux of tintinnids and radiolarians, presumably reflecting concentrations of living cells in the surface waters, appear distinct. The apparent distinct temporal trends of tintinnids and radiolarians in the Norwegian Sea contrasts with the Chukchi Sea data showing largely parallel trends in concentrations (Fig. 3).
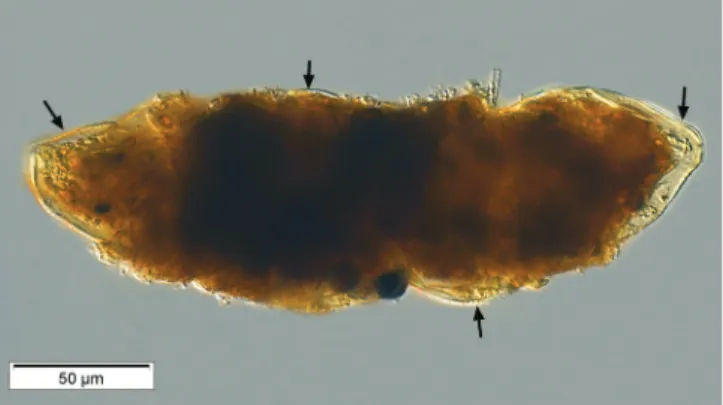
radiolarians we found in the record year of 2012 com-pared to 2011 with sea ice conditions more like the past years. Perhaps co-incidently, in a 2012 sample we did find direct evidence of predation on Ptychocylis
urnula: a fecal pellet identified by J. T. Turner as
pos-sibly from a large calanoid copepod which contained multiple loricas (Fig. 9). Similar to what we describe for 2012, apparently anomously low abundances of large protistan microplankters despite high prey con-centrations, was also noted in the Norwegian Shelf waters in spring and summer samplings in 1994 and was attributed to top-down control on large protistan grazers (Verity et al. 1999). It is worth recalling that while top-down control of tintinids and radiolarians would likely extend to the entire microzooplankton community, we have no evidence that the abundance trends we documented do indeed extend across all mi-crozooplankton taxa.
CONCLUSIONS
We found differences in the microzooplankton com-munities of the contrasting years, the differences were in the form of overall concentrations as well as relative abundances of certain species, with low abundances in the year of low sea ice. The differences we documented may have been related to the composition of the sum-mer phytoplankton bloom. The large differences in the size of the dominant tintinnid species suggests a dif-ference in the size-spectrum of phytoplankton prey. Fig. 9. Fecal pellet containing loricas of Ptychocylis urnula (arrows)
found in material from the 2012 Station 40. The pellet is possibly from a large calanoid copepod according to J. T. Turner (University of Massachusetts Dartmouth).
ferent prey, suggests a top-down control of microzoo-plankton may have occurred in the record low sea ice summer of 2012. Our data concern only the tintinnids and radiolarians. However, the trends documented do support the notion that the marked changes which have been reported in the abundance and composition of the mesozooplankton community of the Chukchi Sea asso-ciated with sea ice declines (Matsuno et al. 2011) likely extend to the microzooplankton.
Acknowledgements. The comments and suggestions of Ev Sherr,
Dave Montagnes, and 2 reviewers on previous versions led to sig-nificant improvements in the paper. Financial support for this work was provided by the CNRS, the Université Paris 6 and Korea Polar Research Institute, KIOST, through project PM12020. We thank Mi Sa Jeon for her great help with sampling and data collection. The samples for 2011 were obtained through her efforts.
REFERENCES
Aberle N., Bauer B., Lewandowska A., Gaedke U., Sommer U. (2012) Warming induces shifts in microzooplankton phenology and reduces time lags between phytoplankton and protozoan production. Mar. Biol. 159: 2441–2453
Bathmann U. V., Peinert R., Noji T. T., Bodungen B. V. (1990) Pe-lagic origin and fate of sedimenting particles in the Norwegian Sea. Prog. Oceanogr. 24: 117–125
Bjørklund K. R., Kruglikova S. B. (2003) Polycystine radiolarians in surface sediments in the Arctic Ocean basins and marginal seas. Mar. Micropaleo. 49: 231–273
Bjørklund K. R., Kruglikova S. B., Andersen O. R. (2013) Modern incursions of tropical radiolaria into the Arctic Ocean. J. Micro-paleo. 31: 139–158
Boltovskoy D., Vivequin S. M., Swanberg N. R. (1991) Vertical dis-tribution of tintinnids and associated microplankton in the upper layer of the Barents Sea. Sarsia 76: 141–151
Boltovskoy D., Vivequin S. M., Swanberg N. R. (1995) Tintinnids and other micrplankton from the Greenland Sea: Abundance and distribution in the marginal ice zone (May–June 1989). P.S.Z.N.I. Mar. Ecol. 16: 117–131
Calbet A., Landry M. R. (2004) Phytoplankton growth, microzoo-plankton grazing, and carbon cycling in marine systems. Lim-nol. Oceanogr. 40: 51–57
Campbel R. G., Sherr E. B., Ashjian C. J., Plourde S., Sherr B. F., Hil V., Stockwell D. A. (2009) Mesozooplankton prey prefer-ence and grazing impact in the western Arctic Ocean. Deep-Sea Res. II 56: 1274–1289
Caron D. A., Hutchins D. A. (2013) The effects of changing climate on microzooplankton grazing and community structure: drivers, predictions and knowledge gaps. J. Plank. Res. 35: 235–252 Chen B., Landry M. R., Huang B., Liu H. (2012) Does warming
enhance the effect of microzooplankton grazing on marine phy-toplankton in the ocean? Limnol. Oceanogr. 57: 519–526 Comeau A. M., Li W. K. W., Tremblay J.-E., Carmack E. C.,
Love-joy C. (2011). Arctic ocean microbial community structure be-fore and after the 2007 record sea ice minimum. PLoS ONE 6: e27492
Dolan J. R. (2010) Morphology and ecology in tintinnid ciliates of the marine plankton: Correlates of lorica dimensions. Acta Pro-tozool. 49: 235–344
Dolan J. R., Pierce R. W. (2013) Diversity and distributions of tin-tinnid ciliates. In: Biology and ecology of tintin-tinnid ciliates: Models for marine plankton, (Eds. J .R. Dolan, D. J. S. Mon-tagnes, S. Agatha, D. W. Coats, D. K. Stoecker). Wiley–Black-well, Oxford, 214–243
Dolan J. R., Landry M. R., Ritchie M. E. (2013) The species-rich assemblages of tintinnids (marine planktonic protists) are struc-tured by mouth size. ISME J 7: in press
Doney S. C., Ruckelshaus M., Duffy J. E., Barry J. P., Chan F., English C. A., Galindo H. M., Grebmeier J. M., Hollowed A. B., Knowlton N., Polovina J., Rabalais N. N., Sydeman W. J., Tal-ley L. D. (2012) Climate change impacts on marine ecosystems. Ann. Rev. Mar. Sci. 4: 11–37
Grebmeier J. M. (2012) Shifting patterns of life in the Pacific Arctic and Sub-Arctic seas. Ann. Rev. Mar. Sci. 4: 63–78
Hunt G. L., Coyle K. O., Eisner L. B., Farley E. V., Heintz R. A., Mueter F., Napp J. M., Overland J. E., Ressler P. H., Salo S., Stabeno P. J. (2011) Climate impacts on eastern Bering Sea foodwebs: a synthesis of new data and an assessment of the Os-cillating Control Hypothesis. ICES J. Mar. Sci. 68: 1230–1243 Jensen F. and Hansen B. W. (2000) Ciliates and heterotrophic
dino-flagellates in the marginal ice zone of the central Barents Sea during spring. J. Mar. Biol. Assoc. UK. 80: 45–54
Kinnard C., Zdanowicz C. M., Fisher D. A., Isaksson E., de Vernat A., Thompson L. G. (2011) Reconstructed changes in Arctic sea ice cover over the past 1,450 years. Nature 479: 509–513 Kofoid C. A. and Campbell A. S. (1929) A Conspectus of the
Ma-rine and Freshwater Ciliata Belonging to the suborder Tintin-noinea, with Despcriptions of New Species Principally from the Agassiz Expedition to the Eastern Tropical Pacific 1904–1905. University of California Publications in Zoology 34: 1–403 Kofoid C. A., Campbell A. S. (1939) The Tintinnoinea of the
East-ern Tropical Pacific. Bulletin of the Museum of Comparative Zoology at Harvard College 84: 1–473
Lee S. H., Whitledge T. E., Kang S. H. (2007) Recent carbon and nitrogen uptake rates of phytoplankton in Bering Strait and the Chukchi Sea. Cont. Shelf Res. 27: 2231–2249
Levinsen H., Nielsen T. G., Hansen B. W. (1999) Plankton commu-nity structure and carbon cycling on the western coast of Green-land during the stratified summer situation. II. Heterotrotrophic dinoflagellates and ciliates. Aquat. Microb. Ecol. 16: 217–232 Matsuno K., Yamaguchi A., Hirawake T., Imai I. (2011) Year to year
changes of the mesozooplankton community in the Chukchi Sea during summers of 1991, 1992, and 2007, 2008. Pol. Biol. 34: 1349–1360
Matsuoka A. (2007) Living radiolarian feeding mechanisms: New light on past marine ecosystems. Swiss J. Geosci. 100: 273–279 Michel C., Bluhm B., Gallucci V., Gaston A. J., Gordillo F. J. L.,
Gradinger R., Hopcroft R., Jensen N., Mustonen T., Niemi A., Nielsen T. G. (2012) Biodiversity of arctic marine ecosystems and response to climate change. Biodiversity 13: 200–214 Montagnes D. J. S. (2013) Ecophysiology and behaviour of
tintin-nids. In: Biology and Ecology of Tintinnid Ciliates: Models for Marine Plankton, (Eds. J. R. Dolan, D. J. S. Montagnes, S. Ag-atha, D. W. Coats, D. K. Stoecker). Wiley–Blackwell, Oxford, 86–122
Montagnes D. J. S., Morgan G., Bissinger J. E., Atkinson D., Weisse T. (2008) Short-term temperature change may impact
freshwa-ter carbon flux: A microbial perspective. Glob. Change Biol. 14: 2823–2838
Montagnes D. J. S., Dower J. F., Figueiredo G. M. (2010) The pro-tozooplankton–ichthyoplankton trophic link: An overlooked as-pect of aquatic food webs. J. Eukaryot. Microbiol. 57: 223–228 Polyak L., Best K. M., Crawford K. A., Council E. A., St-Onge G.
(2013) Quaternary history of sea ice in the western Arctic based on foraminifera? Quaternary Sci. Rev. 73: in press
Rose J. M., Caron D. A. (2007) Does low temperature constrain the growth rate of heterotrophic protists? Evidence and implica-tions for algal blooms in cold waters. Limnol. Oceanogr. 52: 886–895
Rose J. M., Fitzpatrick E., Wang A., Gast R. J., Caron D. A. (2013) Low temperature constrains growth rates but not short-term in-gestion rates of Antarctic ciliates. Pol. Biol. 36: 645–659 Rubao J., Jin M., Varp Ø. (2013) Sea ice phenology and timing of
primary production pulses in the Arctic Ocean. Glob. Chang Biol. 19: in press
Solignac S., Seidenkrantz M.-S., Jessen C., Kuijpers A., Gunvald A. K., Olsen J. (2011) Late-holocene sea surface conditions off-shore Newfoundland based on dinoflagellate cysts. Holocene
21: 539–552
Sherr E. B., Sherr B. F., Hartz A. J. (2009) Microzooplankton graz-ing impact in the Western Arctic Ocean. Deep-Sea Res. II 56: 1264–1273
Sherr E. B., Sherr B. F., Ross C. (2013) Microzooplankton grazing impact in the Bering Sea during spring sea ice conditions. Deep-Sea Res. II, in press
Vazquez-Dominguez E., Vaqué D. Gasol J. P. (2012) Temperature effects on the hetertrophic bacteria, heterotrophic nanoflagel-lates, and the microbial top predators of the N.W. Mediterra-nean. Aquat. Microb. Ecol. 67: 107–121
Verity P. G., Wassmann P., Ratkova T. N., Andreassen I. J., Nordby E. (1999) Season patterns in composition and biomass of auto-troophic and heterotrophic nano- and microplankton communi-ties on the north Norwegian shelf. Sarsia 84: 265–277 Wassman P. (2011) Arctic marine ecosystems in an era of rapid
cli-mate change. Prog. Oceanogr. 90: 1–17
Wassmann P., Peinert R., Smetacek V. (1991) Patterns of production and sedimentation in the boreal and polar Northeast Atlantic. Pol. Res. 10: 209–228
Wang M., Overland J. E. (2009) An sea ice free summer Arctic within 30 years? Geophys. Res. Ltrs 36: L07502
Wang M., Overland J. E., Stabeno P. (2012) Future climate of the Bering and Chukchi Seas projected by global climate models. Deep-Sea Res. II 65–70: 46–57
Weckström K., Massé G., Collinsn L. G., Hanhijärvi S., Boulou-bassi I., Sicre M.-A., Seidenkrantz M.-S., Schmidt S., Andersen T. J., Andersen M. L., Hill B., Kuijpers A. (2013) Evaluation of the sea ice proxy IP25 against observational and diatom proxy data in the SW Labrador Sea. Quaternary Sci. Rev. 73: in press Zhang J., Spitz Y. H., Steele M., Ashjian C., Campbell R., Berline
L., Matrai P. (2010) Modeling the impact of declining sea ice on the Arctic marine planktonic ecosystem. J. Geophys. Res.
11: C10015
Received on 28th May, 2013; revised on 15th June, 2013; accepted