HAL Id: hal-00304890
https://hal.archives-ouvertes.fr/hal-00304890
Submitted on 1 Jan 2003HAL is a multi-disciplinary open access archive for the deposit and dissemination of sci-entific research documents, whether they are pub-lished or not. The documents may come from teaching and research institutions in France or abroad, or from public or private research centers.
L’archive ouverte pluridisciplinaire HAL, est destinée au dépôt et à la diffusion de documents scientifiques de niveau recherche, publiés ou non, émanant des établissements d’enseignement et de recherche français ou étrangers, des laboratoires publics ou privés.
predicted by the MAGIC model
R. F. Wright, B. J. Cosby
To cite this version:
R. F. Wright, B. J. Cosby. Future recovery of acidified lakes in southern Norway predicted by the MAGIC model. Hydrology and Earth System Sciences Discussions, European Geosciences Union, 2003, 7 (4), pp.467-483. �hal-00304890�
Future recovery of acidified lakes in southern Norway predicted
by the MAGIC model
Richard F. Wright
1and B.J. Cosby
21Norwegian Institute for Water Research, P.O. Box 173 Kjelsås, N-0411 Oslo, Norway 2Department of Environmental Sciences, University of Virginia, Charlottesville, VA 22903, USA
E-mail for corresponding author: richard.wright@niva.no
Abstract
The acidification model MAGIC was used to predict recovery of small lakes in southernmost Norway to future reduction of acid deposition. A set of 60 small headwater lakes was sampled annually from either 1986 (35 lakes) or 1995 (25 lakes). Future acid deposition was assumed to follow implementation of current agreed legislation, including the Gothenburg protocol. Three scenarios of future N retention were used. Calibration of the sites to the observed time trends (19901999) as well as to one point in time considerably increased the robustness of the predictions. The modelled decline in SO4* concentrations in the lakes over the period 19862001 matched the observed decline closely. This strongly suggests that soil processes such as SO4 adsorption/desorption and S reduction/oxidation do not delay the response of runoff by more than a few years. The slope of time trends in ANC over the period of observations was less steep than that observed, perhaps because the entire soil column does not interact actively with the soilwater that emerges as runoff. The lakes showed widely differing time trends in NO3 concentrations over the period 19862000. The observed trends were not simulated by any of the three N scenarios. A model based on the C/ N ratio in soil was insufficient to account for N retention and leaching at these sites. The large differences in modelled NO3, however, produced only minor differences in ANC between the three scenarios. In the year 2050, the difference was only about 5 µeq l-1 . Future climate change entailing warming and increased precipitation could also increase NO3 loss to surface waters. SO4* concentrations in the lakes were predicted to decrease in parallel with the future decreases in S deposition. Fully 80% of the expected decline to year 2025, however, had already occurred by the year 2000. Similarly, ANC concentrations were predicted to increase in the future, but again about 67% of the expected change has already occurred over the past 20 years. The recovery of ANC was predicted to be incomplete. Even after the CLE scenario (for future acid deposition) is implemented, the chemical conditions in about one-third of the lakes were predicted to be insufficient to support trout populations in the future. Thus, additional measures will be required if these lakes are to be restored.
Keywords: acid deposition, lakes, model, Norway, recovery
Introduction
Decades of acid deposition in southernmost Norway have resulted in widespread acidification of surface waters with severe consequences for fish populations (Overrein et al., 1980). Acid deposition peaked in the 1970s. International agreements under the United Nations Economic Council for Europe (UN-ECE) Convention on Long-Range Transboundary Air Pollution (LTRAP) to reduce emissions of sulphur and nitrogen compounds (Bull et al., 2001) have resulted in 6070% reduction in S and 20% reduction in N deposition during the period 19802000 (Skjelkvåle et al., 2001b).
Lakes in southernmost Norway have begun to recover
from acidification as a result of reductions in S and N deposition (Skjelkvåle et al., 2001a, Skjelkvåle et al., 1998). Sulphate (SO4) concentrations have declined, acid
neutralising capacity (ANC) and pH have increased and concentrations of labile inorganic aluminium (Aln+) have
declined. The waters have become less toxic to fish and other aquatic organisms.
Additional recovery can be expected in the future as new reductions in emissions of acidifying components come into effect, in compliance with the 1999 Gothenburg protocol to the LTRAP convention and other agreed international and national legislation (here termed the CLE scenario).
deposition is characterised both by substantial lag times and by hysteresis; the path of recovery is not the reverse of the path of acidification. Prediction of future acidification status and hence of fish populations thus requires use of dynamic process-oriented acidification models. MAGIC (Model For Acidification of Groundwater In Catchments) is such a tool (Cosby et al., 1985a,b, 2001).
MAGIC can be used to predict recovery of small lakes in southernmost Norway to future reductions of acid deposition. Observations are available for a set of 60 small headwater lakes sampled annually since 1986 (35 lakes) or 1995 (25 lakes) as part of the Norwegian national monitoring programme for long-range transported polluted air and precipitation (SFT, 2002). Twenty-six of the lakes were also sampled once in 1974 or 1975 (Wright and Henriksen, 1978; Wright and Snekvik, 1978). The trends in water chemistry in the 1990s in these lakes together with similar lakes in Sweden and Finland have been assessed by Skjelkvåle et
al. (2001b).
MAGIC has been used previously to assess past and predict future trends in acidification of lakes in Norway. Wright et al. (1991) used MAGIC and a Monte-Carlo procedure with water chemistry data from a 1974 survey and 1986 re-survey of 180 lakes in southernmost Norway to predict regional acidification in response to several scenarios of future acid deposition. Cosby and Wright (1998) used these data together with a second resurvey in 1995 to assess regional acidification using the Monte-Carlo as well as a site-specific procedure.
Here the new MAGIC7 version with nitrogen dynamics was used together with the latest scenario for future acid deposition (the CLE scenario) to predict future acidification of lakes in southernmost Norway given two alternative paths for nitrogen retention and loss. The objective was to estimate the future recovery of acidified lakes. This work was part of the European project RECOVER:2010, a project whose goals were to assess trends in recovery of surface waters to date and to predict future recovery (Ferrier et al., 2001).
Materials and methods
MAGIC MODELMAGIC is a lumped-parameter model of intermediate complexity, developed to predict the long-term effects of acidic deposition on surface water chemistry (Cosby et al., 1985a,b,2001). The model simulates soil solution and surface water chemistry to predict average concentrations of the major ions. MAGIC calculates for each time step (in this case yearly) the concentrations of major ions on the assumption of simultaneous reactions involving sulphate
adsorption, cation exchange, dissolution-precipitation-speciation of aluminium and dissolution-dissolution-precipitation-speciation of inorganic and organic carbon. MAGIC accounts for the mass balance of major ions in the soil by book-keeping the fluxes from atmospheric inputs, chemical weathering, net uptake in biomass and loss to runoff.
Data inputs required for calibration of MAGIC comprise lake and catchment characteristics, soil chemical and physical characteristics, input and output fluxes for water and major ions, and net uptake of base cations by vegetation.
LAKE DATA
The 60 lakes in the study are a subset of 200 lakes from the four most affected counties in southern Norway (Telemark, Aust-Adger, Vest-Agder, Rogaland). These lakes have been sampled once annually since 1986 or 1995. The 200 lakes are in turn a subset of lakes sampled in the national 1000-lake surveys of 1986 (Henriksen et al., 1988) and 1995 (Skjelkvåle et al., 1996, 1998). The data comprise part of the Norwegian monitoring programme for long-range transported polluted air and precipitation (SFT, 2002).
The lakes are acid-sensitive, headwater lakes on granitic or gneissic bedrock with negligible local pollution sources. Lake water samples were collected annually during the autumn turnover period from the outlet or surface water and analysed by standard methods at the Norwegian Institute for Water Research (NIVA). Data used here include concentrations of major ions, Al-species, and total organic carbon (TOC). In this application, MAGIC was calibrated to mean values for the years 199597.
Average annual discharge at each lake was taken from maps of specific runoff for the standard period 19601990 prepared by the Norwegian Water Resources and Electricity Board. Lake area and catchment area were obtained by planimetry from 1:50000 topographic maps. These data are in NIVAs 1500-lake database (Skjelkvåle et al., 1996). For lack of lake-specific data, annual water retention time in the lakes was assumed to be 0.5 years, a characteristic value for small lakes in Norway.
DEPOSITION DATA
Atmospheric deposition is measured daily or weekly by the Norwegian Institute for Air research (NILU) at a network of stations covering the whole of Norway, as part of the Norwegian national monitoring programme for long-range transported polluted air and precipitation (Aas et al., 2002). Although these data give a good measure of the relative amounts and trends in deposition, they do not give representative deposition at each individual lake and its
catchment because of local variations caused by orographic effects, as well as variations in vegetation and surface roughness that affect amounts of dry and occult deposition. For this modelling study, therefore, deposition was estimated for the calibration period (199597) from lake-water chemistry and average specific runoff at each lake. The procedure estimated firstly the deposition of ions derived from sea salts and then the deposition of the pollutant fractions of SO4, nitrate (NO3) and ammonium (NH4).
For sea salts, the deposition of chloride (Cl) was assumed equal to the flux of Cl from the lake:
Cldep meq m2yr1 = [Cllake] µeq l1 * Q m yr1 (1)
where Q is the specific discharge from the lake outlet. This assumed that all Cl in runoff is deposited from the atmosphere, and that there were no sources or sinks for Cl in the catchment. Next, the deposition of the marine fractions of Ca, Mg, Na, K, and SO4 were calculated from the Cl
deposition, assuming the ratio of each is the same as in seawater.
marine Cadep = 0.037*Cldep (2)
marine Mgdep = 0.196*Cldep (3)
marine Nadep = 0.856*Cldep (4)
marine Kdep = 0.018*Cldep (5)
marine SO4dep = 0.103*Cldep (6)
Non-marine deposition of Ca, Mg, Na, and K was assumed to be zero. To the extent that they were non-zero but constant over time, they were automatically incorporated as inputs into the estimated weathering rate as part of the calibration procedure.
Next, the deposition of non-marine SO4 was calculated.
The flux of SO4 from the lake (concentration times
discharge) (Eqn. 7) comprised SO4 from four sources:
anthropogenic-derived SO4 in deposition, atmospheric
deposition of marine SO4 (as calculated by Eqn. 6 above),
natural background deposition of non-marine SO4, and
weathering of SO4 from soils and bedrock (Eqn. 8).
SO4dep meq m2yr = [SO4lake] µeq l1 * Q m yr1 (7)
SO4dep = marine SO4dep + non-marine background SO4dep
+ weathering SO4 + pollutant SO4dep. (8)
Brakke et al. (1989) and later Henriksen and Posch (2001)
have estimated background SO4 concentrations in
Norwegian lakes, based on linear regression of SO4* on BC*
concentrations in lakes in parts of Norway receiving very low levels of acid deposition:
[SO4*] µeq l1 = a + b [BC*] (9)
where the intercept a gives the natural atmospheric background and the slope b gives the weathering, BC is the equivalent sum of concentrations of base cations (principally calcium and magnesium) and asterisks denote the non-marine fraction. For Norwegian lakes the natural atmospheric background (intercept a) was estimated as 15 µeq l1 by Brakke et al. (1989) based on data from the
mid-1980s, but by 1995 had decreased to 8 µeq l-1 (Henriksen
and Posch, 2001). This suggests strongly that areas of northwestern and northern Norway receive small but significant acid deposition, and that this deposition has decreased in parallel with decreases in southern Norway and elsewhere in Europe. The actual pristine natural background deposition of non-marine SO4 is thus probably
even lower. EMEP has estimated the deposition of S in southernmost Norway in the absence of any anthropogenic emissions in Europe to be 50 mgS m2yr (3 meq m2yr).
This is equivalent to 3 µeq l1 SO
4 in 1000 mm precipitation.
This value was used for the natural background deposition of non-marine SO4.
Henriksen and Posch (2001) give 0.160.17 for the slope b in Eqn. (9), an estimate of the weathering SO4 . The value
of 0.17 was used here. Finally, deposition of pollutant SO4
was obtained by difference from Eqn. (8).
This procedure assumed that for the calibration period (199597), all SO4 in runoff came in atmospheric deposition
and weathering; thus, there were no other sources or sinks for SO4 in the catchment. In fact, soil processes such as
sulphate adsorption/desorption and sulphur reduction/ oxidation operate on time scales of years-to-decades in retaining and releasing SO4, but these were assumed to be
negligible (or at steady-state) for the calibration period 199597.
Finally, the deposition of NO3 and NH4 was estimated
from the non-marine SO4 deposition times the ratio of NO3
and NH4 to SO4 in precipitation at the nearest NILU station.
MAGIC requires information for the historical and future deposition rates of those ions whose deposition changes over time (Fig. 1). It was assumed that only the pollutants SO4*,
NO3 and NH4 changed over time. For SO4*the historical
deposition was scaled to the estimated deposition history for the EMEP square in southernmost Norway (the Birkenes square) as given by Mylona (1996) and modified by Schöpp
NH4 was scaled to the estimated deposition history for
Europe given by Simpson et al. (1997) and modified by Schöpp et al. (2003). Future deposition under the CLE scenario (current legislation) was taken from estimates by IIASA and EMEP (Schöpp et al., 2003).
SOIL DATA
Soil data came from various research projects and monitoring programmes. Forest soils data came from national surveys of soils in productive forests conducted at a 9 × 9 km grid by the Norwegian Institute for Soil and Land Inventory (NIJOS) (Esser, 1994; Esser and Nyborg, 1992). Data for non-forests (mostly upland heathlands) came from a soil survey of heathlands in Rogaland and Vest-Agder counties (Wright et al., 1999) and from calibrated catchments in the Norwegian monitoring programme (SFT, 2002). For each catchment, the soil data from the nearest forest and non-forest site were used, weighted by the fraction of forest and non-forested area. The data were then aggregated to obtain a single set of values for each lake catchment.
NET UPTAKE
The mass balance for the terrestrial catchment requires assessment of the net removal of base cations from the catchment through forest harvesting. This removal is equivalent to net uptake in the vegetation. Here, it was assumed that over the long-term the removal was proportional to forest productivity. Data for productivity came from NIJOS forest inventory and estimated net uptake of cations from Frogner et al. (1994). These were scaled to each lake catchment based on the fraction of forest in the catchment.
FIXED PARAMETERS
In addition to the input data for deposition and soil MAGIC requires several fixed parameters that are used here as defaults for all sites. For soil, these were porosity, aluminium solubility, temperature, partial pressure of carbon dioxide in soil air, total concentration of organic acids and pK values, and two parameters for sulphate adsorption (maximum capacity and half-saturation constant). For water these were aluminium solubility, temperature, partial pressure of carbon dioxide, and pK values of organic acids (Table 1). These default values came largely from detailed site-specific MAGIC applications in Norway for which more extensive data are available, such as the data from the RAIN and CLIMEX projects (Wright et al., 1998). The pKs for a tri-protic organic acid came from a study of organic acids in a variety of surface waters in Europe (Hruska et al., 2003).
0.0 0.5 1.0 1.5 2.0 2.5 1860 1880 1900 1920 1940 1960 1980 2000 2020 2040 SO4 NH4 NO3
Fig. 1. Historical and future deposition of non-marine SO4, NO3 and NH4 used in MAGIC applications for southernmost Norway. The curves were scaled to the calibration period 1995-97 (from Mylona, 1996 and Simpson et al., 1997 as modified by Schöpp et al., 2003).
Table 1. Fixed parameters (defaults) used in calibration of MAGIC.
Notation units value
SOILPARAMETERS
Porosity P % 50
Solubility Al(OH)3 KAl log10 8.1
Temperature T oC 9.0
CO2 partial pressure PCO2 atm 0.5
Total organic acid H3A mmol m-3 100
pK1 pKOA1 -log10 3.04
pK2 pKOA2 -log10 4.51
pK3 pKOA3 -log10 6.46
SO4 ads. Half-sat. C½ meq m-3 100
SO4 ads. Max-capacity Emx meq kg-1 1.0
WATERPARAMETERS
solubility Al(OH)3 KAl log10 9.1
Temperature T oC 5.0
CO2 partial pressure PCO2 % atm 0.05
pK1 pKOA1 -log10 3.04
pK2 pKOA2 -log10 4.51
pK3 pKOA3 -log10 6.46
NITROGEN DYNAMICS
The newest version of MAGIC (7) includes several processes for nitrogen retention and loss in the terrestrial catchment and lake itself (Cosby et al., 2001). Inasmuch as the actual history of overall N retention as well as the future N retention are quite uncertain, three possible N scenarios were chosen and MAGIC was calibrated; thus, three sets of hindcast and forecast lake chemistry were obtained.
assumptions:
1. 100% nitrification in both the soil and lake. This assumption was based on the observation that concentrations of NH4 in runoff and lakewater are
negligible, seldom above 1-2 µeql-1.
2. Loss of NO3 in the lake (per m2 lake surface) is
proportional to concentration:
sedimentation rate meq m-2yr = velocity m yr-1 *
concentration µeq l-1 (10)
This assumption was based on input-output studies summarised by Kaste and Dillon (in press) who suggest a velocity of 5 m yr1 for Norwegian lakes.
The three scenarios thus differed in the description of N retention in the soil.
Scenario 1. Constant % N retention. The simplest
assumption for N retention is that the fraction of incoming N retained is constant over time. Thus as N deposition declines in the future, the amount of N released in runoff from the soil will decline proportionally. The magnitude of this fraction was calculated from the input-output mass budget for the calibration period 199597.
For the lake, the mass budget is
Nout,l = Nrunoff + Ndep,l - Nret,l (11)
where Nout,l is the flux of NO3 from the lake (concentration
times discharge), Nrunoff is the flux of NO3 from the
catchment, Ndep,l is the NO3+NH4 deposited directly on the
lake surface, Nret,l is the retention of N in the lake (per m2
lake surface) given by Eqn. (10), and units are meq m-2yr.
For the catchment the mass budget is
Nrunoff = Ndep,s - Nret,s (12)
where Ndep,s is the NO3+NH4 deposition on the catchment,
Nret,s is the N retention in the soil and units are meq m-2yr
(per m2 terrestrial surface). The fraction of incoming N
retained in the soil is thus
fraction retained = 1 (Nrunoff / Ndep,s) (13)
This value was calculated for each lake-catchment system for the calibration period 199597, and held constant over time for the constant % retention scenario.
Scenario 2. N dynamics, high C pool. The equations for N
dynamics in MAGIC version 7 derive from the empirical relationship between the fraction of N leached and the C/N ratio in uppermost soil layers (forest floor) in forested stands in Europe (Fig. 2) (Gundersen et al., 1998). Retention (immobilisation) of inorganic N into the soil organic matter was assumed controlled by the C/N ratio of the soil organic compartment. If the C/N ratio is above an upper threshold value (CNUP), retention of inorganic N was 100%. If the C/
N ratio is below a lower threshold value (CNLO), retention
of inorganic N was 0%. This empirically-based method for estimating immobilisation rates required that the upper and lower threshold C/N values be calibrated for each site. The inorganic N immobilised from soil solution was added to the organic N in the organic pool, lowering the C/N ratio of that pool. Thus, there is a decline in the C/N ratio of the simulated soil organic pool as N from deposition is accumulated. As the declining C/N crosses the upper threshold, leaching of inorganic N begins and gradually increases as C/N declines further.
One key parameter is the size of the C pool and possible changes in C pool over time. The empirical data of Gundersen et al. (1998) indicate that only the C/N ratio of the upper organic soil layers varies with N deposition. But in many cases the size of this C pool is too small to account for the total accumulation of N over the past 50+ years at these sites. Some of the N retained must be passed down to lower soil layers. Yet the C pool for the whole soil is too large to allow significant change in C/N ratio due to N retention over the past 50+ years. For the sites here in southern Norway, two C pool sizes were chosen to calibrate MAGIC. The high C pool scenario used the C pool of the entire soil. C/NUP C/NLO C/N of Organic Pool 30 20 10 % Im mo bili zat ion 0 50 100 C/NUP C/NLO C/N of Organic Pool 30 20 10 % Imm obili s a tion 0 50 100
Fig. 2. Schematic view of N immobilisation of inorganic N (both NO3 and NH4) as a function of the C/N ratio of the soil organic pool as implemented in MAGIC 7 (after Cosby et al., 2001).
Scenario 3. N dynamics, low C pool. This scenario uses a C
pool one-third (an arbitrary and low figure) of the total measured pool, and was otherwise the same as scenario 2.
CALIBRATION PROCEDURE
MAGIC was calibrated to the average water chemistry for the period 199597 and the soil chemistry for each lake using an automated routine on a site-specific basis. The first steps involved calibration of the strong-acid anions; Cl and SO4 were calibrated by adjusting the deposition inputs as
described above, and NO3 was calibrated from the
input-output budgets also as described above. This set the modelled sum of strong acid anions (SAA) equal to the observed. The next steps involved calibration of the base cations Ca, Mg, Na, and K. A trial and error process was used to adjust the weathering rates of Ca, Mg, Na, and K and initial soil exchange pools of these four cations until modelled concentrations of base cations in the streamwater and modelled pools of base cations in the soil matched those observed for the calibration period. This step calculated the soil-soil solution selectivity coefficients for base cations and Al exchange. At this point, the modelled sum of base cations (SBC) equalled the observed for the calibration period.
Results
CALIBRATIONNew for this regional application of MAGIC to lakes in southern Norway is that the model was calibrated not only to one point in time, but also to the time trend in the observed chemistry. For 26 of the 60 lakes in the dataset there are observations from the 197475 regional surveys (Wright and Henriksen, 1978; Wright and Snekvik, 1978) as well as
annual measurements from 1986 as part of the national monitoring programme (SFT, 2002). Most of the lakes showed statistically significant decreases in SO4*
concentrations during the period 199099 (Skjelkvåle et al., 2001b).
Modelled concentrations of SO4*, of course, exactly
matched the observed for the calibration period 199597, as they were forced to do so as a consequence of the assumption that SO4 input equals SO4 output at each lake.
The 20-year trends, however, provide an independent measure of the model fit to the observations. The first condition for matching the trends in SO4* concentrations is
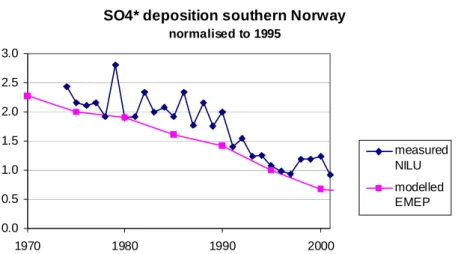
that the deposition sequence used (EMEP modelled deposition) agreed with the measured deposition. For the 27-year period 19752001, the measured wet deposition at 7 stations in southern Norway showed the same trend as the EMEP modelled, but in many years actual deposition was higher than the modelled values (Fig. 3). Actual deposition varied from the modelled for a number of reasons; the most important probably was year-to-year variations in meteorological conditions which led to variations in amount of precipitation and also variations in air trajectories. The modelled decline in SO4* concentrations in the lakes over
the period 19862001 closely matched the observed for the 20 lakes as a whole (Fig. 4) as well as individual lakes (Fig. 5). This indicates that the default values used for SO4
adsorption in the soil described the actual retention and release of SO4 quantitatively.
Comparison of the modelled and observed ANC (acid neutralising capacity) provides a measure of the accuracy of the calibration. ANC is defined as SBC-SSA, where SBC is the equivalent sum of base cations (Ca + Mg + Na + K), and SSA is the equivalent sum of strong acid anions (SO4 +
Cl + NO3). ANC was not calibrated directly, and the
Fig. 3. Wet deposition of SO4* at 7 stations in southern Norway measured by NILU as part of the national monitoring programme (Aas et al., 2002) and modelled by EMEP (Schöpp et al., 2003) relative to values for 1995-97.
SO4* deposition southern Norway
normalised to 1995 0.0 0.5 1.0 1.5 2.0 2.5 3.0 1970 1980 1990 2000 measured NILU modelled EMEP
Fig. 4. Mean observed and modelled concentrations of SO4* in 20 of the 60 lakes in the RECOVER dataset for which data are available from 1974. Shown are values relative to the mean for 1995-97.
KLEIVSETVATN 1018-4 0 20 40 60 80 100 120 140 160 1970 1975 1980 1985 1990 1995 2000 2005 TROLDEVATN 1032-14 0 20 40 60 80 100 1970 1975 1980 1985 1990 1995 2000 2005 LJOSVATN 1111-3 0 20 40 60 80 100 1970 1975 1980 1985 1990 1995 2000 2005 RØYRAVATN 1154-601 0 20 40 60 1970 1975 1980 1985 1990 1995 2000 2005 STAVSVATN 834-614 0 20 40 60 1970 1975 1980 1985 1990 1995 2000 2005 GRUNNEVATN 935-7 0 20 40 60 80 100 120 140 1970 1975 1980 1985 1990 1995 2000 2005 SKAMMEVATN 940-527 0 20 40 1970 1975 1980 1985 1990 1995 2000 2005 HEDDERSVATN 827-601 0 20 40 60 1970 1975 1980 1985 1990 1995 2000 2005
Fig. 5. Observed (squares) and modelled (triangles) SO4* concentrations (µeq l1 ) in lakewater for period with observed data 19742000 for 8 of the 60 lakes (two in each of the four counties; 8xx Telemark; 9xx Aust-Agder, 10xx Vest-Agder; 11xx Rogaland) in the RECOVER dataset.
SO4* concentrations in lakewater southern Norway
normalised to 1995-97 0.0 0.5 1.0 1.5 2.0 1970 1980 1990 2000 observed 20 lakes MAGIC 20 lakes
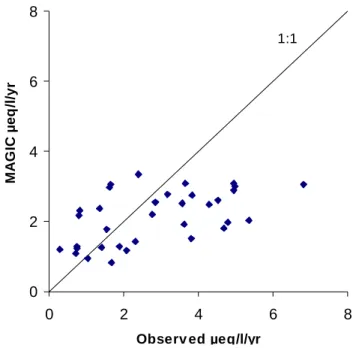
modelled ANC summed the calibration error in each of the seven ions contributing to ANC. For the calibration period 199597, the modelled ANC agreed with observed within the specified error range of ± 2 µeq l1 for each of the base
cations (Fig. 6).
The slope of time trends in ANC over the period of observations was less steep than the observed both at individual lakes (Fig. 7), for the 34 lakes for which there were annual observations over the period 199099 (Fig. 8), and for the 20 lakes for which there were observations 1986-2001 (Fig. 9). KLEIVSETVATN 1018-4 -60 -50 -40 -30 -20 -10 0 10 20 30 1970 1975 1980 1985 1990 1995 2000 TROLDEVATN 1032-14 -100 -90 -80 -70 -60 -50 -40 -30 -20 -10 0 1970 1975 1980 1985 1990 1995 2000 LJOSVATN 1111-3 -110 -100 -90 -80 -70 -60 -50 -40 -30 -20 -10 0 1970 1975 1980 1985 1990 1995 2000 RØYRAVATN 1154-601 -30 -20 -10 0 10 1970 1975 1980 1985 1990 1995 2000 HEDDERSVATN 827-601 -20 -10 0 10 20 1970 1975 1980 1985 1990 1995 2000 STAVSVATN 834-614 0 10 20 30 40 1970 1975 1980 1985 1990 1995 2000 GRUNNEVATN 935-7 -60 -50 -40 -30 -20 -10 0 10 20 1970 1975 1980 1985 1990 1995 2000 SKAMMEVATN 940-527 -30 -20 -10 0 10 1970 1975 1980 1985 1990 1995 2000
Fig. 7. Observed (squares) and modelled (triangles) ANC concentrations in lakewater for the period with observed data 1974-2000 for 8 of the
60 lakes (two in each of the four counties) in the RECOVER dataset. Shown are MAGIC calibrations under scenario 1 (constant % N retention).
ANC, µeq/l -100 -50 0 50 -100 -50 0 50 Obse rved MA G IC 1:1
Fig. 6. Observed and
modelled ANC
concentrations (µeq l1 ) in lakewater for the
calibration period 199597 for the 60 lakes in the RECOVER dataset.
Fig. 8. Modelled and observed slopes of concentrations of ANC
(µeq l1 yr) for the period 199099 in the 34 lakes of the RECOVER dataset. Shown are MAGIC calibrations under scenario 1 (constant % N retention).
Fig. 9. Mean observed and modelled concentrations of ANC in 20 of the 60 lakes in the RECOVER dataset for which data are
available from 1974. Shown are values relative to mean for 1995-97 and MAGIC calibrations under scenario 1 (constant % N retention).
HINDCASTS AND FORECASTS
Maps of the geographic distribution of modelled concentrations of SO4* in the lakes in several key years
illustrate the regional pattern as well as the changes over time (Fig. 10). SO4* concentrations were highest along the
south coast and decreased inland. Prior to the onset of acid deposition, none of the lakes had SO4* above 20 µeq l1; in
the calibration years 199597 the majority had SO4* above
20 µeq l1, and in 2016 and 2036 the concentrations of SO 4*
in many of the lakes were predicted to be below 20 µeq l1.
Comparable maps for ANC show a more complicated geographic pattern of absolute ANC levels (Fig. 11), related not only to the acidification caused by sulphur deposition, but also to the inherent sensitivity to acidification related to soil characteristics such as weathering rate of base cations (Wright and Henriksen, 1978). The MAGIC results indicated that, prior to the onset of acid deposition, none of the lakes had ANC below 0 µeq l-1, in the calibration years 199597
the majority had ANC below 20 µeq l1, while by 2016 and
2036 many of the lakes were predicted to recover to above 20 µeq l1.
While the maps are useful in displaying the geographic patterns for single years, the long-term historical and future trends for the dataset as a whole are shown by time-track diagrams. For SO4* concentrations in the lakes, the
time-tracks showed maximum levels around 1970, a sharp decline until about 2000, a minor further decline until about 2020
ANC concentrations in lakewater southern Norway
normalised to 1995-97 0.0 0.5 1.0 1.5 2.0 2.5 1970 1980 1990 2000 observed 20 lakes MAGIC 20 lakes 0 2 4 6 8 0 2 4 6 8 Observ ed µeq/l/yr M A G IC µ e q /l/y r 1:1
Fig. 10. Maps of southernmost Norway showing modelled SO4* (µeq l1) concentrations in the 60 RECOVER lakes for the time prior to onset of acid deposition (1860), the calibration period (1995-97), and future forecast assuming CLE scenario is implemented (2016 and 2036).
Fig. 11. Maps of southernmost Norway showing modelled ANC (µeq l1) concentrations in the 60 RECOVER lakes for the time prior to onset of acid deposition (1860), the calibration period (1995-97), and future forecast assuming CLE scenario is implemented (2016 and 2036). Shown are MAGIC calibrations under scenario 1 (constant % N retention).
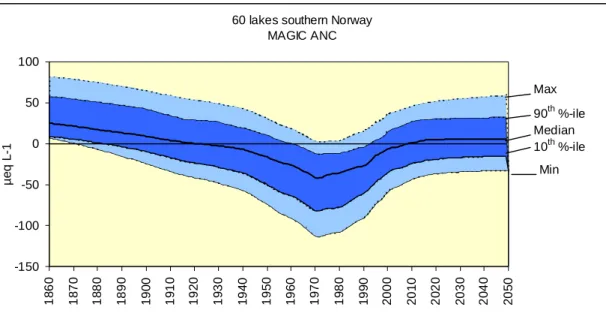
and constant levels after 2020 (Fig. 12). The converse trend was predicted for ANC concentrations and the predicted future response indicated levels lower than the pre-acidification reference levels in the lakes (Fig. 13).
Pie charts are a third means of presenting these results. For SO4* the data indicated that from 1996 to 2016
concentrations will decline in the lakes such that by 2016 none will have SO4* in the > 40 µeq l1 category (Fig. 14).
A small further improvement from 2016 to 2036 was also indicated.
Fig. 12. Historical and future concentrations of SO4* (µeql-1) modelled by MAGIC for the RECOVER dataset of 60 lakes in southernmost Norway. Shown are the maximum, 90% percentile, median, 10% and minimum values.
Fig. 13. Historical and future concentrations of ANC (µeql-1) modelled by MAGIC for the RECOVER dataset of 60 lakes in southernmost Norway. Shown are the maximum, 90% percentile, median, 10% and minimum values for calibrations under scenario 1 (constant % N retention).
For ANC, the number of lakes in the most acidified category (< 0 µeq l1) was predicted to decline from 85% in
1996 to 38% in 2016 and further to 33% in 2036 (Fig. 15). The fraction of lakes in the highest ANC category (> 20 µeq l1) will ultimately increase to 18%.
NITROGEN SCENARIOS
While all of the lakes could be calibrated under scenarios 1 (constant % N retention) and 2 (N dynamics with high C 60 lakes southern Norway
MAGIC SO4 0 50 100 150 200 18 60 18 70 18 80 18 9 0 19 00 19 10 19 2 0 19 30 19 40 19 5 0 19 60 19 70 19 80 19 90 20 00 20 10 20 20 20 3 0 20 40 20 50 µe q L -1 Max Min 10th %-ile Median 90th %-ile
60 lakes southern Norway MAGIC ANC -150 -100 -50 0 50 100 18 60 18 70 18 80 18 9 0 19 00 19 10 19 2 0 19 30 19 40 19 5 0 19 60 19 70 19 80 19 90 20 0 0 20 10 20 20 20 3 0 20 40 20 50 µe q L -1 10th %-ile 90th %-ile Max Min Median
Fig. 14. Relative frequency of lakes with modelled SO4* concentrations in 3 categories in the years 1860, 1995-97, 2016 and 2036.
Fig. 15. Relative frequency of lakes with modelled ANC concentrations in 3 categories in the years 1860, 1995-97,
2016 and 2036 under scenario 1 (constant % N retention).
Excess_SO4 - 18600 % 0 % 100 % > 40 20 - 40 < 20 Excess_SO4 - 1996 57 % 33 % 10 % > 40 20 - 40 < 20 Excess_SO4 - 2016 0 % 57 % 43 % > 40 20 - 40 < 20 Excess_SO4 - 2036 0 % 52 % 48 % > 40 20 - 40 < 20 CALK - 1860 0 % 45 % 55 % < 0 0 - 20 > 20 CALK - 1996 85 % 12 % 3 % < 0 0 - 20 > 20 CALK - 2016 38 % 49 % 13 % < 0 0 - 20 > 20 CALK - 2036 33 % 47 % 20 % < 0 0 - 20 > 20
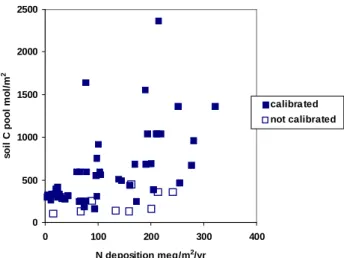
pool), 9 of the 60 lakes failed to calibrate under scenario 3 (N dynamics with low C pool) (Fig. 16). These all have total soil C pools less than about 500 mol m2.
Comparison of the NO3 concentrations simulated by
MAGIC under the three scenarios with the observations reveal that none of the MAGIC scenarios gave results that fit the observed trends. Indeed, the observations for individual lakes showed widely differing time trends during the period 19862000; some have an increasing trend, some have no trend and some have decreasing trend (Fig. 17).
The three nitrogen scenarios produced quite different trends in past and future concentrations of NO3 in lakes (Fig.
18). Under scenario 1 (constant % N retention) median NO3
concentrations were predicted to decline in response to future declines in N deposition, whereas in scenarios 2 (N
Fig. 16. Soil C pool and N deposition in 1995-97 for sites at which
MAGIC could be calibrated (solid symbols) or not calibrated (open symbols) under scenario 3 (nitrogen dynamics with low C pool).
Fig. 17. Observed (squares) and modelled NO3 concentrations (µeql-1) in lakewater for the period with observed data 1974-2000 for 8 of the 60 lakes (two in each of the four counties) in the RECOVER dataset. Scenario 1 (constant % N retention): red open triangles; scenario 2 (N dynamics, high C pool): green crosses; scenario 3 (N dynamics, low C pool): blue open diamonds.
0 500 1000 1500 2000 2500 0 100 200 300 400
N deposition meq/m2/yr
s o il C pool m o l/ m 2 calibra ted not calibrated HEDDERSVATN 827-601 0 2 4 6 8 10 12 1970 1975 1980 1985 1990 1995 2000 STAVSVATN 834-614 0 1 2 3 4 5 6 1970 1975 1980 1985 1990 1995 2000 SKAMMEVATN 940-527 0 1 2 3 4 5 6 7 8 9 1970 1975 1980 1985 1990 1995 2000 KLEIVSETVATN 1018-4 0 5 10 15 20 25 30 1970 1975 1980 1985 1990 1995 2000 TROLDEVATN 1032-14 0 5 10 15 20 25 30 35 40 1970 1975 1980 1985 1990 1995 2000 LJOSVATN 1111-3 0 5 10 15 20 25 30 35 1970 1975 1980 1985 1990 1995 2000 RØYRAVATN 1154-601 0 2 4 6 8 10 12 14 16 1970 1975 1980 1985 1990 1995 2000 GRUNNEVATN 935-7 0 1 2 3 4 5 6 7 8 9 10 1970 1975 1980 1985 1990 1995 2000
changed. Predictions based on the calibrations here are, therefore, probably much more reliable than those made previously by Wright et al. (1991) and Cosby and Wright (1998).
The calibrated trends in SO4 closely matched the observed
over the period 19862000 (Figs. 4 and 5). This suggests strongly that soil processes such as SO4 adsorption/
desorption and S reduction/oxidation do not delay the response of runoff to changes in SO4 deposition by more
than a few years. In young soils such as those in southern Norway developed since the last Pleistocene glaciation, of course, sulphate adsorption capacity is typically low (Johnson et al., 1980), but the trends also indicated that redox processes in wetlands in southern Norway generally play a minor role on time scales of years. In catchments in southern Ontario, Canada, on the other hand, periodic release of re-oxidised sulphate from wetlands can have a large impact on runoff chemistry (Devito et al., 1999).
The observed trends in ANC during the 1990s were larger (steeper slopes) than the MAGIC simulated slopes (Fig. 8). Inasmuch as the trends in strong acid anions (mostly SO4)
were correctly simulated, this means that the decline in observed concentrations of base cations (BC) was less than the simulated. In other words, the observed F-factor (defined as change in BC per change in SO4*) (Henriksen, 1980;
Brakke et al,. 1990) was smaller than simulated by MAGIC. This in turn implies that the soil BC retention is stronger than simulated, i.e. the cation selectivity coefficients for cation exchange between base cations and aluminium are lower than those calibrated by MAGIC. One explanation for this could be that the entire soil column does not interact actively with the soilwater that emerges as runoff. Another explanation is that the default values used for several key parameters such as logKAl in soil and total concentration of dissolved organic acids in soil solution, neither of which is measured, were too high. The response of runoff to changes in deposition is particularly sensitive to changes in these two parameters.
NITROGEN DYNAMICS
The empirical relationship between C/N ratio in forest floor and the N out/in ratio of Gundersen et al. (1998) is a snapshot in time. If the space-for-time analogy is invoked, this relationship implies that sites with C/N ratio below about 25 and at which N retention is low, formerly had higher C/ N ratios with nearly 100% retention. Further, this implies that at these sites the C/N ratio declined due to retention of N deposition. A consequence is that the NO3 concentrations
in surface waters at these sites have increased over time as the C/N ratio has decreased.
Fig. 18. Median concentration of NO3 (upper panel) and ANC (lower panel) for the 51 lakes that could be calibrated to all 3 scenarios.
dynamics high C pool) and especially 3 (N dynamics low C pool) future NO3 concentrations were predicted to increase
due to progressive lowering of C/N ratios in soil and thus decreased % retention. By the year 2050, NO3 concentrations
predicted under scenario 3 were almost twice those predicted under scenario 1.
The large differences in NO3, however, produced only
minor differences in ANC between the three scenarios (Fig. 18). Even in the year 2050 the difference was predicted to be only about 5 µeq l1.
Discussion
CALIBRATIONCalibration of the sites to the observed time trends (1990 1999) as well as to one point in time (mean 199597) increased the robustness of the calibration. In a study of uncertainties in predictions using MAGIC, Larssen et al. (in press) showed that not only does the range of predicted ANC decrease but also the distribution of the forecast is
-50 -40 -30 -20 -10 0 10 20 30 1850 1900 1950 2000 2050 Year AN C µ e q /l
1 const. retention 3 low C
2 high C 0 2 4 6 8 10 12 1850 1900 1950 2000 2050 Year NO 3 µe q /l 1 const. retention 2 high C 3 low C
Future recovery of acidified lakes in southern Norway predicted by the MAGIC model But the temporal data for the RECOVER lakes in southern
Norway did not show systematic increases in NO3
concentrations (Fig. 15). In most cases, the observed trends over the past 15 years were not simulated by any of the three N scenarios. It is clear that the C/N ratio in soil is not sufficient to account for N retention and leaching at these sites.
PREDICTED FUTURE CHEMISTRY
If the emission reductions in the CLE scenario are implemented, then S deposition in southern Norway will decrease until the year 2025, at which time deposition of SO4* will be reduced to the levels of 1880 (Fig. 1). This is a
fully 80% reduction relative to the peak in 1970. For nitrogen, the future reductions under CLE are more moderate; NH4 will remain constant at present-day levels,
which are about 25% below the peak of 1980, while NO3
will decrease to about 50% of the peak level of 1990. SO4* concentrations in the lakes were predicted to decrease
parallel with the future decreases in S deposition (Figs. 10, 12 and 14). Fully 80% of the expected decline to the year 2025, however, has already occurred by the year 2000.
Similarly ANC concentrations were predicted to increase in the future, but again about two-thirds of the expected change has already occurred over the past 20 years (Figs. 11, 13 and 15). ANC concentrations were also predicted to increase gradually after 2025 in most of the lakes due to the gradual re-building of the pool of base cations in the soil. By the year 2025, however, the recovery of ANC will probably still be incomplete; in 2025, the median predicted ANC was +5 µeq l1 whereas the original median ANC in
year 1860 was +25 µeq l1.
PREDICTED FUTURE BIOLOGICAL STATUS
The predicted future ANC concentrations in lakes can be interpreted in terms of population status of trout. With about 95% probability, lakes with ANC < 0 µeq l1 are barren,
ANC 020 µeq l1 have sparse populations, and ANC >
20 µeq l1 have good populations (Bulger et al., 1993; Lien
et al., 1992). The MAGIC simulations indicated that
chemical conditions in about one-third of the lakes will still be insufficient to support trout populations in the year 2036 (Fig. 15).
IMPLICATIONS FOR MANAGEMENT
These lakes are among the most acid-sensitive in Norway (and Europe), and yet are typical of lakes in large areas of southernmost Norway. Maps of critical loads of acidity and exceedence for surface waters show southern Norway as a
hot spot in Europe (Posch et al,. 1999). Even after the CLE scenario is implemented, the critical load of acidity will be exceeded in many of the lakes, and about one-third of the lakes will have ANC < 0 µeq l1 (Fig. 15).
Thus, additional measures are required if these lakes are to be restored. The MAGIC calculations can be used to determine target loads, that is to which level S deposition must be decreased to allow a given number of the lakes to recover. Another measure might be liming either the lakes or their catchments
CONFOUNDING FACTORS
The largest uncertainty in these predictions is the future retention and loss of N. Over the next few decades, the three different N scenarios used here do not predict large differences in ANC. But over the long term, the N saturation scenarios 2 and 3 imply dramatic increases in NO3
concentrations and thus re-acidification of the lakes with decreases in ANC.
Future climate change entailing warming and changed precipitation could also cause increased NO3 loss to surface
waters. That increased temperature enhances mineralisation of soil organic matter was demonstrated by the CLIMEX project, a whole-catchment manipulation with increased air temperature and CO2, in which NO3 concentrations in runoff
increased in a small catchment in southern Norway (Wright 1998).
These MAGIC simulations indicated that acidified lakes in southern Norway will continue to recover over the next 1020 years, if the Gothenburg protocol and other currently agreed legislation are implemented. The recovery will not be complete, however, not only because there will still be significant acid deposition in the future (maximum reductions are 80% relative to the 1970 peak year) but also because the decades of acid deposition have depleted the soils of base cations. The latter factor introduces hysteresis recovery of the lakes does not simply follow the reverse path of acidification. Over the next 1020 years, many of the lakes were predicted to recover to the point at which they can again support trout populations. Possible increased leaching of nitrogen due to N saturation and climate change, however, makes longer-term predictions uncertain.
Acknowledgements
This work was carried out as part of the RECOVER:2010 project (the Commission of European Communities EVK1-CT-1999-00018). The work was supported financially in part by the Nordic Council of Ministers, the Research Council of Norway, and the Norwegian Institute for Water
Research. Tore Høgaasen at NIVA is thanked for multiple trials of the multiple calibrations.
References
Aas, W., Tørseth, K., Solberg, S., Berg, T., Manø, S. and Yttri, K.E., 2002. Overvåking av langtransportert forurenset luft og nedbør. Atmosfærisk tilførsel 2001. 847/02, Statens forurensningstilsyn, Oslo, Norge.
Brakke, D.F., Henriksen, A. and Norton, S.A., 1989. Estimated background concentrations of sulfate in dilute lakes. Water Resour. Bull., 25, 247253.
Brakke, D.F., Henriksen, A. and Norton, S.A., 1990. A variable F-factor to explain changes in base cation concentrations as a function of strong-acid deposition. Verh. Internat. Verein. Limnol., 24, 146149.
Bulger, A.J., Lien, L., Cosby, B.J. and Henriksen, A., 1993. Brown trout (Salmo trutta) status and chemistry from the Norwegian thousand lake survey: statistical analysis. Can. J. Fisheries Aquat. Sci., 50, 575585.
Bull, K.R., Achermann, B., Bashkin, V., Chrast, R., Fenech, G., Forsius, M., Gregor, H-D., Guardans, R., Haussmann, T., Hayes, F., Hettelingh, J.P., Johannessen, T., Krzyzanowski, M., Kucera, V., Kvæven, B., Lorenz, M., Lundin, L., Mills, G., Posch, M., Skjelkvåle, B.L. and Ulstein, M.J., 2001. Coordinated effects monitoring and modelling for developing and supporting international air pollution control agreements. Water Air Soil Pollut., 130, 119130.
Cosby, B.J. and Wright, R.F., 1998. Modelling regional response of lakewater chemistry to changes in acid deposition: the MAGIC model applied to lake surveys in southernmost Norway 1974-1986-1995. Hydrol. Earth Syst. Sci., 2, 563576. Cosby, B.J., Hornberger, G.M., Galloway, J.N. and Wright, R.F.,
1985a. Modelling the effects of acid deposition: assessment of a lumped parameter model of soil water and streamwater chemistry. Water Resour. Res., 21, 5163.
Cosby, B.J., Wright, R.F., Hornberger, G.M. and Galloway, J.N., 1985b. Modelling the effects of acid deposition: estimation of long term water quality responses in a small forested catchment. Water Resour. Res., 21, 15911601.
Cosby, B.J., Ferrier, R.C., Jenkins, A. and Wright, R.F., 2001. Modelling the effects of acid deposition: refinements, adjustments and inclusion of nitrogen dynamics in the MAGIC model. Hydrol. Earth Syst. Sci., 5, 499518.
Devito, K.J., Hill, A.R. and Dillon, P.J., 1999. Episodic sulphate export from wetlands in acidified headwater catchments: prediction at the landscape scale. Biogeochem,, 44, 187203. Esser, J.M., 1994. Jordsmonn i bjørkeskog - en oversikt for Norge.
Rapport nr. 4/94, Norsk Institutt for Jord- og Skogkartlegging, Ås, Norway. 36pp.
Esser, J.M. and Nyborg, Å., 1992. Jordsmonn i barskog- en oversikt for Norge. Rapport nr. 3/92, Norsk Institutt for Jord-og SkJord-ogkartlegging, Ås, Norway. 50pp.
Ferrier, R.C., Jenkins, A., Wright, R.F., Schöpp, W. and Barth, H., 2001. Assessment of recovery of European surface waters from acidification 1970-2000: An introduction to the Special Issue. Hydrol. Earth Syst. Sci., 5, 274282.
Frogner, T., Wright, R.F., Cosby, B.J. and Esser, J.M., 1994. Maps of critical loads and exceedance for sulfur and nitrogen to forest soils in Norway. Naturens Tålegrense Fagrapport 56, NIVA, Oslo. 27pp.
Gundersen, P., Callesen, I. and de Vries, W., 1998. Nitrate leaching in forest ecosystems is controlled by forest floor C/N ratio. Environ. Pollut., 102, 403407.
Henriksen, A., 1980. Acidification of freshwaters - a large scale titration. In: Ecological Impact of Acid Precipitation, D. Drabløs and A. Tollan, (Eds.) SNSF project, Oslo, 383pp. 68-74 Henriksen, A. and Posch, M., 2001. Steady-state models for
calculating critical loads of acidity for surface waters. Water Air Soil Pollut., Focus, 1, 375398.
Henriksen, A., Lien, L., Traaen, T.S., Sevaldrud, I. and Brakke, D.F., 1988. Lake acidification in Norway - present and predicted chemical status. Ambio, 17, 259266.
Hruska, J., Kohler, S., Laudon, H. and Bishop, K., 2003. Is a universal model of organic acidity possible: Comparison of the acid/base properties of dissolved organic carbon in the boreal and temperate zones. Environ. Sci. Technol., 37, 17261730. Johnson, D.W., Hornbeck, J.W., Kelly, J.M., Swank, W.T. and
Todd, D.E., 1980. Regional patterns of soil sulfate accumulation: relevance to ecosystem sulfur budgets. In: Atmospheric Sulfur Deposition: Environmental Impact and Health Effects, D. S. Shriner, C. R. Richmond and S. E. Lindberg (Eds.) Butterworth, Ann Arbor, USA. 507520.
Kaste, Ø. and Dillon, P.J., 2003. Inorganic nitrogen retention in acid-sensitive lakes in southern Norway and southern Ontario, Canada a comparison of mass balance data with an empirical N retention model. Hydrol. Process., 17, 23932407. Larssen, T., Cosby, B.J. and Høgåsen, T. Uncertainties in
predictions of surface water acidity using the MAGIC model. Water Air Soil Pollut., Focus, (in press).
Lien, L., Raddum, G.G. and Fjellheim, A., 1992. Critical loads of acidity to freshwater fish and invertebrates. Naturens Tålegrense Fagrapport 23, Norwegian Institute for Water Research, Oslo. 36pp.
Mylona, S., 1996. Sulphur dioxide emissions in Europe 1880-1991 and their effect on sulphur concentrations and depositions. Tellus, 48B, 662689.
Overrein, L., Seip, H.M. and Tollan, A., 1980. Acid precipitation - Effects on forest and fish. Final report of the SNSF-project 1972-1980. Fagrapport FR 19-80, Oslo-Ås, Norway. 175pp. Posch, M., de Smet, P.A.M., Hettelingh, J.P. and Downing, R.J.,
1999. Calculation and Mapping of Critical Thresholds in Europe: Status Report 1999. CCE Status Report. National Institute of Public Health and the Environment, Bilthoven, The Netherlands. 165pp.
SFT, 2002. Overvåking av langtransportert forurenset luft og nedbør. Årsrapport - Effekter 2001. Statlig program for forurensningsovervåking Rapport 854/02, Statens forurensningstilsyn, Oslo, Norge. 194pp.
Simpson, D., Olendrzynski, K., Semb, A., Støren, E. and Unger, S., 1997. Photochemical oxidant modelling in Europe: multi-annual modelling and source-receptor relationships. EMEP/ MSC-W Report 3/97, Norwegian Meteorological Institute, Oslo, Norway. 75pp.
Skjelkvåle, B.L., Henriksen, A., Faafeng, B., Fjeld, E., Traaen, T.S., Lien, L., Lydersen, E. and Buan, A.K., 1996. Regional innsjøundersøkelse 1995. En vannkjemisk undersøkelse av 1500 norske innsjøer. Statlig program for forurensningsovervåking Rapport 677/96, Statens forurensningstilsyn, Oslo, Norway. 73pp.
Skjelkvåle, B.L., Wright, R.F. and Henriksen, A., 1998. Norwegian lakes show widespread recovery from acidification: results of national surveys of lakewater chemistry 1986-1997. Hydrol. Earth Syst. Sci., 2, 555562.
Skjelkvåle, B.L., Tørseth, K., Aas, W. and Andersen, T., 2001a. Decrease in acid deposition - Recovery in Norwegian surface waters. Water Air Soil Pollut., 130, 14331438.
Skjelkvåle, B.L., Mannio, J., Wilander, A. and Andersen, T., 2001b. Recovery from acidification of lakes in Finland, Norway and Sweden 1990-1999. Hydrol. Earth Syst. Sci., 5, 327338.
Wright, R.F., 1998. Effect of increased CO2 and temperature on
runoff chemistry at a forested catchment in southern Norway (CLIMEX project). Ecosystems, 1, 216225.
Wright, R.F. and Henriksen, A., 1978. Chemistry of small Norwegian lakes with special reference to acid precipitation. Limnol. Oceanog., 23, 487498.
Wright, R.F. and Snekvik, E., 1978. Acid precipitation: chemistry and fish populations in 700 lakes in southernmost Norway. Verh. Internat. Verein. Limnol., 20, 765775.
Wright, R.F., Cosby, B.J. and Hornberger, G.M., 1991. A regional model of lake acidification in southernmost Norway. Ambio,
20, 222225.
Wright, R.F., Emmett, B.A. and Jenkins, A., 1998. Acid deposition, land-use change and global change: MAGIC7 model applied to Risdalsheia, Norway (RAIN and CLIMEX projects) and Aber, UK (NITREX project). Hydrol. Earth Syst. Sci., 2, 385397. Wright, R.F., Mulder, J. and Esser, J.M., 1999. Soils in mountain
and upland regions of southwestern Norway: nitrogen leaching and critical loads. Naturens Tålegrenser Fagrapport 103, Norwegian Institute for Water Research, Oslo. 45pp.