HAL Id: hal-01369504
https://hal.archives-ouvertes.fr/hal-01369504
Submitted on 18 Jan 2021
HAL is a multi-disciplinary open access
archive for the deposit and dissemination of
sci-entific research documents, whether they are
pub-lished or not. The documents may come from
teaching and research institutions in France or
abroad, or from public or private research centers.
L’archive ouverte pluridisciplinaire HAL, est
destinée au dépôt et à la diffusion de documents
scientifiques de niveau recherche, publiés ou non,
émanant des établissements d’enseignement et de
recherche français ou étrangers, des laboratoires
publics ou privés.
Proper motion survey and kinematic analysis of the ρ
Ophiuchi embedded cluster
C. Ducourant, R., Teixeira, A., Krone-Martins, Sylvain Bontemps, D. Despois,
P. A. B., Galli, H. Bouy, J.-F. Le Campion, M., Rapaport, J. C., Cuillandre
To cite this version:
C. Ducourant, R., Teixeira, A., Krone-Martins, Sylvain Bontemps, D. Despois, et al.. Proper motion
survey and kinematic analysis of the ρ Ophiuchi embedded cluster. Astronomy and Astrophysics
-A&A, EDP Sciences, 2017, 597, pp.A90. �10.1051/0004-6361/201527574�. �hal-01369504�
DOI:10.1051/0004-6361/201527574 c ESO 2017
Astronomy
&
Astrophysics
Proper motion survey and kinematic analysis of the
ρ
Ophiuchi
embedded cluster
?
,
??
C. Ducourant
1, 2, R. Teixeira
2, 1, A. Krone-Martins
3, 1, S. Bontemps
1, D. Despois
1, P. A. B. Galli
2, H. Bouy
4,
J. F. Le Campion
1, M. Rapaport
1, and J. C. Cuillandre
51 Laboratoire d’Astrophysique de Bordeaux, Univ. Bordeaux, CNRS, B18N, allée Geoffroy Saint-Hilaire, 33615 Pessac, France
e-mail: [email protected]
2 Instituto de Astronomia, Geofísica e Ciências Atmosféricas, Universidade de São Paulo, Rua do Matão, 1226 –
Cidade Universitária, 05508-900 São Paulo – SP, Brazil
3 CENTRA/SIM, Faculdade de Ciências, Universidade de Lisboa, Ed. C8, Lab. 8.5.02, Campo Grande, 1749-016 Lisboa, Portugal 4 Centro de Astrobiología, Dpto de Astrofísica, INTA-CSIC, PO Box 78, 28691 ESAC Campus, Villanueva de la Cañada, Madrid,
Spain
5 CEA/IRFU/SAp, Laboratoire AIM Paris-Saclay, CNRS/INSU, Université Paris Diderot, Observatoire de Paris,
PSL Research University, 91191 Gif-sur-Yvette Cedex, France Received 16 October 2015/ Accepted 31 August 2016
ABSTRACT
Context.The ρ Ophiuchi molecular complex and in particular the Lynds L1688 dark cloud is unique in its proximity (∼130 pc), in its richness in young stars and protostars, and in its youth (0.5 Myr). It is certainly one of the best targets currently accessible from the ground to study the early phases of star-formation. Proper motion analysis is a very efficient tool for separating members of clusters from field stars, but very few proper motions are available in the ρ Ophiuchi region since most of the young sources are deeply embedded in dust and gas.
Aims.We aim at performing a kinematic census of young stellar objects (YSOs) in the ρ Ophiuchi F core and partially in the E core of the L1688 dark cloud.
Methods.We run a proper motion program at the ESO New Technology Telescope (NTT) with the Son of ISAAC (SOFI) instrument over nine years in the near-infrared. We complemented these observations with various public image databases to enlarge the time base of observations and the field of investigation to 0.5◦
× 0.5◦
. We derived positions and proper motions for 2213 objects. From these, 607 proper motions were derived from SOFI observations with a ∼1.8 mas/yr accuracy while the remaining objects were measured only from auxiliary data with a mean precision of about ∼3 mas/yr.
Results.We performed a kinematic analysis of the most accurate proper motions derived in this work, which allowed us to separate cluster members from field stars and to derive the mean properties of the cluster. From the kinematic analysis we derived a list of 68 members and 14 candidate members, comprising 26 new objects with a high membership probability. These new members are generally fainter than the known ones. We measured a mean proper motion of (µαcos δ, µδ) = (−8.2, −24.3) ± 0.8 mas/yr for the L1688 dark cloud. A supervised classification was applied to photometric data of members to allocate a spectral energy distribution (SED) classification to the unclassified members.
Conclusions.We kinematically confirmed that the 56 members that were known from previous studies of the ρ Ophiuchi F cluster and that were also part of our survey are members of the cluster, and we added 26 new members. We defined the evolutionary status of the unclassified members of the cluster. We showed that a large part (23) of these new members are probably brown dwarfs, which multiplies the number of known substellar objects in the cluster by a factor of 3.3.
Key words. proper motions – reference systems – stars: formation – open clusters and associations: individual: ρ Ophiuchi
1. Introduction
Stars are believed to form predominantly in groups that gradu-ally lose their content in gas and disperse. Clusters are groups that remain stable against tidal disruption by the Galaxy or by passing interstellar clouds and that do not loose their members rapidly (evaporation time >100 Myr), whereas associations are looser, less stable groups (Lada & Lada 2003). The youngest ? Based on observations collected at the European Southern
Observatory, Chile (64.I-0197, 67.C-0349, 69.C-0230, 71.C-0028, 73.C-0022, 83.D-0635).
?? Full Tables 6–8 are only available at the CDS via anonymous ftp to
cdsarc.u-strasbg.fr(130.79.128.5) or via
http://cdsarc.u-strasbg.fr/viz-bin/qcat?J/A+A/597/A90
clusters and associations keep a fresh record of the physical and kinematic conditions involved in their formation. They are the precursors of the visible open clusters and of the dispersed galac-tic streams of stars.
The youngest of the very young (<5 Myr) clusters are still embedded in their parent cloud. Their properties and scientific interest in them have been reviewed by Lada & Lada (2003) who listed 76 clusters. Since these clusters are extremely young, they should not have lost any stars yet because of the gravita-tional well of the embedding interstellar cloud. As in addition substellar objects have their peak luminosity in their first Myr, embedded clusters constitute excellent benchmarks for studies of the initial mass function, especially at the low-mass end. Strong absorption (AV ∼ 10−50) by the remaining interstellar
matter prevents studying embedded clusters at visible wave-lengths, however. Near-infrared (NIR) observations are required and the NIR range is also best suited to studying the spectral energy distribution (SED) of the low-mass objects.
Separating true brown dwarfs from field objects is not sim-ple, however. The confirmed membership of objects to a forming cluster makes their identification as brown dwarfs much more reliable when it is joined to colour-magnitude and colour-colour diagrams because it fixes their distance and age within a nar-row range. This method also produces the least biased samples in this mass range (Luhman 2012). Another debated question is the age determination of the youngest clusters and the possible age spread within a given cluster. Here secure membership is also crucial, as interloping field stars, especially at the very faint end of the luminosity distribution, can lead to misinterpretations (e.g.Soderblom et al. 2014).
The only membership analysis in clusters that does not de-pend on a hypothesis is the kinematic analysis which uses the proper motions of objects to separate cluster members from field stars. The main limitations of this method are the accuracy of the proper motions, the limiting magnitude of the observations, and obviously the distance of the cluster. Astrometric surveys of embedded clusters are still rare, however mainly because tradi-tionally astrometry is performed at optical wavelengths and no good astrometric reference catalogue exists in the near IR, es-pecially in K band. Even the astrometric space mission Gaia (Perryman et al. 2001;Mignard et al. 2008;Lindegren 2010) will not be able to provide proper motions in such obscure regions, and the ground-based astrometric works in the NIR therefore re-main very unique.
A variety of proper motion studies, including surveys of large regions have been conducted in the NIR (e.g. recentlyDawson et al. 2014, with UKIDSS;Vrba et al. 2004,2012, with USNO;
Peña Ramírez et al. 2015,2016;Bouy et al. 2013,2015). The Upper Sco region is part of the Sco OB2 association, is prob-ably physically related to the ρ Ophiuchi region but somewhat older (∼10 Myr), is no longer embedded in its parent cloud and has low absorption (AV ∼ 1−2). It has recently been the tar-get of proper motion studies in the NIR (Luhman & Mamajek 2012; Lodieu 2013). Very few studies of high-absorption re-gions (AV ∼ 10−50) have been conducted because they re-quire measuring positions in the less absorbed K band (2.2 µm; AK/AV ∼ 0.1). A very special case is the Galactic centre region (AV ∼ 27; e.g.Eckart et al. 2013;Fritz et al. 2010,2016;Do et al.
2013;Boehle et al. 2016), where very high precision astrometry in K band has been conducted, in particular to study stellar orbits around the central black hole. A wide-field study of the Carina region has also been conducted in K band by Preibisch et al.
(2014) with proper motion accuracy σµ∼ 9−10 mas/yr.
To improve our knowledge of the cluster membership, we decided to run a NIR proper motion program in the ρ Ophiuchi complex. The ρ Ophiuchi IR cluster is unique in its proximity (120−140 pc) (Wilking et al. 2008), in its richness in young stars and protostars, and in its youth because it is one of the youngest known clusters at ∼0.5 Myr (Bontemps et al. 2001;André et al. 2007). It is certainly one of the best targets currently accessible for star-formation studies.
Many works in the ρ Ophiuchi region tried to assess the membership to the ρ Ophiuchi complex through spectroscopy and photometry. In a pioneer work, Bontemps et al. (2001) performed a census of the population of young stars with IR excesses in this region using Infrared Space Observatory (ISO) (Cesarsky et al. 1996) observations. Evans et al.(2003) delivered the c2d Spitzer (Gallagher et al. 2003) final data
release (DR4) providing observations and characterisation of sources from molecular cores to planetary disks in the mid-to far-infrared wavelengths. In a recent series of paper, Alves de Oliveira2010; 2012; 2013 established which objects belong to the low-mass population in the ρ Ophiuchi molecular cloud through photometric observations in the NIR regime. With a spectroscopic follow-up, the authors characterised the brown dwarf population of an exhaustive list of candidates and detected disks around several brown dwarfs. All these works performed a census of the ρ Ophiuchi complex, that relied on photometric data and extinction models.
We present here a study of the proper motions in the direc-tion of the sub-cluster ρ Ophiuchi F of the Lynds L1688 dark cloud that exhibits a clear association of young stars with the Ophiuchi F molecular dense core. A study recently published by (Wilking et al. 2015) also addressed proper motions in the ρ Oph cluster (cores B-2, F, C-S, E and A-3, which partly overlaps the region covered here). This study used the same telescope and ASTROCAM as the USNO IR astrometry program (e.g. Vrba et al. 2004,2012) and is complementary to our work. By choos-ing to derive relative proper motions of objects with Ks < 16, the authors reached a very good precision on proper motions (σµ ∼ 1 mas/yr) that is well-suited to discussing the internal dynamics of the cluster. Here we attempt to derive positions and proper motions linked to the International Celestial Reference Frame (ICRF,Ma et al. 1998) for objects with Ks < 18−19 by using for the reduction catalogues that are defined in this frame. This is at the price of a degraded precision because there are few reference stars, but it enables us to address the question of clus-ter membership including substellar objects down to M9 spectral type.
This paper is organised as follows. In Sect. 2 we present the observational material used for the proper motion measurements. In Sect. 3 we present the reduction procedure and the resulting proper motion catalogue. In Sect. 4 we present the astrometric validation of the proper motions, in Sect. 5 the kinematic analy-sis of the ρ Ophiuchi F/E cores and in Sect. 6 a tentative classifi-cation of its content. We discuss the nature of the new members in Sect. 7. Our conclusions are summarised in Sect. 8.
2. Observational data
The work that we present here aims at measuring proper motions in the near-IR inside an embedded cluster. These proper motions are used to separate cluster members from background stars. We focused our efforts on the F/E cores of the Lynds L1688 cloud in the ρ Ophiuchi star-forming region which is a region with high extinction (AV > 25−100 mag,Wilking et al. 2015) and ongoing star-formation.
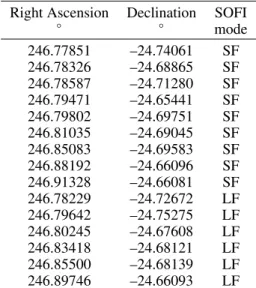
The observations were carried out at the ESO-NTT equipped with the SOFI NIR camera. Astrometric (Ks) and photometric (J, H, Ks) observations were performed in direct-imaging mode. A list of 15 pointing directions, in small- and large-field mode (SF, LF) (see Table1) was established to set up a mosaic cover-ing the F and E cores with overlappcover-ing frames. The covered field is about 0.2◦ × 0.2◦.
The observations were acquired during six observational epochs (2000.3, 2001.3, 2002.3, 2003.3, 2004.3, and 2009.3) with a total of 26 half-nights. The observations were performed at the same epoch of the year (April) so that no parallactic signa-ture would perturb the astrometry. We present the characteristics of the 648 SOFI exposures obtained for this work in Table2. Multiple exposures taken over three consecutive nights were
Table 1. Pointing directions of the ESO-NTT(SOFI) observational program.
Right Ascension Declination SOFI
◦ ◦ mode 246.77851 –24.74061 SF 246.78326 –24.68865 SF 246.78587 –24.71280 SF 246.79471 –24.65441 SF 246.79802 –24.69751 SF 246.81035 –24.69045 SF 246.85083 –24.69583 SF 246.88192 –24.66096 SF 246.91328 –24.66081 SF 246.78229 –24.72672 LF 246.79642 –24.75275 LF 246.80245 –24.67608 LF 246.83418 –24.68121 LF 246.85500 –24.68139 LF 246.89746 –24.66093 LF
Notes. SF and LF designate the small field and large field modes of the SOFI camera.
performed at each epoch to average atmospheric effects and to enhance the signal-to-noise ratio (S/N).
Two observing modes of SOFI were tried: nine in the SF mode, scale= 0.14400/pixel, Field Of View (FOV) = 2.50, and six in the LF mode, scale= 0.28800/pixel, FOV = 50. Unfortunately, the SF observations appeared to be perturbed by distortions; the astrometry in the LF mode was much more stable. A table of dis-tortions of the small field was set up from 30 frames taken in the direction of Omega Centauri, and the corrections were applied to our measurements.
To complement our observational material we data-mined the public observational archives. We recollected a total of 789 additional NIR frames (see Table 2), obtained at various telescopes, that partially covered our field of work. These data allowed us to enlarge our field of work to about 0.5◦ × 0.5◦. Finally, we decided to also introduce the positions given by four global catalogues in our input data: USNO A2.0 (Monet 1998), 2MASS (Cutri et al. 2003), WISE (Wright et al. 2010), and Spitzer(DR4) (Gallagher et al. 2003). Although the precision of these catalogues is poor in view of the present observational ma-terial, they enlarge the time base of our data and help to rigidify the local reference system.
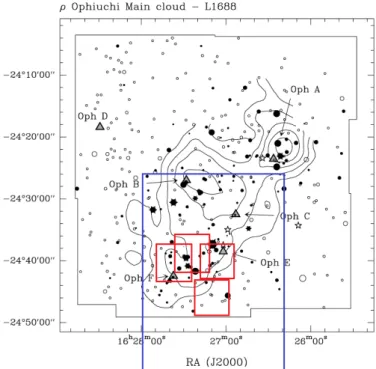
We present in Fig.1 the field studied in this project over-lapped on a map of the L1688 cloud from Bontemps et al.
(2001).
3. Data reduction
All the frames we collected were measured using a dedicated source extraction code (Viateau et al. 1999) that has been opti-mised for astrometry purposes. As the absorption is very high in the region covered by the project, many images did not con-tain a sufficient number of stars to fit a Point Spread Function (PSF). Therefore we used a two dimensional Gaussian to extract the positions.
We determined the proper motions through a global reduc-tion of the whole data set collected for this project (Ducourant & Rapaport 1991;Ducourant et al. 2007; Teixeira et al. 1992,
1998). This means that we simultaneously derived the stellar parameters (position and proper motion) for the objects and the
Table 2. List of frames used to determine the proper motions.
Epoch Telescope Instr. Nb Scale
yr frames 00/pixel 2000 NTT SOFI-SF 89 0.144 2000 NTT SOFI-LF 3 0.288 2001 NTT SOFI-SF 46 0.144 2001 NTT SOFI-LF 12 0.288 2002 NTT SOFI-SF 114 0.144 2003 NTT SOFI-SF 148 0.144 2003 NTT SOFI-LF 12 0.288 2004 NTT SOFI-SF 103 0.144 2004 NTT SOFI-LF 27 0.288 2009 NTT SOFI-LF 148 0.288 Auxiliary observations 2005 UKIRT WFCAM 12 0.402 2006 UKIRT WFCAM 2 0.211 2006 UKIRT WFCAM 7 0.402 2008 AAT Iris2 11 0.447 2004 CFHT 3.6 m Megacam 15 0.187 2006 CFHT 3.6 m Megacam 103 0.187 2007 CFHT 3.6 m Megacam 21 0.187 2011 CFHT 3.6 m Megacam 13 0.187 2007 Subaru Suprimecam 51 0.202 2008 KPNO 4.0 m NewFirm 79 0.395 2009 KPNO 4.0 m NewFirm 48 0.395 2006 CFHT WIRCam 425 0.303 Catalogues 1982 USNO A2.0 2000 2MASS 2004 Spitzer 2010 WISE
frame parameters of each of the 1437 frames. Beforehand the data were aligned on a common reference system with the help of an astrometric input reference catalogue.
The 2MASS catalogue (Cutri et al. 2003) (t0 ∼ 2000) is gen-erally a good option for this astrometric step since it is rather dense (about 11 000 sources per square degree on average on the entire sky) and its astrometric precision is acceptable (about 100−200 mas). Nevertheless, our project was spread over more than one decade and the 2MASS catalogue provides only posi-tions around the epoch 2000 and no proper moposi-tions. It is there-fore necessary to obtain proper motions estimates for this step, otherwise the dispersion of the proper motions after reduction is so large that no membership analysis can be performed.
3.1. Input astrometric reference catalogue
We then decided to set up an input astrometric reference cata-logue to align the plate measurements onto a common reference frame. We used the 2MASS positions collected in the work zone that we complemented with proper motions derived as follows. We first searched in the PPMXL (Roeser et al. 2010) and SPM4 (Girard et al. 2011) for visible counterparts of the 2MASS ob-jects and took the proper motion with the best internal precision when any was available. In this way, we were able to identify 259 objects. These objects typically lie at the periphery of our field where the absorption due to dust is much lower and objects are detectable in the visible wavelengths. For the vast majority of objects, which are only detectable in the infrared or NIR,
Fig. 1. Areas covered by the present proper motion catalogue overlaid on the map of the L1688 dark cloud fromBontemps et al.(2001). Red lines delimitate the NTT-SOFI observations and blue lines give the total extension of the catalogue including auxiliary data.
we combined the positions from 2MASS with those from the AllWISE data release (Cutri et al. 2013) (central epoch ∼ 2010), matched in a 300 search radius to estimate the proper motions. We excluded the AllWISE objects with a semi-major axis of the error ellipse larger than 200 mas, however. We derived more than six hundred proper motions estimates in the NIR in this way.
The resulting input astrometric catalogue contained positions and proper motions for about nine hundreds objects and was used to scale and rotate the 1437 frames and align them onto the axes of the input catalogue. The rescaled and rotated lists of mea-surements were then cross-correlated and compiled in a metalist that contained the measurements of each object in each image in which it was detected. This metalist contains 2205 objects.
3.2. Proper motions
Then the whole set of measurements of the objects detected in the ρ Ophiuchi region was globally reduced through a block-adjustment-type iterative procedure described inDucourant et al.
(2007,2008), which allowed us to simultaneously compute the unknown parameters of all stars (positions and proper motions) and the unknown plate parameters of all frames.
When we examined the residuals of the global fit as a func-tion of the observafunc-tions epochs, we observed that the residuals appeared to systematically deviate from the expected null mean value at three epochs. One deviation in 1982 corresponds to the USNO A2.0 positions (see Assafin et al. (2001) for an analy-sis of systematics of the USNO A2.0), another in 2004 corre-sponds to Spitzer positions and the last one in 2010 to the WISE positions. These deviations indicate a local systematic effect in these catalogues. We therefore applied the following corrections to these data, which correspond to the mean of the residuals: (∆α, ∆δ) = (−182, +86) mas for USNO A2.0 positions, (+152, −217) mas for Spitzer positions, and (+23, −137) mas for WISE positions. After applying these corrections, the input reference
Fig. 2.Histogram of internal precisions of our proper motion catalogue in the ρ Ophiuchi embedded cluster. The solid black line corresponds to the whole catalogue while the red filled histogram designates objects which benefit from SOFI data (SOFI catalogue).
catalogue that contains the proper motions based on WISE and 2MASS positions was regenerated using the modified positions, and the whole data set was reprocessed.
An a posteriori analysis of the derived proper motions showed evidence that the quality of the plate-to-plate transfor-mations was degraded in the regions where cluster members were too numerous with respect to field stars. We therefore de-cided to exclude objects with a much higher velocity than the mean velocity of field stars (as defined in Sect.5.1) from the plate-to-plate transformations because these objects are proba-bly cluster members or foreground stars.
We finally obtained positions and proper motions for 2213 objects spread over a 0.5◦ × 0.5◦ field. These objects are separated into two groups: 607 are located in a central region of 13.80 × 10.80and benefited from SOFI observations, while the remaining objects have proper motions derived only from aux-iliary data. We present the distribution of the internal precisions of our proper motions in Fig.2.
The spread of the precisions is the reflection of the historical material proper to each object and of its magnitude. It is obvious from this figure that the proper motions derived with the con-tribution of SOFI observations (red filled histogram) are more precise than the ones obtained from auxiliary data. The subsam-ple benefiting of the SOFI data will constitute the core of our catalogue that we will designate hereafter as the SOFI catalogue. 3.3. Photometry
LF SOFI observations were acquired in the J, H, Ks bands (central= (1.247, 16.653, 2.162) µ m, width = (0.290, 0.297, 0.275) µm) to complement the 2MASS photometry for fainter objects of the SOFI catalogue. We present the distribution of the Ks magnitudes of objects in our catalogue in Fig.3and list in Table 6 the J, H, Ks photometry from 2MASS or derived in this work for the kinematic members of the ρ Ophiuchi core (see
Fig. 3.Histogram of Ks magnitudes of the proper motion catalogue.
The black line correspond to the whole catalogue while the red filled histogram designates the SOFI catalogue.
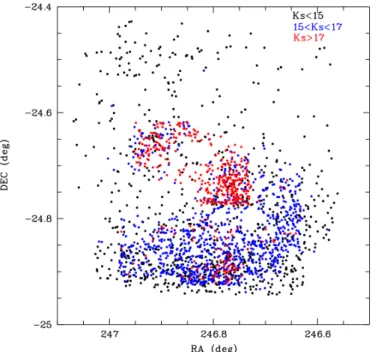
Fig. 4.Distribution on the sky of objects from our proper motion cata-logue with indication of their magnitude range.
next section for the membership determination) together with the AllWISE (Cutri et al. 2013) (w1, w2, w3, w4) photometry.
The SOFI catalogue explores the cluster down to much fainter magnitudes than the remaining catalogue and reaches Ks= 18.6 mag.
It is also interesting to note that the distribution on the sky of the various classes of magnitudes is not homogeneous, as shown in Fig.4. The faintest objects are essentially detected where the deeper SOFI observations are present and coincide with the clus-ter region where the extinction is high, while the brighclus-ter objects essentially lie at the periphery of the cluster.
4. Astrometric validation
It is difficult to asses the external errors of our catalogue be-cause two thirds of our catalogue concern objects that are in-visible at optical wavelengths and because to our knowledge, no astrometric proper motion reference catalogue exists in the NIR in this region. The recent release of the AllWISE cata-logue (Cutri et al. 2013) provides proper motion estimates in the NIR. Unfortunately, their quality is far too poor to be help-ful in a region such as the ρ Ophiuchi complex (the mean stan-dard error on these proper motions in the studied region is is σµ∼ 300 mas/yr).
4.1. Comparison to PPMXL and 2MASS catalogues
For the optical part of our catalogue, the densest comparison cat-alogue is the PPMXL catcat-alogue (Roeser et al. 2010). We note that the present work included some PPMXL proper motions as starting point of the iterative reduction process but the final catalogue should be more or less independent of it. Another dif-ficulty results from the fact that the 239 objects common to our catalogue and PPMXL are mostly concentrated at the southern edge of the field, which means that the cluster is almost com-pletely excluded from this comparison and only the brightest objects of our catalogue are concerned. Nevertheless, we per-formed the comparison of both sets of proper motions, and we noted a systematic mean difference (in the sense this work minus PPMXL) of (∆µαcos(δ),∆µδ)= (−1, +6) mas/yr.
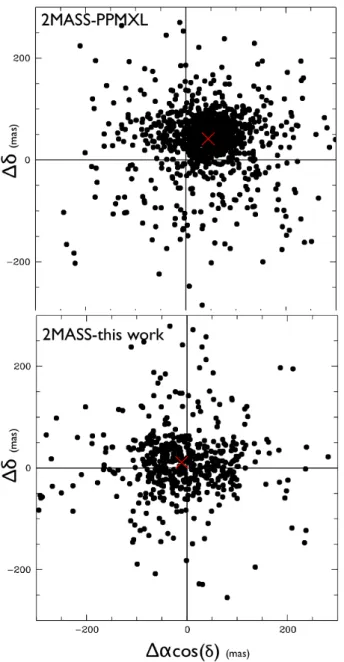
To determine the origin of the large systematic difference (essentially in declination), we considered the 2MASS cata-logue which provides positions for epoch ∼1999.3 with errors ∼100 mas and compared its positions to the PPMXL and to our catalogue, each transported to the 2MASS epoch by ap-plication of its own proper motions. We present these compar-isons in Fig.5. The resulting mean differences in position in the sense 2MASS minus catalogue are (+45, +41) mas for PPMXL (1321 objects) and (−11,+11) mas (504 objects) for this work.
When we assume that 2MASS provides positions without bias, we can conclude that both catalogues suffer from system-atic effects in their proper motions: ∼(+2.7, +2.5) mas/yr for PPMXL (mean epoch ∼1982.6) and ∼(+1.3, −1.3) mas/yr for this work (mean epoch ∼2007) and that a large part of the dif-ferences observed in the comparison of our proper motions with PPMXL is due to PPMXL.
We note that the PPMXL and the present catalogue incor-porated the 2MASS catalogue at some stage of their elabora-tion, which diminishes the impact of this comparison. Moreover, the comparisons presented in this section (PPMXL/this work, PPMXL/2MASS, this work/2MASS) do not rely on the same set of objects, and this may explain the larger systematic difference observed in the comparison of the PPMXL/this work.
4.2. Comparison to the Besançon Galaxy model
Another way to investigate the possible systematic effects con-tained in our catalogue is to compare its mean behaviour with that of theoretical predictions given by the Besançon Galaxy model simulations (Robin et al. 2003,2004) (this model does not include any cluster). For this purpose, we selected the set of 787 objects in our catalogue that are classified as field mem-bers in our memmem-bership analysis with a probability greater than 90% (see Sect. 5.1for the detail of filtering and membership probability calculation). When we compare the mean proper mo-tion of these stars to the Besançon simulamo-tion (Ks < 18.5 mag,
Fig. 5.Comparison of 2MASS positions with PPMXL positions (up-per panel) and with this work (lower panel) at 2MASS mean epoch (∼epoch 1999.3). Red crosses indicate the means of the distributions after a 3σ elimination.
d< 50 Kpc) we observe mean differences of about 0.5 mas/yr on both coordinates, which is coherent with the previous analysis of systematic effects.
4.3. Analysis of the kinematic properties of the cluster members
Recently, Wilking et al. (2015) published a very precise cat-alogue of relative proper motions in the ρ Ophiuchi cluster. They provided relative proper motions for field objects and for known cluster members and evaluated their median uncertain-ties to 0.60 mas yr−1in RA and 0.71 mas yr−1by analysing the dispersion of the proper motions of the known cluster members (the expected velocity dispersion in the cluster is about 1 km s−1 i.e., ∼1 mas/yr).
We applied the same method here and analysed the proper motion mean properties of the 68 cluster members (see Sect.5.1)
of our catalogue with the highest membership probabilities (Prob > 90%). The dispersion in proper motion is (σµαcos(δ), σµδ)= (4.7, 3.8) mas/yr. This result is representative of the ex-ternal precision of the present proper motion catalogue. After various investigations we concluded that the main limitation to the precision of our proper motions results from the inhomoge-neous spatial distribution of stars and the low quality of the input astrometric catalogue used to set up the scale and the orientation of the frames.
We also analysed the mean proper motion of field stars (prob-ability >90%) (see Sect. 5.1) in the various SOFI fields. We could observe that the mean properties of these stars varied from one region to the other by 1−2 mas/yr, indicating possible local systematic effects in our catalogue.
4.4. Conclusion on accuracy and systematic effects
From these various tests we can conclude that our catalogue has global systematic effects of ∼2 mas/yr. The spatial repartition of stars is uneven in the field and was the source of the problem dur-ing the plate-to-plate connection, essentially in the cluster zone, which generated local systematic effects in the proper motions of about 1−2 mas/yr, and degraded the accuracy. Moreover, the stars in the cluster zone are essentially faint, which complicates reducing the images even more; the resulting accuracy of these proper motions is therefore poorer than the internal errors might suggest.
5. Kinematic analysis
5.1. Membership analysis
To separate cluster members from field stars, we per-formed a membership analysis based on the results reported by Cabrera-Cano & Alfaro(1985). This paper, derived from
Sanders (1971), itself inspired by the method of Vasilevskis et al. (1958) allows establishing membership probabilities in open clusters from proper motion data. The model consists of a mixture of two normal bivariate distributions, a circular one for the cluster and an elliptic one for the field stars. The selec-tion of members and the derivaselec-tion of the kinematic properties of the two distributions are performed simultaneously through an iterative process and a 50% membership probability criterion. Hereafter we distinguish members that have a high probability (P > 0.9) from candidate members (0.5 < P < 0.9).
In the present work, the quality of proper motions is het-erogeneous and it seems reasonable to filter the best measured objects to derive the kinematic properties of the cluster and of the field. On the one hand, it may also be interesting to test any object of the catalogue for its membership to the F/E cores al-though its proper motion is not of high accuracy to have a census of members as complete as possible. This is why we performed our analysis in two steps.
We first selected the most reliable proper motions of our SOFI catalogue to derive the kinematic properties of the cluster and of the field, using objects with at least a time base of obser-vations of five years, with a number of obserobser-vations greater than 20, and with σµ ≤ 2 mas/yr. From these, we excluded proper motions higher than 45 mas/yr, which correspond to foreground objects that do not belong to the ρ Ophiuchi complex. This left us with 342 objects with highly accurate proper motions.
The membership analysis led to the following mean proper motions and precisions for the cluster derived with 48 members (µ∗
Fig. 6. Repartition of membership probabilities of the 936 objects. The filled black histogram corresponds to known YSOs (detected by ISO, Bontemps et al. 2001; or Spitzer,Evans et al. 2003) that are present in our catalogue. For visibility the y axis is truncated; the peak that corresponds to a probability of ∼0.05 culminates at 800 objects.
for µαcos δ) and for the field (µ∗α, µδ)f = (−3.5, −1.4) ± (0.4, 0.3) mas/yr. The kinematic values derived for field stars agree reasonably well with predictions from the Besançon Galaxy model simulations in the direction of our field: (µ∗α, µδ)= (−2, −2) mas/yr.
In a second step, we considered all the objects from our proper motion catalogue that were excluded from previous anal-ysis and selected those whose data were spread over five or more observational epochs with a time base of observations longer than six years and a precision better than 3.5 mas/yr. We then tested their membership to the two distributions and retained those with a probability greater than 50%.
We thus end up with 82 objects with a membership proba-bility to the cluster higher than 50%. We present the repartition of membership probabilities for the 936 objects analysed here in Fig.6. We observe in this figure two clear peaks that correspond to field population (P < 0.1) and cluster population (P > 0.9) and objects with intermediate probabilities. Sixty-eight objects have a probability P > 0.9 and are considered as members, while14 objects have a membership probability 0.5 < P < 0.9 and are classified as candidate members.
Membership analyses are very sensitive to outliers (e.g., foreground objects from the Galaxy with high proper motion) and need to be excluded to derive realistic solutions (see dis-cussion about the pruning of the data inCabrera-Cano & Alfaro 1985). We therefore excluded objects with µ∗αor µδ> 45 mas/yr at step one and objects with proper motions beyond 2.5σ of the mean properties of the cluster and of field at the end of step two. We present a list of objects in Table 5 that are considered as outliers despite their high membership probability (P > 0.9) be-cause their proper motion differs by more than 2.5σ from that of the cluster.
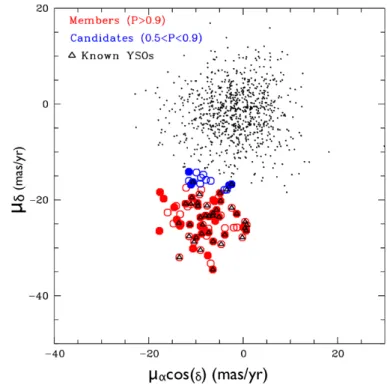
Fig. 7.Vector plot diagram. Red circles correspond to the kinematic members (P > 0.9) derived in this work, blue circles to candidate members (0.5 < P < 0.9). The black dots correspond to field objects (P < 0.1). Filled circles designate objects belonging to the SOFI cata-logue and triangles identify known YSOs detected by ISO or Spitzer.
Table 3. Mean spatial and kinematic properties of the ρ Ophiuchi F core as derived from the 68 kinematic members with the highest membership probability (P > 0.9). Property Value (α, δ) (16h27m22.51s, −24◦ 410 58.500 ) (µαcosδ, µδ) (−8.2, −24.3) ± 0.8 mas/yr (l, b) (352.9816◦ ,16.5540◦ ) (µlcos b, µb) (−23.8, −10.7) ± 0.8 mas/yr Position (X, Y, Z) (126.9, −15.6,+37.4) pc Velocity (U, V, W) (−5.9 ± 0.1, −14.2 ± 0.3, −8.1 ± 0.4) km s−1
Notes. The mean proper motion of the core given here does not ac-count for the probable systematic error (∼2 mas/yr) of our proper mo-tion catalogue.
The resulting mean kinematic properties of the cluster are listed in Table 3. We present the list of the members and candidate members with their astrometric solution and their membership probability in Table 7. Figure 7shows the vector plot diagram of the cluster and indicates the membership prob-ability, and Fig. 8 shows the distribution of field stars and of cluster members and candidate members across our field.
Figure7shows that the repartition of the kinematic members is globally circular, as expected. The dispersion of their proper motions (<5 mas/yr) is larger than expected from the astrophys-ical point of view (1−2 mas/yr) and reflects the difficulties of measuring proper motions in such obscured zones and the reality of our accuracy. Twenty-six members are young stellar objects (YSOs) that have been identified by ISO or Spitzer. Field stars
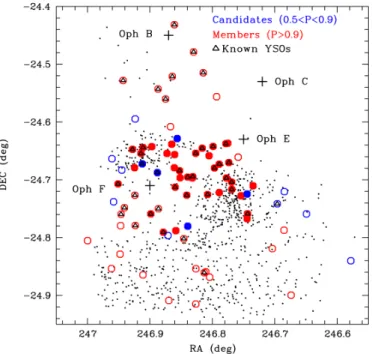
Fig. 8.Distribution on the sky of kinematic members, candidate mem-bers (0.5 < P < 0.9) and field stars with indication of the localisation of the B, C, E, and F cores of ρ Ophiuchi. Red circles correspond to the kinematic members (P > 0.9) derived in this work, blue circles to candidate members (0.5 < P < 0.9). Filled circles designate objects belonging to the SOFI catalogue and triangles identify known YSOs detected by ISO or Spitzer. The black dots correspond to field objects (P < 0.1).
and cluster members are separated in Fig.7by a layer of objects with intermediate membership probabilities (candidates).
5.2. New and known members
Of the 82 kinematic members or candidate members derived in this work, 56 are referenced at CDS as YSOs, the 26 oth-ers are new memboth-ers or new candidates. Of the known objects, 7 are brown dwarfs (BDs) (Alves de Oliveira et al. 2012), 1 is a BD candidate (FHTWIR-Oph 80, Alves de Oliveira et al. 2010), and 26 were found by the major spatial NIR-surveys ISO (Bontemps et al. 2001) or Spitzer (Evans et al. 2003).
The kinematic members are mostly located around the Oph F and E cores, with several new detections south to these cores. Some previously known members around Oph B core are also classified as kinematic members. The high concentration of kine-matic members in the central part of the field covered by this study corresponds to the zone of deep SOFI observations.
We present in Fig.9the repartition in terms of Ksmagnitudes of the 56 known and 26 new members.
The new members appear essentially fainter (down to Ks= 18.1) than the known members and were revealed by the deep Near-IR observations performed in this work.
We note that some well-attributed members of ρ Ophiuchi are not included in our list of kinematic members because their astrometry was too poor to analyse them.
5.3. Spatial velocities
We derived the Galactic coordinates (X towards the Galactic centre, Y in direction of Galactic rotation, Z towards the North
Fig. 9. Ksdistribution of known YSOs referenced at the CDS and new
kinematic members or candidates of the cluster.
Galactic Pole) and heliocentric space velocity of the cluster us-ing the most recent distance determination d = 133.3 ± 3.6 pc (Ortiz-Leon et al. 2015) and the median radial velocity for Oph pre-main-sequence stars (−6.3 ± 0.3) km s−1 (Prato 2007;
Guenther et al. 2007;Kurosawa 2007;James et al. 2006). We summarise in Table3the kinematic properties of the ρ Ophiuchi (F core).
We compared these values with the kinematic characteris-tics of the Upper Scorpius (US) association since the ρ Oph cluster is expected to be part of the Upper Sco association (see
Wilking et al. 2008). We observe that the velocity derived here for the cluster is very similar to the one that we derive for the sample of 117 members of Upper Sco OB2 group with H
ipparcos
measurements (de Zeeuw et al. 1999) (U, V, W)US= (−5.0, −14.8, −6.5) ± (0.1, 0.4, 0.2) km s−1.6. Classification
Of the 82 kinematic members or candidate members, 29 have been classified in terms of their spectral energy distribution (SED) into class I, II, or III (Bontemps et al. 2001; and
Gutermuth et al. 2009), but 53 of them appear to be unclassified. Some of these unclassified members are referenced as YSOs at the CDS.
Accordingly, we decided to perform a tentative classification into the three most significant YSO classes (I, II and III) using photometric data from Table6. If there are some contaminants in our kinematic members sample, then they will be incorrectly attributed to one of the three YSO classes since we assume here that each of the 82 members and candidates are YSOs.
For the classification we adopted a supervised learning method, whose principle is the following. The method consid-ers the various magnitudes of each previously classified mem-ber (J, H, Ks, w1, w2, w3, w4) and all their colour combinations (J − H, J − Ks, J − w1, etc.) and searches for regions in this magnitude-colour hyperspace that are occupied by members of a same class (I, II and III). When the parameters characterising these regions are “learned”, the algorithm considers the unclas-sified members and attributes a class to them depending on their localisation in this hyperspace.
● ● ● ● ● ● ● ●● ● ● ● ● ● ● ● ● ● ● ● ● ● ● ● ● ● ● ● ● ● ● ● ● ● ● ● ● ● ● ● ● ● ● ● ● ● ● ● ● ● ● ● ● ● ● ● ● ● ● ● ● ● ● ● ● ● ● ● ● ● ● ● ● ● ● ● ● ● ● ● ● ● ● ● ● ● ● ● ● ● ● ● ● ●●●●●●●●● ● ● ● 0.0 2.5 5.0 7.5 0.0 2.5 5.0 7.5 10.0 w1 − w4 [mag] K − w2 [mag] Class ● I − Train II − Train III − Train I − New II − New III − New
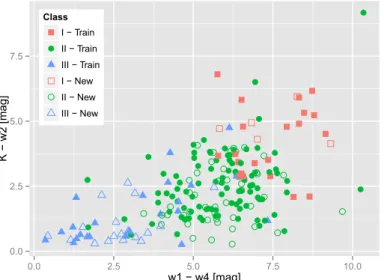
Fig. 10.One of the colour–colour diagrams for kinematic members us-ing 2MASS Ks and WISE w1, w2, and w4 photometry. Objects with
classes previously known in the literature that were used for the train-ing of the method (train) are shown with filled symbols and the objects we classified are shown with empty symbols. Squares refer to class I, circles to class II, and triangles to class III.
Of the various supervised methods available, we adopted the well-known and successful data classification non-parametric method called random forests (Breiman 2001; Breiman et al. 2003), complemented by a Monte Carlo trial to account for er-rors in the observable quantities. We adopted the R language im-plementation of random forests byLiaw & Wiener(2002), and to take all the errors of the available measurements into account, we followed a Monte Carlo approach, performing 30 000 inde-pendent classifications of the dataset. At each run the following process was performed: first the magnitudes of each star at each filter are sampled from Gaussian probability distribution func-tions with the mean equal to the measured (or imputed, see the paragraph below) value and the sigma equal to the measured (or imputed) magnitude error at the relevant filter; then all the possi-ble colour combinations between the filters J, H, K, w1, w2, w3 and w4 are computed; then a random forests classifier assigns a class to all the objects with unknown classes. Finally, after all the independent runs, the frequency that each object was assigned to each class is computed and the class with the greatest frequency is adopted as the object class.
A special approach had to be adopted because some data points were missing in our dataset (e.g., many objects were ob-served or detected only in some, but not all, of the 2MASS or WISE filters). The approach adopted was to perform data im-putation and Monte Carlo sampling of error distributions. The first step is to perform data imputation, but to avoid mixing the well-known objects with the most uncertain objects, we split the missing data imputation into two phases: first, the data im-putation was performed using all the objects with previously known classifications; then, the missing data imputation was per-formed considering all objects in our dataset. We adopted a non-parametric missing data imputation method called missForest (Stekhoven & Buehlmann 2012). This method is also based on a random forests algorithm to predict continuous missing val-ues from the observed valval-ues of all other objects in the dataset and from the relation of the object whose value is missing and all other objects considering the entire parameter space of the dataset. 0.000 0.025 0.050 0.075 0 5 10 15 20 Radius [arcmin] Density Class I II III
Fig. 11.Radial density plot. The projected densities of each class of YSOs are given in number of objects par arcmin2 and are displayed
versus the projected distance to the center [of each class.
The results of the classification performed here are rep-resented in one of the many possible colour-colour planes in Fig.10which shows that most of the objects lacking literature classification were assigned a class II status. Of the 53 unclassi-fied members or candidates, 16 were assigned a class III status, 32 a class II, and 5 a class I.
To analyse how probable it was to find a YSO of classes I, II, or III at a given distance from the center of the ρ Ophiuchi clus-ter F core, we built probability density estimations using kernel density estimators. The projected radii for the objects classified as members of each SED class were computed based on the an-gular distance between the positions of each object and the me-dian position of all member objects (Fig.11). The median pro-jected radii and the absolute median deviation for each type of object shows that the different classes present different prefer-ential projected radii and also different spread: RI = 5.6 ± 3.10, RII = 8.8 ± 4.50, RIII = 10.7 ± 5.30. These results indicate that the youngest objects are more concentrated in the central parts of the working zone (cores E and F), while more evolved objects are more spread towards the exterior.
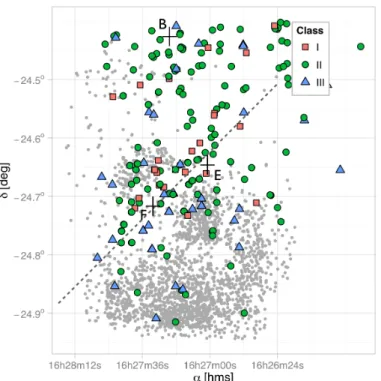
This is also visible in Fig.12, which displays the distribution on the sky of the objects of our proper motion catalogue and of the kinematic members. We observe that they are mostly located in the region of highest absorption where star-formation is on-going. We also note that class I objects are globally aligned on a northwest-southeast axis, mostly located in the most embedded region, which was proposed byMotte et al.(1998) to correspond to the perpendicular to the direction of shock propagation by the Upper Scorpius OB association onto the core of the ρ Oph cloud complex.
7. Nature of kinematic members and candidates
Of the 82 kinematic members and candidate members in the region we analysed, we proposed a classification for 53 ob-jects. Six objects (2MASS-6X J16271965-2441487, 2MASS J16272439-2441475, 2MASS J16272661-2440451, 2MASS J16273272-2445004, 2MASS J16274161-2446447, and 2MASS J16273894-2440206) have been listed byAlves de Oliveira et al.
(2010) as potential brown dwarfs (BDs) based on their position in a colour-magnitude diagram among the faintest, red objects.
Fig. 12.Distribution on the sky of objects from our proper motions cata-logue (grey dots) and of the 82 kinematic members and candidates of the ρ Ophiuchi cluster (coloured symbols) derived in this work. Red squares designate class I, green circles class II and blue triangles class III. The zones with few grey dots correspond to the most obscure regions. Crosses indicate the approximative centres of the E, F, and B cores; the dotted line indicates the line of clumps and YSOs identified byMotte et al.(1998).
That we can kinematically confirm that they are part of the clus-ter indicates that they are probably BDs.
Using the typical IR excesses in J, H, and K bands for class II and class III YSOs and the extinction law in near-IR as in Bontemps et al. (2001), we derived the absolute J and Hmagnitudes for the kinematic members and candidates mem-bers1. We present the distribution of these H absolute magnitudes for known members (black dotted histogram) and new members (red) in Fig.13.
As expected, most of the new members are weak sources with MHranging from 5 to 12. Since the transition between stars and BDs occurs at MH ∼ 5 mag, that is, MJ∼ 6 mag for young clusters (e.g.,Baraffe et al. 2015), virtually all the new members fall in the substellar regime. The MH values of the seven spec-troscopically confirmed BDs in ρ Ophiuchi are also indicated in Fig.13together with their spectral type. Above MH = 5 mag, we find 23 new substellar members, which is 3.3 times more than previously known BDs in the surveyed area.
The weakest four new members (UGCS J162746.78-244059.1, BX162727602-24381862, UGCS J162700.96-244339.5, and 2MASS-6X J16265864-2443281) with MH ≥ 11 mag are potentially very low mass BDs that reach spectral types as cool as L0 (∼2200 K, see discussions in
Tottle & Mohanty 2015). These cool young BDs are expected to be very low mass of only about 10 MJup(Chabrier et al. 2000).
We summarise the evolutionary status of the 82 members and candidates in Table4. Seven members already known as YSOs 1 One new member (WISE J162702.05-243938.6) was detected in
only one near-IR band therefore we were unable to derive its absolute magnitudes.
Fig. 13. Distribution of absolute H magnitudes of known (black dot-ted) and new (solid red) members. Spectroscopically confirmed brown dwarfs byAlves de Oliveira et al.(2012) are indicated together with their spectral type.
Table 4. Summary of evolutionary status of the 82 kinematic members and candidates.
Status Members Candidates
56 known YSOs (CDS) Class I 4 0 Class II 34 2 Class III 13 3 26 new YSOs Class I 2 3 Class II 11 5 Class III 4 1
are identified BD (Alves de Oliveira et al. 2012) and 6 new YSOs are BD candidates (Alves de Oliveira et al. 2010).
8. Conclusions
With our astrometric observations we have determined the proper motions of 2213 stellar and sub-stellar objects in the ρ Ophiuchi cluster region. We performed a kinematic member-ship analysis and derived a list of 82 kinematic members and candidate members, 26 of them are new members. We estab-lished in a reliable way the mean kinematic properties of the L1688 dark cloud (µαcos δ, µδ) = (−8.2, −24.3) ± 0.8 mas/yr and confirm that the velocity of this core is very similar to the one of the Upper Scorpius association.
We assigned a SED class to the 53 unclassified kinematic members or candidates using a non-parametric random forests supervised method for classifying objects using any combina-tion of the (J, H, K, w1, w2, w3 and w4) 2MASS and AllWISE colours. Nine objects are defined as class I, 52 as class II, and 21 objects as class III.
Table 5. Astrometric parameters of a list of outliers with a high membership probability (P > 0.9) excluded from members because their proper motion is beyond 2.5σ of the mean proper motion of the cluster.
Object RA Dec µα∗ µδ 2MASS Ks Prob
[h m s] [◦ 0 00] [mas/yr] [mas/yr] [mag] 2MASSJ16265636-2441204 16 26 56.35 –24 41 20.37 -0.740 ± 1.27 –40.640 ± 1.18 12.907 1.00 2MASSJ16265904-2435568 16 26 59.05 –24 35 56.92 5.400 ± 1.59 –28.290 ± 2.19 9.993 0.99 2MASSJ16271877-2456063 16 27 18.77 –24 56 06.42 5.090 ± 2.81 –23.170 ± 2.84 14.910 0.97 2MASSJ16272197-2429397 16 27 21.98 –24 29 39.76 6.110 ± 2.84 –25.770 ± 2.16 0.000 0.99 2MASSJ16272463-2429353 16 27 24.63 –24 29 35.39 7.190 ± 2.30 –27.350 ± 2.67 0.000 0.99 BX162725643-24372840 16 27 25.64 –24 37 28.41 –16.750 ± 0.99 –34.760 ± 1.12 13.996 1.00 2MASSJ16272693-2440508 16 27 26.93 –24 40 50.87 –22.240 ± 0.67 –22.350 ± 0.88 5.007 1.00 UGSC162728.13-243719.5 16 27 28.14 –24 37 19.59 –17.450 ± 2.38 –16.610 ± 2.49 0.000 0.92 2MASSJ16273213-2429435 16 27 32.14 –24 29 43.59 –10.360 ± 1.93 –36.750 ± 2.60 10.740 1.00 2MASSJ16273724-2442380 16 27 37.24 –24 42 38.01 4.580 ± 1.27 –21.260 ± 1.29 7.856 0.92 2MASSJ16275191-2446296 16 27 51.92 –24 46 29.54 –13.080 ± 1.95 –36.840 ± 2.02 9.314 1.00
Notes. µα∗ stands for µαcos(δ). Objects not detected by 2MASS or WISE were searched in the 2MASS 6X (Cutri & IPAC/WISE Science
Data Center Team 2012) and the UKIDSS (Lawrence et al. 2007) catalogues and attributed their identificators. A local identificator (BXhhmmss.sss+dddmmss.ss) was attributed to the faintest source not found in these catalogues.
Table 6. Photometry given by 2MASS (J, H, K) and Allwise (w1, w2, w3, w4) for the kinematic members (as determined in Sect.5.1) of the ρ Ophiuchi cluster. Name J σJ H σH Ks σKs w1 σw1 w2 σw2 w3 σw3 w4 σw4 2MASS J16264172-2453586 14.791 0.039 14.104 0.039 13.740 0.045 13.604 0.032 13.293 0.041 11.997 0.490 7.866 2MASS J16264441-2447138 11.833 0.022 10.997 0.022 10.635 0.021 10.417 0.023 10.219 0.021 9.462 0.100 7.414 0.196 2MASS J16264890-2449087 16.306 0.100 14.846 0.072 14.206 0.068 13.789 0.058 13.556 0.070 10.614 7.212 0.388 2MASS-6X J16265634-2442375 17.772 0.188 16.591 0.142 15.759 0.131 2MASS J16265843-2445318 10.365 0.030 8.635 0.090 7.549 0.046 6.991 0.120 5.984 0.096 3.557 0.059 1.217 0.069 2MASS J16265861-2446029 15.353 0.047 13.966 0.035 13.314 0.027 UGCS J162700.96-244339.5 *19.456 0.000 *17.945 0.037 *17.066 0.000
Notes. The full table is available at the CDS. Values preceded by an asterisk were derived in this work (for J, H, Ks) and come from WISE (Wright et al. 2010) (for w1, w2, w3, w4). Objects not detected by 2MASS or WISE were searched in the 2MASS 6X (Cutri & IPAC/WISE Science Data Center Team 2012) and the UKIDSS (Lawrence et al. 2007) catalogues and attributed their identificators. A local identificator (BXhhmmss.sss+dddmmss.ss) was attributed to the faintest source not found in these catalogues.
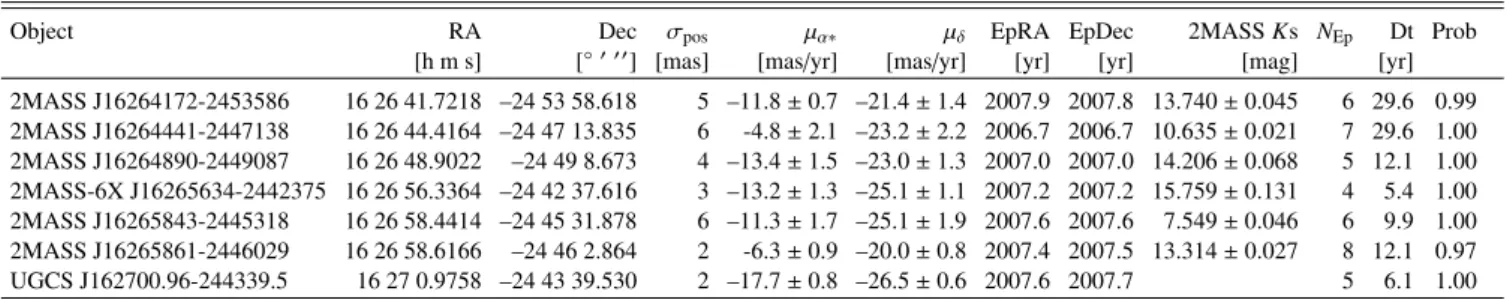
Table 7. Astrometric parameters of the kinematic members derived in this work with their associated membership probability.
Object RA Dec σpos µα∗ µδ EpRA EpDec 2MASS Ks NEp Dt Prob
[h m s] [◦ 0 0 0] [mas] [mas/yr] [mas/yr] [yr] [yr] [mag] [yr]
2MASS J16264172-2453586 16 26 41.7218 –24 53 58.618 5 –11.8 ± 0.7 –21.4 ± 1.4 2007.9 2007.8 13.740 ± 0.045 6 29.6 0.99 2MASS J16264441-2447138 16 26 44.4164 –24 47 13.835 6 -4.8 ± 2.1 –23.2 ± 2.2 2006.7 2006.7 10.635 ± 0.021 7 29.6 1.00 2MASS J16264890-2449087 16 26 48.9022 –24 49 8.673 4 –13.4 ± 1.5 –23.0 ± 1.3 2007.0 2007.0 14.206 ± 0.068 5 12.1 1.00 2MASS-6X J16265634-2442375 16 26 56.3364 –24 42 37.616 3 –13.2 ± 1.3 –25.1 ± 1.1 2007.2 2007.2 15.759 ± 0.131 4 5.4 1.00 2MASS J16265843-2445318 16 26 58.4414 –24 45 31.878 6 –11.3 ± 1.7 –25.1 ± 1.9 2007.6 2007.6 7.549 ± 0.046 6 9.9 1.00 2MASS J16265861-2446029 16 26 58.6166 –24 46 2.864 2 -6.3 ± 0.9 –20.0 ± 0.8 2007.4 2007.5 13.314 ± 0.027 8 12.1 0.97 UGCS J162700.96-244339.5 16 27 0.9758 –24 43 39.530 2 –17.7 ± 0.8 –26.5 ± 0.6 2007.6 2007.7 5 6.1 1.00
Notes. The full table is available at the CDS. Colums (7) and (8) provide the mean epoch corresponding to the J2000 RA, Dec positions, Col. (10) lists the number of epochs of the observations, Col. (11) their time base and Col. (12) the membership probability. µα∗stands for µαcos(δ).
Note that Ks magnitudes without error are just estimative. Objects not detected by 2MASS or WISE were searched in the 2MASS 6X (Cutri & IPAC/WISE Science Data Center Team 2012) and the UKIDSS (Lawrence et al. 2007) catalogues and attributed their identificators. A local identificator (BXhhmmss.sss+dddmmss.ss) was attributed to the faintest source not found in these catalogues.
We discovered 23 new BDs candidates as part of the cluster, potentially multiplying the number of known BDs in ρ Ophiuchi cluster by 3.3. A few of them might be extremely low mass BDs in the 10 MJupregime.
We were able to establish a secondary astrometric refer-ence frame in the NIR in a region where referrefer-ence stars in the
large existing astrometric catalogues can hardly be found. The Gaiacatalogue will undoubtedly be a valuable tool for study-ing associations of young stars, as H
ipparcos
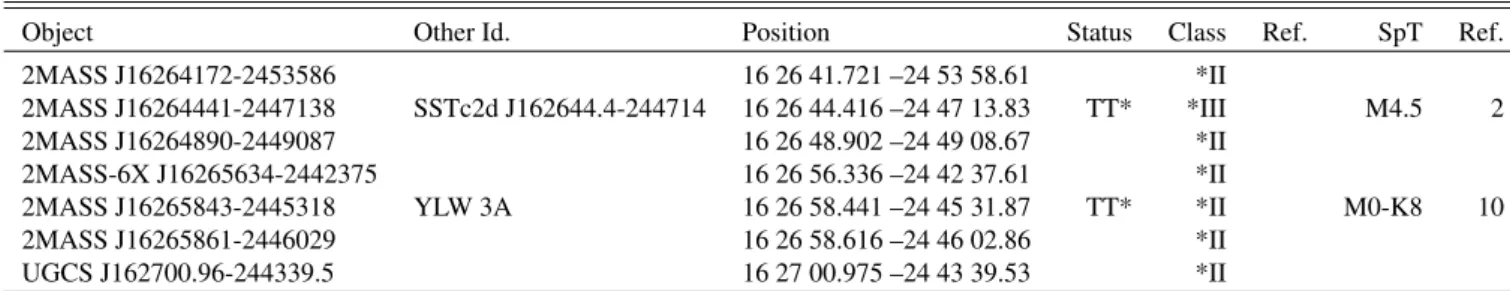
was in its time. For a clear view of the star-formation processes and to ac-cess the youngest clusters (<a few Myr), infrared astrometric catalogues will be the crucial tool, however. The future spaceTable 8. Evolutionary status of the kinematic members.
Object Other Id. Position Status Class Ref. SpT Ref.
2MASS J16264172-2453586 16 26 41.721 –24 53 58.61 *II
2MASS J16264441-2447138 SSTc2d J162644.4-244714 16 26 44.416 –24 47 13.83 TT* *III M4.5 2
2MASS J16264890-2449087 16 26 48.902 –24 49 08.67 *II
2MASS-6X J16265634-2442375 16 26 56.336 –24 42 37.61 *II
2MASS J16265843-2445318 YLW 3A 16 26 58.441 –24 45 31.87 TT* *II M0-K8 10
2MASS J16265861-2446029 16 26 58.616 –24 46 02.86 *II
UGCS J162700.96-244339.5 16 27 00.975 –24 43 39.53 *II
Notes. The full table is available at the CDS. Columns (1) and (2) provide identifications of the objects. Column (3) (status) lists YSO status as given by CDS-Simbad and Col. (4) (Class) the SED class of the object (classes preceded by an asterisk were assigned in this work). The corresponding references are given in Col. (5) . In Col. (6) we list the spectral type found in the litterature and in Col. (7) the references. Objects not detected by 2MASS or WISE were searched in the 2MASS 6X (Cutri & IPAC/WISE Science Data Center Team 2012) and the UKIDSS (Lawrence et al. 2007) catalogues and attributed their identificators. A local identificator (BXhhmmss.sss+dddmmss.ss) was attributed to the faintest source not found in these catalogues. a) This object is classified as class II byBontemps et al.(2001) but was classified as class III by our algorithm. b) This object is classified as class I byBontemps et al.(2001) but was classified as class II by our algorithm.
References. (1)Muži´c et al.(2012); (2)Wilking et al.(2008); (3)Bontemps et al.(2001); (4)Cieza et al.(2007); (5)Pillitteri et al.(2010); (6)Wilking et al.(2005); (7)Ozawa et al.(2005); (8)Erickson et al.(2011); (9)Alves de Oliveira & Casali(2008); (10)Martin et al.(1998); (11)Luhman & Rieke(1999); (12)Simon et al.(1995); (13)Gutermuth et al.(2009); (14)Parks et al.(2014); (15)Natta et al.(2002); (16)Andrews & Williams(2007); (17)Furlan et al.(2009); (18)Natta et al.(2006); (19)Alves de Oliveira et al.(2012); (20)Dodson-Robinson & Salyk(2011); (21)Rodríguez-Ledesma et al.(2013); (22)Gutermuth et al.(2009).
infrared astrometric mission Jasmine (Gouda et al. 2005) may in this respect be the first to bring insight into embedded star-forming regions. The secondary reference frame established in this work is a first step on this way.
Acknowledgements. We are grateful to E. Moraux and C. Alves de Oliveira for providing us with CFHT observational material. We acknowledge par-tial financial support from the French organisation COFECUB and the Brazilian organisation FAPESP and CAPES. This research has made use of the SIMBAD database, operated at CDS, Strasbourg, France. This publica-tion makes use of data products from the Wide-field Infrared Survey Explorer, which is a joint project of the University of California, Los Angeles, and the Jet Propulsion Laboratory/California Institute of Technology, funded by the National Aeronautics and Space Administration. This publication makes use of data products from the Two Micron All Sky Survey, which is a joint project of the University of Massachusetts and the Infrared Processing and Analysis Center/California Institute of Technology, funded by the National Aeronautics and Space Administration and the National Science Foundation.
References
Alves de Oliveira, C., & Casali, M. 2008,A&A, 485, 155
Alves de Oliveira, C., Moraux, E., Bouvier, J., et al. 2010,A&A, 515, A75
Alves de Oliveira, C., Moraux, E., Bouvier, J., & Bouy, H. 2012,A&A, 539, A151
Alves de Oliveira, C., Ábrahám, P., Marton, G., et al. 2013,A&A, 559, A126
André, P., Belloche, A., Motte, F., & Peretto, N. 2007,A&A, 472, 519
Andrews, S. M., & Williams, J. P. 2007,ApJ, 671, 1800
Assafin, M., Andrei, A. H., Martins, R. V., et al. 2001,ApJ, 552, 380
Baraffe, I., Homeier, D., Allard, F., & Chabrier, G. 2015,A&A, 577, A42
Boehle, A., Ghez, A. M., Schödel, R., et al. 2016,ApJ, 830, 17
Bontemps, S., André, P., Kaas, A. A., et al. 2001,A&A, 372, 173
Bouy, H., Bertin, E., Moraux, E., et al. 2013,A&A, 554, A101
Bouy, H., Bertin, E., Barrado, D., et al. 2015,A&A, 575, A120
Breiman, L. 2001,Machine Learning, 45, 5
Breiman, L., Last, M., & Rice, J. 2003, in Statistical Challenges in Astronomy (New York: Springer), 243
Cabrera-Cano, J., & Alfaro, E. J. 1985,A&A, 150, 298
Cesarsky, C. J., Abergel, A., Agnese, P., et al. 1996,A&A, 315, L32
Chabrier, G., Baraffe, I., Allard, F., & Hauschildt, P. 2000,ApJ, 542, 464
Cieza, L., Padgett, D. L., Stapelfeldt, K. R., et al. 2007,ApJ, 667, 308
Cutri, R. M., & IPAC/WISE Science Data Center Team 2012, inAAS Meeting Abstracts, 219, 401.06
Cutri, R. M., Skrutskie, M. F., van Dyk, S., et al. 2003,VizieR Online Data Catalog: II/246
Cutri, R. M., Wright, E. L., Conrow, T., et al. 2013, Explanatory Supplement to the AllWISE Data Release Products, Tech. Rep.
Dawson, P., Scholz, A., Ray, T. P., et al. 2014,MNRAS, 442, 1586
de Zeeuw, P. T., Hoogerwerf, R., de Bruijne, J. H. J., Brown, A. G. A., & Blaauw, A. 1999,AJ, 117, 354
Do, T., Martinez, G. D., Yelda, S., et al. 2013,ApJ, 779, L6
Dodson-Robinson, S. E., & Salyk, C. 2011,ApJ, 738, 131
Ducourant, C., & Rapaport, M. 1991,A&A, 241, 303
Ducourant, C., Teixeira, R., Hambly, N. C., et al. 2007,A&A, 470, 387
Ducourant, C., Teixeira, R., Chauvin, G., et al. 2008,A&A, 477, L1
Eckart, A., Muži´c, K., Yazici, S., et al. 2013,A&A, 551, A18
Erickson, K. L., Wilking, B. A., Meyer, M. R., Robinson, J. G., & Stephenson, L. N. 2011,AJ, 142, 140
Evans, II, N. J., Allen, L. E., Blake, G. A., et al. 2003,PASP, 115, 965
Fritz, T., Gillessen, S., Trippe, S., et al. 2010,MNRAS, 401, 1177
Fritz, T. K., Chatzopoulos, S., Gerhard, O., et al. 2016,ApJ, 821, 44
Furlan, E., Watson, D. M., McClure, M. K., et al. 2009,ApJ, 703, 1964
Gallagher, D. B., Irace, W. R., & Werner, M. W. 2003, in IR Space Telescopes and Instruments, ed. J. C. Mather,SPIE Conf. Ser., 4850, 17
Girard, T. M., van Altena, W. F., Zacharias, N., et al. 2011,AJ, 142, 15
Gouda, N., Yano, T., Yamada, Y., et al. 2005, in The Three-Dimensional Universe with Gaia, eds. C. Turon, K. S. O’Flaherty, & M. A. C. Perryman,ESA SP Publ., 576, 77
Guenther, E. W., Esposito, M., Mundt, R., et al. 2007,A&A, 467, 1147
Gutermuth, R. A., Megeath, S. T., Myers, P. C., et al. 2009,ApJS, 184, 18
James, D. J., Melo, C., Santos, N. C., & Bouvier, J. 2006,A&A, 446, 971
Kurosawa, R. 2007, in Multiplicity in Star Formation, Conf. Toronto, 30 Lada, C. J., & Lada, E. A. 2003,ARA&A, 41, 57
Lawrence, A., Warren, S. J., Almaini, O., et al. 2007,MNRAS, 379, 1599
Liaw, A., & Wiener, M. 2002,R News, 2, 18
Lindegren, L. 2010, in IAU Symp. 261, eds. S. A. Klioner, P. K. Seidelmann, & M. H. Soffel, 296
Lodieu, N. 2013,MNRAS, 431, 3222
Luhman, K. L. 2012,ARA&A, 50, 65
Luhman, K. L., & Mamajek, E. E. 2012,ApJ, 758, 31
Luhman, K. L., & Rieke, G. H. 1999,ApJ, 525, 440
Ma, C., Arias, E. F., Eubanks, T. M., et al. 1998,AJ, 116, 516
Martin, E. L., Montmerle, T., Gregorio-Hetem, J., & Casanova, S. 1998,
MNRAS, 300, 733
Mignard, F., Bailer-Jones, C., Bastian, U., et al. 2008, in IAU Symp. 248, eds. W. J. Jin, I. Platais, & M. A. C. Perryman, 224
Monet, D. G. 1998,BAAS, 30, 1427
Motte, F., Andre, P., & Neri, R. 1998,A&A, 336, 150
Natta, A., Testi, L., Comerón, F., et al. 2002,A&A, 393, 597
Muži´c, K., Scholz, A., Geers, V., Jayawardhana, R., & Tamura, M. 2012,ApJ, 744, 134
Natta, A., Testi, L., & Randich, S. 2006,A&A, 452, 245
Ortiz-Leon, G. N., et al. 2015, ApJ, submitted
Ozawa, H., Grosso, N., & Montmerle, T. 2005,A&A, 429, 963
Peña Ramírez, K., Zapatero Osorio, M. R., & Béjar, V. J. S. 2015,A&A, 574, A118
Peña Ramírez, K., Béjar, V. J. S., & Zapatero Osorio, M. R. 2016,A&A, 586, A157
Perryman, M. A. C., de Boer, K. S., Gilmore, G., et al. 2001,A&A, 369, 339
Pillitteri, I., Sciortino, S., Flaccomio, E., et al. 2010,A&A, 519, A34
Prato, L. 2007,ApJ, 657, 338
Preibisch, T., Zeidler, P., Ratzka, T., Roccatagliata, V., & Petr-Gotzens, M. G. 2014,A&A, 572, A116
Robin, A. C., Reylé, C., Derrière, S., & Picaud, S. 2003,A&A, 409, 523
Robin, A. C., Reylé, C., Derrière, S., & Picaud, S. 2004,A&A, 416, 157
Rodríguez-Ledesma, M. V., Mundt, R., Pintado, O., et al. 2013,A&A, 551, A44
Roeser, S., Demleitner, M., & Schilbach, E. 2010,AJ, 139, 2440
Sanders, W. L. 1971,A&A, 14, 226
Simon, M., Ghez, A. M., Leinert, C., et al. 1995,ApJ, 443, 625
Soderblom, D. R., Hillenbrand, L. A., Jeffries, R. D., Mamajek, E. E., & Naylor, T. 2014,Protostars and Planets VI, 219
Stekhoven, D., & Buehlmann, P. 2012,Bioinformatics, 28, 112
Teixeira, R., Requieme, Y., Benevides-Soares, P., & Rapaport, M. 1992,A&A, 264, 307
Teixeira, R., Camargo, J. I. B., Benevides-Soares, P., & Requieme, Y. 1998,
A&A, 333, 1107
Tottle, J., & Mohanty, S. 2015,ApJ, 805, 57
Vasilevskis, S., Klemola, A., & Preston, G. 1958,AJ, 63, 387
Viateau, B., Réquième, Y., Le Campion, J. F., et al. 1999,A&AS, 134, 173
Vrba, F. J., Henden, A. A., Luginbuhl, C. B., et al. 2004,AJ, 127, 2948
Vrba, F. J., Munn, J. A., Luginbuhl, C. B., et al. 2012,J. Am. Assoc. Variable Star Observers (JAAVSO), 40, 434
Wilking, B. A., Meyer, M. R., Robinson, J. G., & Greene, T. P. 2005,AJ, 130, 1733
Wilking, B. A., Gagné, M., & Allen, L. E. 2008, in Handbook of Star Forming Regions, Vol. II, ed. B. Reipurth (San Francisco, CA: ASP), 351
Wilking, B. A., Vrba, F. J., & Sullivan, T. 2015,ApJ, 815, 2