HAL Id: hal-00318098
https://hal.archives-ouvertes.fr/hal-00318098
Submitted on 3 Jul 2006
HAL is a multi-disciplinary open access
archive for the deposit and dissemination of
sci-entific research documents, whether they are
pub-lished or not. The documents may come from
teaching and research institutions in France or
abroad, or from public or private research centers.
L’archive ouverte pluridisciplinaire HAL, est
destinée au dépôt et à la diffusion de documents
scientifiques de niveau recherche, publiés ou non,
émanant des établissements d’enseignement et de
recherche français ou étrangers, des laboratoires
publics ou privés.
Observations of high-velocity SAPS-like flows with the
King Salmon SuperDARN radar
A. V. Koustov, R. A. Drayton, R. A. Makarevich, K. A. Mcwilliams, J.-P.
St-Maurice, T. Kikuchi, H. U. Frey
To cite this version:
A. V. Koustov, R. A. Drayton, R. A. Makarevich, K. A. Mcwilliams, J.-P. St-Maurice, et al..
Observa-tions of high-velocity SAPS-like flows with the King Salmon SuperDARN radar. Annales Geophysicae,
European Geosciences Union, 2006, 24 (6), pp.1591-1608. �hal-00318098�
Ann. Geophys., 24, 1591–1608, 2006 www.ann-geophys.net/24/1591/2006/ © European Geosciences Union 2006
Annales
Geophysicae
Observations of high-velocity SAPS-like flows with the King Salmon
SuperDARN radar
A. V. Koustov1, R. A. Drayton1, R. A. Makarevich2, K. A. McWilliams1, J.-P. St-Maurice1, T. Kikuchi3, and H. U. Frey4
1Institute of Space and Atmospheric Studies, University of Saskatchewan, 116 Science Place, Saskatoon, S7N 5E2, Canada 2Department of Physics, La Trobe University, Victoria 3086, Australia
3Solar-Terrestrial Environment Laboratory, University of Nagoya, 3-13 Honohara, Toyokawa, Aichi 442, Japan 4Space Sciences Laboratory, University of California, Berkley, CA 94720-7450, USA
Received: 14 September 2005 – Revised: 20 April 2006 – Accepted: 12 May 2005 – Published: 3 July 2006
Abstract. In this study, a focused investigation of the
po-tential for the King Salmon (KS) SuperDARN HF radar to monitor high-velocity flows near the equatorial edge of the auroral oval is undertaken. Events are presented with line-of-sight velocities as high as 2 km/s, observed roughly along the L-shell. Statistically, the enhanced flows are shown to be typical for the dusk sector (16:00–23:00 MLT), and the average velocity in this sector is larger (smaller) for winter (summer) conditions. It is also demonstrated that the high-velocity flows can be very dynamical with more localized enhancements existing for just several minutes. These short-lived enhancements occur when the luminosity at the equa-torial edge of the auroral oval suddenly decreases during the substorm recovery phase. The short-lived velocity enhance-ments can be established because of proton and ion injec-tions into the inner magnetosphere and low conductance of the ionosphere and not because of enhanced tail reconnec-tion. This implies that some KS velocity enhancements have the same origin as subauroral polarization streams (SAPS).
Keywords. Ionosphere (Plasma convection: Ionospheric
ir-regularities: Auroral ionosphere)
1 Introduction
Observations of ionospheric plasma convection at sub-auroral latitudes showed the occasional occurrence of ex-tremely fast flows of more than 2–3 km/s (e.g. Galperin et al., 1973; Anderson et al., 1991, 1993, 2001; Yeh et al., 1991; Karlsson et al., 1998; Foster and Vo, 2002; Carpenter and Lemaire, 2004). Such flows are believed to be stretched in the magnetic L shell direction over a significant portion of the dusk ionosphere (Anderson et al., 1991; Foster and Vo, 2002). Some of the flows are very strong and localized in
Correspondence to: A. V. Koustov
latitude, covering less than half a degree of magnetic latitude (Anderson, 1991) while others are less intense but more ex-tended, spanning over several degrees of magnetic latitude (Yeh et al., 1991; Foster and Vo, 2002). Events were identi-fied for which the flow exhibited two maxima in its latitudinal profile; one enhancement at relatively high latitudes, around the expected location of the auroral oval, and the other one at much lower latitudes (Spiro et al., 1979; Yeh et al., 1991; Anderson et al., 2001). It was suggested to use a common term, sub-auroral polarization streams (SAPS), to character-ize enhanced flows equatorward of the auroral oval (Foster and Burke, 2002). It is believed that SAPS occur because of energetic ion and proton injections into the inner mag-netosphere/plasmasphere and the setting up of radial polar-ization electric fields. An important factor in establishing a strong polarization electric field is the low conductance of the ionosphere at subauroral latitudes, so that the Region 2 field-aligned currents driven by particle pressure in the inner mag-netosphere can be closed through perpendicular ionospheric currents and thus support a strong northward electric field and westward convection of the ionospheric plasma. These processes are more frequent during magnetic storms (e.g. Galperin, 2002; Carpenter and Lemaire, 2004). Persistent correlation of SAPS with substorm occurrence has also been reported (e.g. Anderson et al., 1993; Galperin, 2002), but it is generally expected that any tail convection enhancement that accelerates particles can potentially lead to SAPS formation (e.g. Anderson, 2001; Ridley and Liemohn, 2002).
SAPS have been traditionally studied with the Defense Meteorological Satellite Program (DMSP) satellite ion drift and precipitation data. However, satellite measurements are rather episodic, as it takes approximately 100 min for a satel-lite to return to the same latitude, and the combination of three satellites often does not help because of a large longi-tudinal separation between them. In this respect, SAPS mon-itoring with ground-based radars is advantageous because these measurements can be taken continuously.
1592 A. V. Koustov et al. : Observations of high-velocity SAPS-like flows22
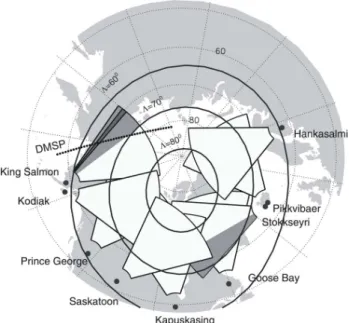
Figure 1. Fields of view (FoV) of the northern hemisphere SuperDARN radars (between 400 and 2800 km), the part of the King Salmon (KS) radar observational area (light shading, beams 0-5) from where the measurements were statistically analyzed in this study and footprints (at a height of 300 km) of DMSP F15 satellite for a pass near the KS FoV. The darker shading within the King Salmon FoV indicates the orientation of beam #1. Light shading within the Stokkseyri radar FoV shows the area (beams 0-5) from where the measurements were statistically analyzed for comparison with the KS data.
Fig. 1. Fields of view (FoV) of the Northern Hemisphere
Super-DARN radars (between 400 and 2800 km), the part of the King Salmon (KS) radar observational area (light shading, beams 0–5) from where the measurements were statistically analyzed in this study and footprints (at a height of 300 km) of DMSP F15 satel-lite for a pass near the KS FoV. The darker shading within the King Salmon FoV indicates the orientation of beam #1. Light shading within the Stokkseyri radar FoV shows the area (beams 0–5) from where the measurements were statistically analyzed for a compari-son with the KS data.
In the past, the Millstone Hill (MH) incoherent scatter radar has been successfully used to study SAPS (Yeh et al., 1991; Foster and Vo, 2002; Erickson et al., 2002; Foster et al., 2005). Another opportunity to study SAPS is to uti-lize the Super Dual Auroral Radar Network (SuperDARN) HF radars (Greenwald et al., 1995). Although these radars have been designed to monitor plasma convection at auro-ral oval and polar cap latitudes, some of them can be used for sub-auroral studies. Parkinson et al. (2003b, 2005a, b) presented examples of high-velocity observations near the equatorward edge of the auroral oval. The authors introduced a term “westward flow channels” to characterize such flows and showed that they are ultimately related to the substorm development in the area of observation. All three studies are based on the Bruny Island (BI) radar data in Australia. The authors also presented a couple of examples of observations with the King Salmon (KS) radar in Alaska. Since then, two new, very useful radars started operation, the Unwin radar in the Southern Hemisphere (New Zealand) and the Wallops Is-land radar in the Northern Hemisphere (USA). Another new SuperDARN HF radar at mid-latitudes (northern Japan) is under construction. Clearly, the introduction of these new low-latitude radars would significantly improve SuperDARN capabilities in SAPS studies.
In this paper we undertake a more focused investigation of the potential of one of the existing radars, the King Salmon radar, in the detection of high-velocity flows near the equa-torward edge of the auroral oval. Our goals are a general assessment of the radar performance, an investigation of the location of the high-velocity streams with respect to the auro-ral oval, as well as the role of substorm processes in exciting such streams.
2 Geometry of King Salmon observations and statistics for echo occurrence and velocity
Figure 1 shows the fields of view (FoVs) of the SuperDARN HF radars in the Northern Hemisphere for ranges of 400 to 2800 km. In accordance with the initial purpose of the Super-DARN experiment, the radars can monitor coherent echoes from a broad range of magnetic latitudes 3=65◦–85◦, which
are typical auroral zone and polar cap latitudes. Potentially, one can detect echoes from the lower magnetic latitudes, es-pecially at Hankasalmi, Kodiak and King Salmon, but one has to keep in mind that echoes at low ranges often come from the E region and their velocities can be well below plasma convection velocities in the F region (e.g. Koustov et al., 2005). If F-region data at low latitudes are available, one can estimate the full convection velocity by using the map potential procedure of Ruohoniemi and Baker (1998). One can also make convection velocity estimates by assuming the flow is roughly L-shell aligned and by simply dividing the measured line-of-sight (l-o-s) velocity by the cosine of the L-shell angle. Such a procedure has been used in a num-ber of Millstone Hill papers (e.g. Foster and Vo, 2002) and to some extent in SuperDARN studies (e.g. Parkinson et al., 2003b).
Figure 1 demonstrates the advantages of the KS radar in the detection of high-velocity subauroral echoes; it has beams that are oriented close to the L-shell direction (so that total convection estimates would have minimum uncertain-ties) and it can detect F-region echoes from latitudes as low as 60◦ in low number (most counterclockwise) beams. In Fig. 1, one can recognize that the Stokkseyri and Pykkvibaer radars also have an appropriate “azimuthal” orientation of the beams, but these radars cover latitudes of ∼70◦, where detection of SAPS flows is very unlikely, for example, Foster and Vo (2002) reported typical SAPS latitudes of 3<65◦.
In this study we consider routine KS data gathered in the standard mode of operation with 1-min or 2-min scans through 16 beam positions. The KS radar has been in op-eration since the end of 2001, but for more than a year it experienced hardware problems, so extended periods were not covered by measurements. Figures 2a–c show typical echo occurrence rates in MLT-magnetic latitude (3) coordi-nates for three different seasons: winter (December 2001), equinox (March 2002) and summer (July 2003). Only data in beams 0–5 were considered (see shaded area in Fig. 1)
A. V. Koustov et al. : Observations of high-velocity SAPS-like flows 23 1593
Figure 2. King Salmon echo occurrence rate and averaged line-of-sight velocity for winter (December 2001, panels (a) and (d)), equinox (March 2002, panels (b) and (e)) and summer (July 2003, panels (c) and (f)) in magnetic latitude – magnetic local time coordinates. Only data in beams 0-5 were considered.
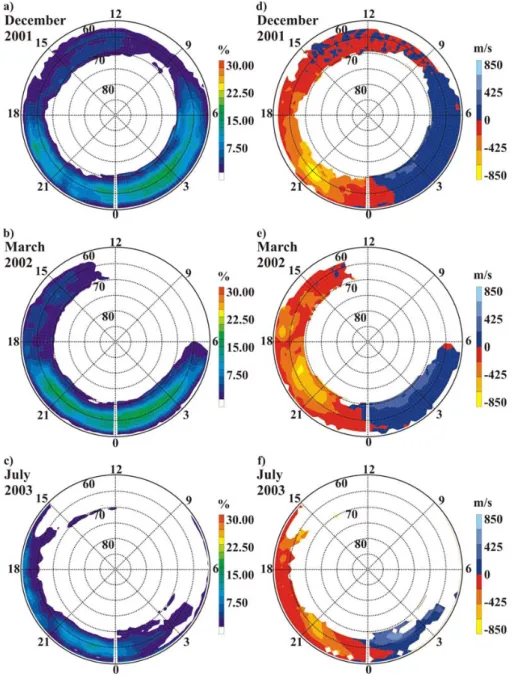
Fig. 2. King Salmon echo occurrence rate and averaged line-of-sight velocity for winter (December 2001, panels (a) and (d)), equinox
(March 2002, panels (b) and (e)) and summer (July 2003, panels (c) and (f)) in magnetic latitude – magnetic local time coordinates. Only data in beams 0-5 were considered.
to concentrate on those directions at which SAPS flows are expected. Occurrence rates were computed as a ratio of the number of registered echoes in every individual radar gate to the total number of observations in this gate for six se-lected beams over each month. Only ionospheric echoes stronger than 3 dB having spectral widths >35 m/s and ve-locities >30 m/s were counted to eliminate untypical echoes and reduce ground scatter contamination. Ratios were aver-aged over 10 minutes of observations in 1◦magnetic latitude bins. Magnetic local time was computed by taking into ac-count range and universal time. The total numbers of
con-sidered scans were 22 737 over 17 days in December, 27 603 over 24 days in March and 16 176 over 24 days in July. The number of scans for each month is larger than the overall number of scans considered by Foster and Vo (2002) with the MH radar. We should mention that we processed all KS data available for 2001–2004 and found that the major fea-tures reported below can be identified in more comprehensive statistics. We present data for specific months to avoid pos-sible solar cycle effects (Ruohoniemi and Greenwald, 1997; Koustov et al., 2004).
1594 A. V. Koustov et al. : Observations of high-velocity SAPS-like flows
24
Figure 3. Stokkseyri echo occurrence rate and averaged line-of-sight velocity for winter (December 2001) in magnetic latitude – magnetic local time coordinates. Only data in beams 0-5 were considered.
Figure 4. Echo Doppler velocity in beam 1 of the King Salmon radar for 5 December 2001, 08:30-11:00 UT in range (ACCGM magnetic latitude) – universal time coordinates.
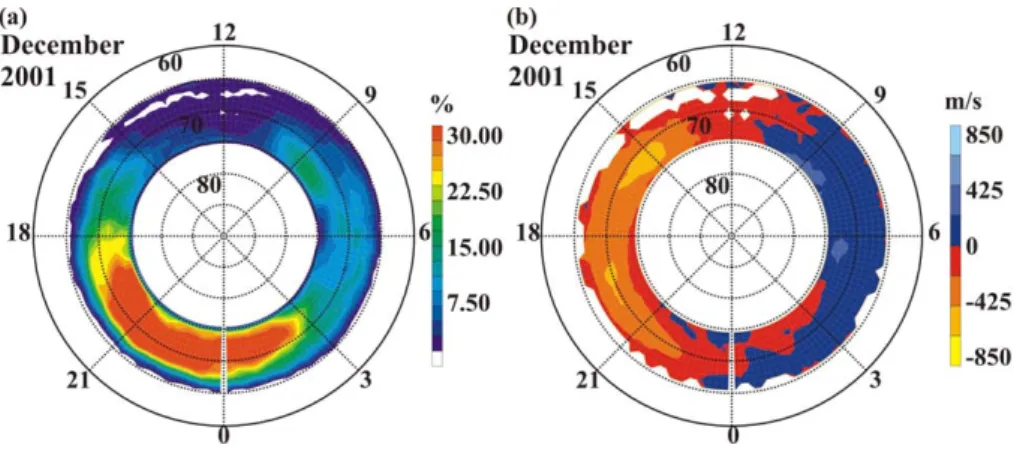
Fig. 3. Stokkseyri echo occurrence rate and averaged line-of-sight velocity for winter (December 2001) in magnetic latitude – magnetic local
time coordinates. Only data in beams 0–5 were considered.
Figures 2a–c show that echoes are much more frequent in the nightside sector. Equinox is the preferential season, though winter observations also show significant occurrence rates. Overall echo occurrence rates for the KS radar are lower than for other Northern Hemisphere radars (Koustov et al., 2004). We make appropriate comparison with the Stokkseyri radar data later. The lower occurrence rates might be related to the hardware differences; the KS radar uses a wire antenna that seems to provide less gain.
Figures 2d–f present statistics for the KS l-o-s velocity in the MLT-3 coordinates. Data are presented only for those bins whose echo occurrence rate was above 1.85%. The same three months of observations are considered. The red (blue) color is used to denote westward, negative (eastward, posi-tive) velocity. The diagrams show a general trend of the ve-locity polarity reversal around magnetic midnight (red color to blue color) and ∼09:00 MLT (blue color to red color), as expected. The prominent feature of all three diagrams is a region of strongly enhanced velocities centered around 21:00 MLT and magnetic latitudes of ∼65◦, seen as a high-velocity “blob” standing out of the background high-velocity. The absolute values for the maximum average velocity are more than 425 m/s, with exceptionally strong values of >640 m/s for the winter case, and to a lesser extent, the equinox case. There is a seasonal trend; at certain latitudes, e.g. 3=65◦, large velocities occur in a broader sector of MLT during win-ter, smaller in equinox and much smaller over summer. In terms of latitude, there is not much variation; the velocity peak seems to be always around 3=65◦. The velocity
maxi-mum is achieved at ∼21:00 MLT for winter and summer and at ∼19:30 MLT for equinox. We should note that the summer observations show an additional area of very strong veloci-ties between 16:00 and 17:00 MLT at 3∼65◦. The enhanced velocities are not accompanied by peaks in the echo occur-rence rates, presented in Figs. 2a–c. The processed data for the echo power and spectral width (not presented here) do not show any distinct features associated with the velocity
enhancements, indicating that the phenomenon reflects only enhanced flows in the ionospheric plasma.
Data on average KS velocities are in contrast with obser-vations of other SuperDARN radars, which do not show the strong velocity maximum at 21:00 MLT; see, for example, data for all radar beams at Saskatoon and Stokkseyri pre-sented by Hamza et al. (2000). For radars that scan mostly perpendicular to the magnetic L shells (such as the Saska-toon radar), this lack of a velocity maximum is not a sur-prise, as the evening sector flow is generally along L-shell directions. This argument does not work for radars whose FoV is “azimuthally” oriented, such as the Stokkseyri radar in Iceland. To illustrate the difference between the KS and Stokkseyri radar velocities, we investigated Stokkseyri ob-servations for the same months as the KS obob-servations (De-cember 2001, March 2002 and July 2003) and computed the occurrence rates and average velocities. The Stokkseyri data for the month of December 2001 (28 941 scans over 31 days) are presented in Fig. 3 in the same format as the KS data in Figs. 2a, d. One can see that the occurrence rate is 2–3 times larger than for the KS radar and the average velocity is mostly below 425 m/s in the evening sector (similar “thresh-old” value for the KS observations is ∼640 m/s). The radar observes at ∼5◦larger magnetic latitudes. There is no evi-dence for the 21:00 MLT velocity peak, with perhaps a pos-sibility that a small peak at ∼20 MLT and 3=70◦is “a rem-nant” of the velocity maximum seen by the KS radar at lower latitude and 21 MLT. The average Stokkseyri velocity gradu-ally decreases toward midnight at all magnetic latitudes. In-stead of the evening maximum, the Stokkseyri data show a strong velocity peak at ∼15:00 MLT.
Since average velocities in the evening sector for the KS radar are quite different from velocities for the Stokkseyri radar, which measures at typical auroral oval latitudes, one can hypothesize that the flows observed by the KS radar at lower latitudes can be associated with additional sources that are not operational at auroral zone latitudes.
A. V. Koustov et al. : Observations of high-velocity SAPS-like flows 1595
24
Figure 3. Stokkseyri echo occurrence rate and averaged line-of-sight velocity for winter
(December 2001) in magnetic latitude – magnetic local time coordinates. Only data in beams 0-5 were considered.
Figure 4. Echo Doppler velocity in beam 1 of the King Salmon radar for 5 December 2001, 08:30-11:00 UT in range (ACCGM magnetic latitude) – universal time coordinates.
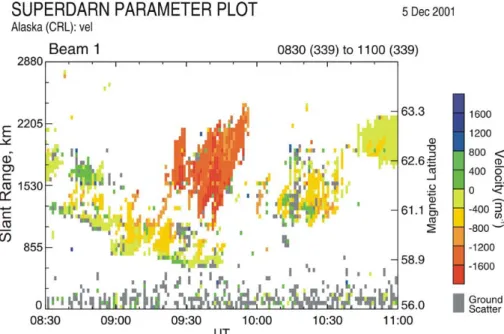
Fig. 4. Echo Doppler velocity in beam 1 of the King Salmon radar for 5 December 2001, 08:30–11:00 UT in range (ACCGM magnetic latitude) – universal time coordinates.
3 The event of 5 December 2001
To obtain insights into the reasons for the occurrence of high-velocity KS echoes we analyze one event in detail and iden-tify geophysical conditions corresponding to such an event. We consider data obtained on 5 December 2001.
3.1 Echo appearance
Figure 4 presents velocity data in beam 1 for the event of 5 December 2001 between 08:30 and 11:00 UT. For conve-nience, the l-o-s velocity is plotted in UT-range and magnetic latitude 3 coordinates. One notices the “blob” of echoes with velocity exceeding 1.6 km/s at 3∼62.5◦between 09:22 and 09:57 UT. These are exceptionally high velocities for any Su-perDARN observations (e.g. Lacroix and Moorcroft, 2000). If one assumes that the flow is L-shell aligned, then the total velocity would be in excess of 2.0 km/s (such estimates will be shown later). The event lasted for about 30 min. Echoes with much lower velocity existed prior, during and after the high-velocity blob period, at slightly lower latitudes. These were also F-region echoes (ranges >900 km), thus indicating that the high-velocity echoes were located at latitudes above
∼60◦. One can notice that the magnitude of the low-velocity
echoes increased somewhat at about 09:00 UT and decreased back to low values after 10:00 UT, about 30 min after the velocity blob disappeared. In addition, within the high-velocity blob, one can notice a “poleward progression” of the high-velocity echoes. The high-velocity region starts at low latitudes and with time it is seen at progressively higher lati-tudes. We should note that such a progression is to some
ex-tent an apparent effect; analysis of the velocity maps shows that the region of enhanced velocity first appears at smaller ranges and then progresses to larger ranges corresponding to higher magnetic latitudes (the geometry of observations, Fig. 1, is such that the radar beam is “tilted” toward the mag-netic pole from the L-shell direction).
We should mention that large velocities were observed not only in “azimuthal” beams, such as beam 1, but also in more “meridional” beams, such as beams 5–10. The velocity in more meridional beams was not as high as in the azimuthal beams but the radar started their detection from about 08:40 UT with a short-lived strong enhancement around 09:00 UT.
3.2 Geophysical conditions and enhanced flow within global convection pattern
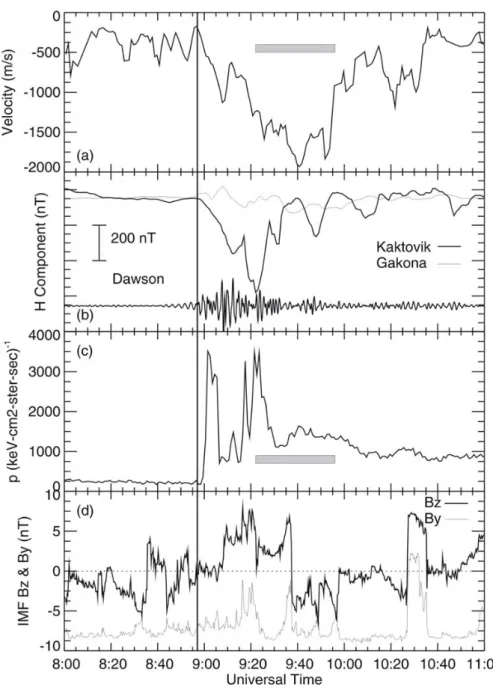
First of all, we note that the event occurred at the recovery phase of a minor storm; the Dst was –30 nT and the Sym-H index was fairly stable for several hours around the in-terval of interest. The Kp index was 2+. Figure 5 sum-marizes other geophysical conditions on 5 December 2001. Figure 5a shows the maximum velocity detected in beam 1 (at any possible range) at every instant of time. We also indicate by a shaded bar the period for which the high-velocity echo blob was seen in beam 1 (c.f., Fig. 4). One can notice that the strongest magnitude of the flow was ob-served around 09:40 UT, and the gradual velocity magni-tude increase started around 09:00 UT. What is special about 09:00 UT is that this moment is very close to the onset of the substorm at 08:57 UT (as identified from the IMAGE
1596 A. V. Koustov et al. : Observations of high-velocity SAPS-like flows25
Figure 5. Summary of the data for the 5 December 2001 event: (a) maximum velocity along the
King Salmon HF radar beam 1 (the shaded bar indicates the period for which the high-velocity
echo blob was seen on Fig. 4) , (b) H-component of magnetic perturbations at Kaktovik and
Gakona and Pi2 magnetic pulsations at Dawson (the length of the vertical scale bar corresponds
to 33 nT for this trace), (c) flux of energetic protons according to measurements by the
geostationary satellite LANL 1991-080 and (d) IMF Bz and By components. Vertical line
indicates the substorm onset.
Fig. 5. Summary of the data for the 5 December 2001 event: (a) maximum velocity along the King Salmon HF radar beam 1 (the shaded
bar indicates the period for which the high-velocity echo blob was seen on Fig. 4), (b) H-component of magnetic perturbations at Kaktovik and Gakona and Pi2 magnetic pulsations at Dawson (the length of the vertical scale bar corresponds to 33 nT for this trace), (c) flux of energetic protons according to measurements by the geostationary satellite LANL 1991-080 and (d) IMF Bzand Bycomponents. Vertical
line indicates the substorm onset.
satellite optical data, some of which will be presented later) in the area to the east of the KS radar’s FoV. We indicate the substorm onset on all panels of Fig. 5 by the vertical line.
In Figs. 5b, c we present data documenting the substorm development. Figure 5b shows the magnetometer observa-tions to the east from the area of high-velocity blob obser-vations, over Alaska (mutual locations of the three magne-tometers used will be shown later in Fig. 9). According to the Kaktovik magnetometer, located at a magnetic latitude
of 3=70.7◦, the H-component started to rapidly decrease at around 08:57 UT. No decrease was detected at Gakona (3=63.5◦), which indicates the latitudinal locality of the
sub-storm. The record at the bottom of Figure 5b is the Pi2 mag-netic pulsations as observed at Dawson (3=66.0◦), slightly
eastward of Kaktovik and Gakona. One can recognize the Pi2 onset at about 08:57 UT. In Fig. 5c we show the flux of energetic protons (50–400 keV range) as observed by the Synchronous Orbit Particle Analyzer (SOPA) instrument on
A. V. Koustov et al. : Observations of high-velocity SAPS-like flows 1597
26
Figure 6. Four global images of the auroral luminosity according to the IMAGE observations and
matched SuperDARN maps of plasma convection for a substorm on 05 December 2001. The
onset occurred at ~0857 UT, according to IMAGE. Panel (a) corresponds to the growth phase of
the substorm (~7 min prior to the onset), panels (b) and (c) correspond to the active phase of the
substorm (~5 min and ~13 min after the onset), and panel (d) corresponds to the substorm
recovery phase (~37 min after the onset).
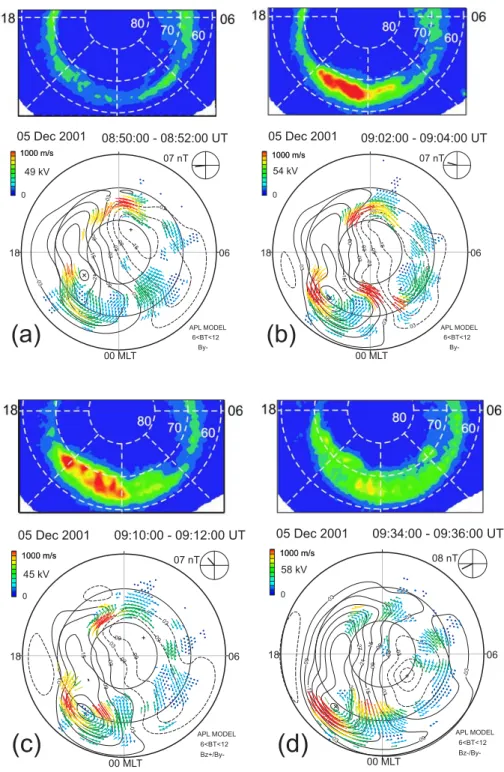
Fig. 6. Four global images of the auroral luminosity according to IMAGE observations and matched SuperDARN maps of plasma convection
for a substorm on 5 December 2001. The onset occurred at ∼08:57 UT, according to IMAGE. Panel (a) corresponds to the growth phase of the substorm (∼7 min prior to the onset), panels (b) and (c) correspond to the active phase of the substorm (∼5 min and ∼13 min after the onset), and panel (d) corresponds to the substorm recovery phase (∼37 min after the onset).
the geostationary Los-Alamos National Laboratory (LANL) satellite 1991-080. Over the event duration, the satellite was located in the pre-midnight sector of the magnetosphere (at geographic longitude of ∼195◦E, over the area of interest).
The flux increases rapidly and strongly around 09:00 UT, in
accord with the substorm development. One can recognize two separate intensifications about 20 min apart. These prob-ably correspond to two separate particle injections into the plasmasphere boundary layer. Figure 5d shows the IMF con-ditions according to the ACE satellite. The By component
1598 A. V. Koustov et al. : Observations of high-velocity SAPS-like flows
27
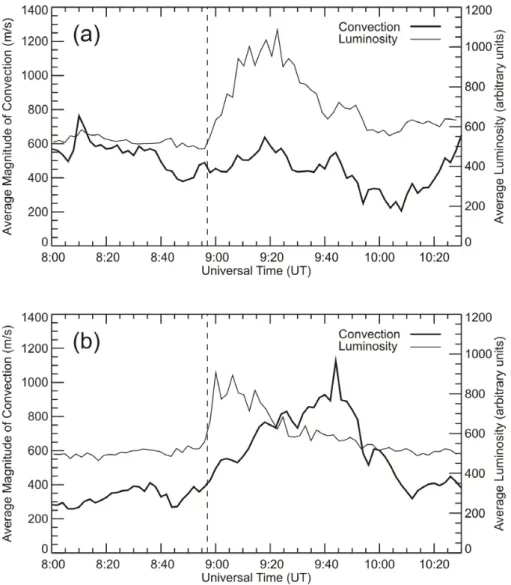
Figure 7. Average magnitude of the convection and auroral luminosity in the (a) poleward (MLAT=670-740) and (b) equatorward (MLAT=600-670) portions of the auroral oval for the entire evening sector (19:00-23:00 MLT). Vertical dashed line marks the substorm onset.
Fig. 7. Average magnitude of the convection and auroral luminosity in the (a) poleward (MLAT=74◦–67◦)and (b) equatorward (MLAT=60◦– 67◦)portions of the auroral oval for the entire evening sector (19:00–23:00 MLT). Vertical dashed line marks the substorm onset.
was mostly negative over the whole event duration. The Bz
component was around zero for at least 15 min prior to the onset and it turned northward around the onset time (the IMF data were shifted in Fig. 5c by 56 min to account for the dis-turbance propagation from the satellite position to the mag-netosphere).
The final evidence of the substorm development can be in-ferred from the optical data collected by the IMAGE satellite; the onset is clearly identifiable at 08:57 UT. We do not show IMAGE data around this time; for the purpose of this paper, observations at different times are of more interest.
In Figs. 6a-d we present 4 frames of IMAGE WIC ob-servations at (a) 08:50 UT, (b) 09:02 UT (c) 09:10 UT and (d) 09:34 UT and matched (as close as possible in time) Su-perDARN convection maps. The convection maps were ob-tained by using the standard map potential technique of Ruo-honiemi and Baker (1998) and by considering data from all
Northern Hemisphere SuperDARN radars, including the KS radar.
The luminosity and convection maps in Fig. 6a correspond to a quiet oval ∼7 min prior to the substorm onset. The next two panels show the substorm development in the midnight sector. The last panel, Fig. 6d, shows the auroral oval during the substorm recovery phase; these observations correspond to the period of maximum velocity observed at KS.
The SuperDARN maps show some changes in the convec-tion pattern as the substorm progresses. According to Fig. 6a,
∼7 min prior to the substorm onset the convection pattern consisted of two cells with a dominating morning cell, in agreement with the strongly negative By component of the
IMF. The next frame (Fig. 6b) corresponds to the period right after the substorm onset. It clearly shows vortical flows of opposite directions in the dusk and dawn sectors. The vor-tices are centered at 3=70◦and 21:00 MLT and 03:00 MLT;
A. V. Koustov et al. : Observations of high-velocity SAPS-like flows
28
1599Figure 8. Auroral luminosity distribution in the dusk sector (IMAGE) and plasma convection
(SuperDARN) in magnetic local time – magnetic latitude coordinates. Red (blue) color
corresponds to strongest (weakest) luminosity. (a) 09:02 UT. Fast flow is seen in the area
westward of the brightest luminosity (auroral bulge) in the magnetic local time sector of
20:00-21:00 MLT. (b) 09:18 UT. Fast flow starts developing in the area equatorward of the brightest
luminosity in the magnetic local time sector of 20:00-22:00 MLT. (c) 09:34 UT. Very fast flow
is seen in the area equatorward of the brightest luminosity in the magnetic local time sector of
20:00-22:00 MLT.
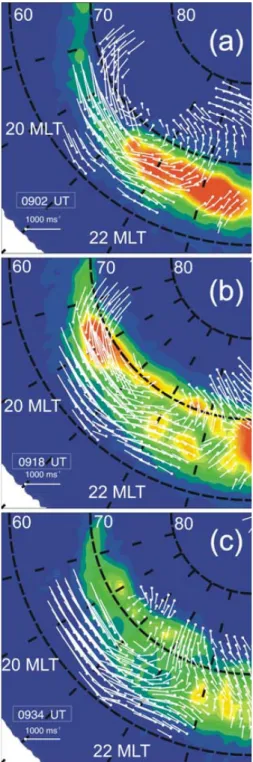
Fig. 8. Auroral luminosity distribution in the dusk sector (IMAGE)
and plasma convection (SuperDARN) in magnetic local time – mag-netic latitude coordinates. Red (blue) color corresponds to strongest (weakest) luminosity. (a) 09:02 UT. Fast flow is seen in the area westward of the brightest luminosity (auroral bulge) in the magnetic local time sector of 20:00–21:00 MLT. (b) 09:18 UT. Fast flow starts developing in the area equatorward of the brightest luminosity in the magnetic local time sector of 20:00–22:00 MLT. (c) 09:34 UT. Very fast flow is seen in the area equatorward of the brightest luminosity in the magnetic local time sector of 20:00–22:00 MLT.
the morning sector vortex is less clear in Fig. 6b. The vortices are very similar to those reported by Grocott et al. (2002) for the substorm onset time. We notice that the flow within the dusk vortex is particularly strong on the west side, in agree-ment with large KS l-o-s velocities. The flow at this time has a significant meridional component; it is located at the most westerly edge of the auroral bulge. The enhanced westward flow at the equatorward edge of the evening vortex is also seen as yellow vectors. Figure 6d refers to the time about
∼15 min after the substorm onset. Here the dawn vortex seems to have disappeared while the dusk vortex still per-sists. One can see that the westward flow is now enhanced while the meridional flow weakened. Figure 6d shows strong westward flow at the equatorward edge of the dusk vortex that has expanded equatorward with respect to its location in the previous frame. Visual comparison of optical and con-vection data in Figs. 6c and d indicates that the high-velocity westward flow overlaps the equatorward edge of the auroral oval.
Figure 7 gives a quantitative account of changes in the average intensity of the convection (as inferred from 1-min convection maps similar to the ones shown in Fig. 6) and lu-minosity for the entire evening sector of 19:00–23:00 MLT and for two latitudinal regions, 60◦–67◦and 67◦–74◦. The first (second) band of latitudes corresponds to the equator-ward (poleequator-ward) portion of the auroral oval for the event un-der consiun-deration. The luminosity intensity is presented in relative units. One can see, in Figs. 7a, b, that the luminos-ity in the equatorward portion of the oval increased abruptly at the substorm onset (vertical dashed line) and decayed sig-nificantly in about 20 min. The luminosity in the poleward portion of the oval started to increase near the onset time but reached a maximum ∼15 min later, after the auroral bulge expanded poleward. Convection in the equatorial portion of the oval started to increase ∼10 min prior to the onset and continued to increase until it reached its maximum at around 09:40 UT. Convection in the poleward portion of the oval showed a slight increase about 15 min after the substorm on-set. Thus, the average convection in the equatorial portion of the auroral oval shows similar trends as the KS l-o-s velocity presented in Fig.5a.
3.3 Enhanced flows and auroral oval location: comparison with IMAGE and DMSP observations
To explore the mutual location of the enhanced flows and luminosity in detail we plot both data sets on one frame for three moments, 09:02 UT, 09:18 UT and 09:34 UT, Figs. 8a-c. The first and the last moments correspond to ob-servations near the substorm onset time and at the substorm recovery phase when the fastest flows were detected. The ad-ditional moment for the comparison was selected because the KS l-o-s velocity data can be compared with DMSP measure-ments and also because this frame is one of the first showing a strong westward flow.
1600 A. V. Koustov et al. : Observations of high-velocity SAPS-like flows
29
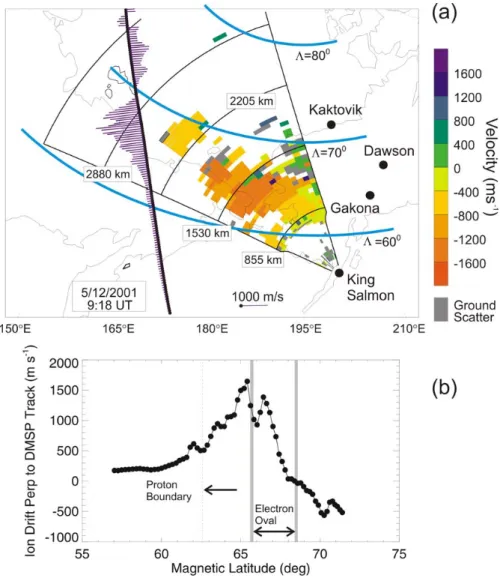
Figure 9. (a) King Salmon velocity map for 5 December 2001, 09:18 UT with overlaid DMSP cross-track ion drifts for a DMSP F-15 pass near the time of radar measurements. (b) A line plot of the ion drift data shown in panel (a), latitudes of the auroral electron precipitations and the equatorward boundary of the proton aurora. For the boundary identification, DMSP particle data were considered. The peak in the ion drift roughly coincides with the equatorward edge of the electron precipitation and relatively fast flow exists equatorward of this edge for several degrees of magnetic latitude.
Fig. 9. (a) King Salmon velocity map for 5 December 2001, 09:18 UT with overlaid DMSP cross-track ion drifts for a DMSP F 15 pass near
the time of radar measurements. (b) A line plot of the ion drift data shown in panel (a), latitudes of the auroral electron precipitations and the equatorward boundary of the proton aurora. For the boundary identification, DMSP particle data were considered. The peak in the ion drift roughly coincides with the equatorward edge of the electron precipitation and relatively fast flow exists equatorward of this edge for several degrees of magnetic latitude.
First consider the joint IMAGE – SuperDARN observa-tions at 09:02 UT presented in Fig. 8a. One can clearly see the large-scale convection vortex with the focus located to the northwest of the auroral bulge luminosity. The fastest flow is observed to the west of the auroral bulge, and is oriented westward. The flow is also westward (but not as fast) within the bulge area and equatorward (although the amount of vec-tors located equatorward of the oval is not significant). The enhanced flow correlates with the weaker precipitation/lower conductance to the west of the auroral bulge.
Convection data presented in Fig. 8b for 09:18 UT show the same overall pattern, although the velocity magnitudes are larger. More importantly, the enhanced velocities are now located at lower latitudes in the areas where the
lumi-nosity decreased (notice that all diagrams presented in this paper use the same scaling for the luminosity level). Fi-nally, Fig. 8c corresponds to observations at 09:34 UT, the time of the largest westward velocities observed. The flow is clearly located at the very equatorward edge of the luminos-ity band, well equatorward of the strongest luminosluminos-ity blobs at MLAT=70◦. This flow can be classified as SAPS, as ob-servationally it satisfies all criteria in terms of the conditions, location and intensity of SAPS.
Because the data presented in Figs. 8a–c have some un-certainties in terms of mapping and spatial resolution of the IMAGE optical instrument, we compare the radar velocity data with observations of the DMSP F15 satellite that passed the KS field of view at about 09:18 UT, as shown in Fig. 9. In
A. V. Koustov et al. : Observations of high-velocity SAPS-like flows 1601
30
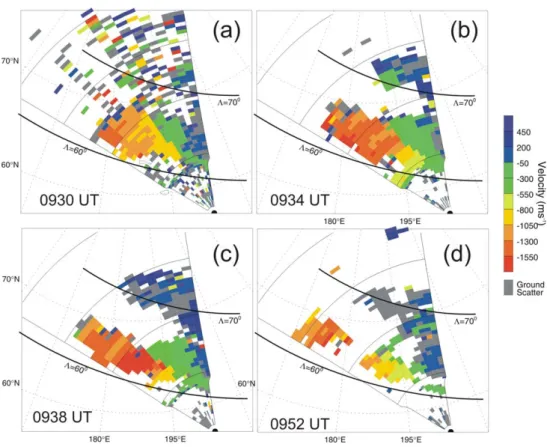
Figure 10. King Salmon 1-min velocity maps illustrating the onset of very high-velocity echoes roughly along the L-shell directions between ~09:34 and 09:38 UT. These echoes correspond to the extremely fast flow identified in Figure 8c. The transition from the very high velocities to the background ones is well seen in the central beams as a sharp velocity magnitude decrease.
Fig. 10. King Salmon 1-min velocity maps illustrating the onset of very high-velocity echoes roughly along the L-shell directions between
∼09:34 and 09:38 UT. These echoes correspond to the extremely fast flow identified in Fig. 8c. The transition from the very high velocities to the background ones is seen well in the central beams as a sharp velocity magnitude decrease.
Fig. 9a we present the KS velocity map together with DMSP cross-track velocities. In Fig. 9b we present the DMSP data in more detail and also indicate the location of the equator-ward edge of the auroral oval, as determined by the elec-tron precipitation detector on this satellite. The equatorial edge of proton precipitation is also shown. We note that the DMSP velocity maximum is achieved near the equator-ward boundary of the electron oval. One can see that the KS high-velocity echoes are located somewhat equatorward of the oval boundary, if one assumes that the oval edge is located at the same latitudes in the areas of the radar and DMSP measurements. As expected, the KS velocities are very comparable with the ion drifts measured by the DMSP (the “look” directions of radar and satellite measurements are about the same). Although the DMSP data show a double maximum in the ion drift velocity while crossing the high-latitude ionosphere, one cannot simply identify similar peaks in the radar data, as there are significant spatial velocity vari-ations, so that more elaborate analysis is required to detect the peaks.
3.4 On the temporal and spatial variations of the flow speed
The radar data presented clearly show fast azimuthal flows near the equatorial edge of the auroral oval which can be identified as SAPS-like flow, at least for observations at
∼09:34 UT. Generally, the observed convection patterns can be affected by several factors, with the most important ones being the external IMF merging-related factors and particle injection-related factors. Separation of the effects of these sources in SuperDARN convection maps is a difficult task. To identify the additional component of the flow pattern out-side the auroral oval, the SAPS component, Foster and Vo (2002) considered latitudinal variation of the MH l-o-s ve-locity divided by the cosine of the L-shell angle. In pre-senting the data in this way, they noticed a change in the rate of the velocity variation with latitude (presumably at the “edge” of the oval) or just simply detected a separate stream. Such signatures have been shown to persist during disturbed conditions. Despite the fact that the 5 December 2001 event occurred at relatively quiet conditions (Kp=2+), we apply a somewhat similar procedure to the KS observations.
We concentrate here on a short interval of observations near 09:34 UT when the fast flows equatorward of the bright blobs of the oval luminosity were detected (as shown in
1602 A. V. Koustov et al. : Observations of high-velocity SAPS-like flows
Fig. 11. Top panel: A diagram illustrating the relationship between the measured velocity in SuperDARN observations, the plasma convection
velocity VEand the L-shell angle 8. Four bottom panels: King Salmon velocity observations in various beams for four 2-min intervals on
5 December 2001 between 09:30 UT and 09:52 UT. The measured line-of-sight velocity was divided by the cosine of the L-shell angle 8 at every bin of observations. Color code was applied to various beam data as follow: black – beams 0, 4, 8, 12; red – beams 1, 5, 9, 13; green – beams 2, 6, 10, 14; and blue – beams 3, 7, 11,15. For each beam, the velocity changes with the L-shell angle. If the flows were uniform and L-shell aligned, all points would align with one line corresponding to the average velocity within the KS FoV. For illustration purposes, the line of –1300 m/s is shown.
Fig. 8c). Figure 10 is a series of four KS velocity maps. The first one at 09:30 UT shows more or less smooth vari-ation of the l-o-s velocity with the azimuth of observvari-ations. The only exception is a small “blob” of high velocity in the north-western part of the FoV. The next frame at 09:34 UT is stunningly different as very fast l-o-s velocities are estab-lished in almost half of the field of view. A sharp decrease in the velocity (from red to green color) along the line of central beams 7–8 is easily identifiable. The next frame at 09:38 UT shows a blob of even larger velocity, though lim-ited in space as compared to the previous frame. The veloc-ity receded in other parts of the previously fast flow band. Finally, the velocity map at 09:52 UT shows velocity
distri-bution with more smooth variation over the FoV and much smaller overall velocities. Again, a small area of high veloc-ity exists in the north-western part of the FoV. These KS plots seem to indicate the existence of a high-velocity background flow with the occurrence of additional short-lived (∼10 min) blobs/channel of extremely high velocity localized in lati-tude.
We now illustrate this point differently. In the top panel of Fig. 11 we show a diagram explaining that the measured SuperDARN velocity is the product of the plasma convection velocity VEand the cosine of the L-shell angle 8, if the flow
is more or less L-shell aligned. It means that if we consider the values of the KS l-o-s velocity divided by the cosine of
A. V. Koustov et al. : Observations of high-velocity SAPS-like flows 1603 32
Figure 12. The same as in Figure 8 but for observations on 1 December 2001 at 07:12 UT. Fast flow equatorward of the auroral oval is seen in the dusk sector (~18:00 MLT). This flow is comparable in magnitude with the one existing within the auroral oval (~650
) between 18 MLT and 22 MLT.
Fig. 12. The same as in Fig. 8 but for observations on 1 December
2001 at 07:12 UT. Fast flow equatorward of the auroral oval is seen in the dusk sector (∼18:00 MLT). This flow is comparable in mag-nitude with the one existing within the auroral oval (∼65◦)between 18 MLT and 22 MLT.
the L-shell angle at each bin of measurements, we can obtain estimates of the total convection velocity within the FoV. In Fig. 11 we present plots of the obtained velocity versus the L-shell angle for 2-min intervals for the same frames as the ones in Fig. 10. To distinguish data from various beams a special color scheme has been adopted, as follows: black corresponds to data obtained in beams 0, 4, 8, 12; red cor-responds to data in beams 1, 5, 9, 13; green corcor-responds to data in beams 2, 6, 10, 14; and blue corresponds to data in beams 3, 7, 11, 15.
To understand the meaning and implications of these plots, consider the frame for 09:30–09:32 UT, Fig. 11a. The blue colored dots at L-shell angles of ∼75◦ (nearly vertical “stripe”) are the l-o-s velocities divided by the cosine of the L-shell angle at each radar bin, as measured in beam 15 over two scans. The velocity spans quite a range of values, and the majority of points are spread between 0 and –400 m/s. The next near vertical “stripe” of green dots at L-shell angles of
∼70◦corresponds to observations in beam 14. The data for
smaller L-shell angles reflect measurements in smaller num-ber beams, so eventually the black colored dot at the L-shell angle of ∼10◦corresponds to observations in beam 0.
The presented scatter plot (and all others) is complicated, but it will be used only to illustrate some gross features, such as the development of relatively short-lived, high-velocity westward streams on top of fairly fast background flow. Our argumentation is as follows: if the flow were uniform and di-rected along the L-shells, all points in Fig. 11a would have to cluster around the same value (at various L-shell angles). In Fig. 11a, there are two clusters of points, one around
−200 m/s and another one at –1300 m/s (horizontal line). The first cluster of points reflects the flow at high latitudes, well above the area of interest, and these points will not be discussed below. The other cluster of points reflects the back-ground flow of ∼–1300 m/s.
Figure 11b shows that the cluster of points around
−1300 m/s is split onto two groups; one group of velocities is centered around –1000 m/s while the other group is cen-tered around –1600 m/s. We believe that the second group re-flects the development of SAPS-like flow within the KS FoV. Figure 11c shows that this second group of velocities is dis-tinctly different from the rest of the points. Some points have velocity of –2.5 km/s. We showed in Fig. 8c that the largest velocities were observed at the most equatorward edge of the luminosity band. Finally, Fig. 11d shows only one cluster of points around –1300 m/s, indicating the disappearance of the SAPS-like flow enhancement. Thus, the data presented in Figs. 10 and 11 indicate that 1) the plasma flow can be very fast and cover a significant portion of the ionosphere near the equatorward edge of the auroral oval and 2) episod-ically, very high-velocity, azimuthally-oriented streams can be excited for short periods of 5–10 min.
4 Comments on other high-velocity King Salmon events
We studied in detail several other events for which very high-velocity echoes were observed by the KS radar in the af-ternoon/evening MLT sector and information on luminosity from IMAGE was available. A common feature of these events is that as the oval luminosity decays at the recovery phase of the substorm, a strong westward flow can be es-tablished at the equatorward edge of the auroral oval, in the area of weak precipitation (luminosity) and low ionospheric conductance, just as it was demonstrated for the 5 December 2001 event. The time delays between the substorm onset and the establishment of the strong westward flow varied between 10 and 50 min. It is important to note that the flows were not always channels extended over many hours of MLT; instead, often they looked confined to a certain MLT sector in which the luminosity was decreased.
On several occasions, the SuperDARN convection patterns were extended well equatorward of the auroral oval and we were able to observe the flow intensity in these areas. One such example is given in Fig. 12 for the 1 December 2001 event, 07:12 UT. Here fast flow is seen in the dusk sector (∼18:00 MLT), and it extends well equatorward of the oval. The magnitude of the flow outside of the oval is compara-ble in magnitude to the one existing inside the oval (∼65◦, 18:00-22:00 MLT). Unfortunately, vectors are not available for even lower latitudes, and it is impossible to investigate how the convection decreases at lower latitudes. This spe-cific case shows that fast flow equatorward of the oval is not always “detached” from the flow within the oval, in contrast with the impression given by MH observations that strong
1604 A. V. Koustov et al. : Observations of high-velocity SAPS-like flows
33
Figure 13. (a) King Salmon velocity map for 4 December 2001, 11:14 UT with overlaid DMSP cross-track ion drifts for a DMSP F-15 pass near the time of radar measurements. A blob of high velocity KS echoes is clearly identifiable as a red spot. The ion velocity shows two peaks, with one being well outside the auroral oval. The KS high-velocity blob is located at similar latitudes as the equatorward peak seen by DMSP.
Fig. 13. (a) King Salmon velocity map for 4 December 2001, 11:14 UT with overlaid DMSP cross-track ion drifts for a DMSP F 15 pass
near the time of radar measurements. A blob of high velocity KS echoes is clearly identifiable as a red spot. The ion velocity shows two peaks, with one being well outside the auroral oval. The KS high-velocity blob is located at similar latitudes as the equatorward peak seen by DMSP.
flow channels at mid-latitudes are distinctly separated from flows within the oval. In this respect, it has been an important task to identify the KS events with SAPS-like flows that are “detached” from the auroral zone flow. Such attempts were unfortunately unsuccessful. For many high-velocity events, echoes existed only in the low number beams (azimuthally oriented), perhaps because of strong HF radio wave absorp-tion in other beams. For such events, it was impossible to identify the latitudinal trends in the velocity. For some events, it was more or less clear that the monitored fast flow was well equatorward of the auroral oval. Figure 13 gives an example of such observations. Here the DMSP mea-surements are compared with velocities observed by the KS radar. The DMSP clearly indicate two peaks in the flow, one within the oval and another one well outside it. The KS radar sees regular background flow in most of the FoV. The excep-tion is the blob of high-velocity echoes in beams 3–6. These echoes are located at the same magnetic latitudes as the en-hanced flow channel observed by DMSP F15 equatorward of the oval. This example illustrates the difficulties of the KS radar to monitor fast flows; the echoes are limited to a por-tion of the area where the fast SAPS-like flow is expected.
5 Discussion
The data presented in this study show that the King Salmon radar regularly observes high-velocity echoes (l-o-s velocity
>450 m/s) in the low number beams which are oriented close to the magnetic L shell directions (the L-shell angles are
∼10◦–20◦). Such echoes occur mostly in the dusk sector between 16:00 MLT and 23:00 MLT with the largest l-o-s velocities at about 21:00 MLT (winter) and at a magnetic lat-itude of 65◦. The maximum observed l-o-s velocities are of
the order of 2 km/s; if an assumption on the L-shell align-ment of the flow is made, this would correspond to a total velocity of ∼2.5 km/s. Statistically, the largest average l-o-s velocitiel-o-s are achieved during the winter and the l-o-smallel-o-st during the summer. For individual scans, the high-velocity echoes cover a range of magnetic latitudes of at least sev-eral degrees. In this study, due to the lack of data in some beams in many events, no attempt has been made to deter-mine the exact latitudinal width of the enhanced flow chan-nels. Moreover, for some events, echoes were not detected at all in the high number, nearly poleward-oriented beams, leaving no chance for a channel width determination. The high-velocity echoes are generally observed at relatively low magnetic activity, as characterized by the Kp magnetic index (Kp<3–4). For stronger magnetic activity, some low range echoes (at magnetic latitudes of 58◦–60◦) are still detectable but these are coming from the E-region and their velocity can be well below the E×B drift so that identification of the SAPS flow is problematic.
The KS observations are reminiscent of the statistical morphology of SAPS flows determined from the Millstone Hill incoherent radar observations at low magnetic activity
A. V. Koustov et al. : Observations of high-velocity SAPS-like flows 1605
(Foster and Vo, 2002). The similarities between the two statistics are that generally high velocities are seen by both systems and that the velocity maximum is observed in the dusk sector. There are, however, significant differences. An obvious one is that the MH radar sees SAPS more than 40– 50% of the time between 20:00–22:00 MLT and at Kp=3– 4 (see Fig. 8 in Foster and Vo, 2002), while detection of the high-velocity echoes by the KS radar is very infrequent. We showed in Fig. 2a that the echo occurrence rate at KS is less than 15% at the expected latitudes and magnetic local times (15:00–24:00 MLT) of SAPS for December 2001. This makes SAPS detection more difficult, especially in view that for the subsequent years (2002–2004), the echo occurrence at KS went down, in accord with a general decay of the so-lar activity. We counted the number of high-velocity events (beam 1) for the three months considered in Fig. 2, as well as for June 2002, due to reduced events in the summer, for those days for which the echoes were detected at the expected lat-itudes and in the magnetic local time sector of SAPS. The threshold velocity was set to 450 m/s (similar to Parkinson et al., 2005b). We found that significant high-velocity events were observed in 46% (winter), 28% (equinox) and 26% (summer) of the days with reliable echo detection.
We should mention that Parkinson et al. (2005b) reported larger high-velocity echo occurrence rates for the BI Super-DARN radar in Australia, of the order of 40–50% (at least “every third night of observations”). These authors consid-ered data in beam #15 which has the flow angle with L shells of ∼50◦ (versus 10◦ for the low-latitude KS beams). The flow was classified as fast if the l-o-s velocity was > 450 m/s. The BI occurrence rates are in agreement with the KS statis-tics for winter. For equinox and summer, the KS radar detects fewer high-velocity events than the BI radar.
The lower rate of fast flow detection at KS as compared to the MH observations originates, very likely, from the differ-ence in the radars’ capabilities. While the MH radar provides velocity measurements most of the time wherever its beam is pointed, the KS HF radar is very sensitive to the horizontal and vertical electron density distribution in the ionosphere, so that the echo cannot be detected even if irregularities, and fast flows, do exist in the ionosphere. In addition, the KS radar can only reliably observe azimuthal flows at latitudes 62◦–65◦ in a very narrow range of MLT sectors, for indi-vidual scans. The echo band for the KS observations is not usually large; more equatorward parts of the ionosphere are not often accessible for echo detection because of low elec-tron density, leading to insufficient radio wave refraction, and for observations deeper into the oval, radio wave absorption is too strong for the echoes to be detected or strong E-region density can over-refract radio waves and blanket echoes from the F region. This means that a significant portion of the high-latitude ionosphere is simply not accessible for HF mea-surements. The differences between the KS and BI obser-vations can be explained by the lower sensitivity of the KS radar itself, primarily because of the types of antennas used.
Another important difference in the KS and MH observa-tions is in the average velocity. At 21:00 MLT the KS radar measures speeds up to 750 m/s (Fig. 2a) at 3=65◦. Foster and
Vo (2002) reported 250 m/s (see their Fig. 6) at this latitude, though for stronger magnetic activity of Kp=6.
For these conditions, velocities of 750 m/s were observed at the latitude of ∼ 57◦, and one might think that the veloc-ity peak was shifted to lower latitudes at larger Kp. Indeed, according to Fig. 3 in Foster and Vo (2002), the SAPS peak should be located at the latitude of ∼62◦for Kp=4 and per-haps even at higher latitudes for smaller Kp, meaning that the latitudinal locations of the SAPS peak for the MH and high-velocity KS observations are very comparable. How-ever, with the Kp decrease the magnitude of the flows also decreases; according to Fig. 5 of Foster and Vo (2002), it changes from ∼1000 m/s at Kp=6 to ∼500 m/s at Kp=3. This implies that, generally, the KS velocities are larger than the ones reported by Foster and Vo (2002).
The MH and KS velocities are also different with re-spect to the time at which their maximum is observed. For Kp=4, the MH maximum (peak) velocities occur at ∼16:00– 18:00 MLT (see Fig. 3 of Foster and Vo, 2002) while at KS it is at ∼21:00 MLT for winter and equinox, and there is an additional peak between 16:00–17:00 MLT during summer. The reason for this difference is not clear. We should remind the reader that in this study we considered the l-o-s veloci-ties roughly along the L shells. The velociveloci-ties reported by Foster and Vo (2002) included observations at all MH radar azimuths, along and perpendicular to the flow, and the as-sumption that the flow is L-shell aligned has been made by these authors. It is not clear to what extent such an assump-tion is applicable to observaassump-tions at large flow angles. For example, because the large-scale convection cells’ foci are often observed at ∼18:00 MLT, the flow is often round in shape and one hardly can expect it to be L-shell aligned in this time sector. In this respect, it is interesting to note that Ridley and Liemohn (2002) predicted significant departure of SAPS flows from the L-shell directions at ∼18:00 MLT (see their Fig. 6).
Our detailed analysis of the fast flows location with re-spect to the auroral oval (as seen by IMAGE and DMSP) showed that enhanced flows often occur at the equatorward edge of the auroral oval in the area where the ionospheric conductance is low because of the lack of precipitating par-ticles. Such situations are not rare at the recovery phase of a substorm. Thus, some fast flows seen by the KS radar occur under conditions similar to the ones observed during SAPS events. In this view, such flows can be called SAPS and re-lated to the same production mechanisms as SAPS.
Our attempts to locate events with very narrow jets, as well as strong jets clearly detached from the main flow in the auroral oval, were unsuccessful. This is consistent with the observations by Foster and Vo (2002), who reported the detached channel formation only for magnetically active pe-riods with Kp>5. As we mentioned, for such conditions,
1606 A. V. Koustov et al. : Observations of high-velocity SAPS-like flows
the expected location of the SAPS flow is equatorward of the KS FoV. Clearly, the recently built low-latitude SuperDARN radars will be in a better position to address this issue.
For the events considered in this study (and several others that we studied), the strong westward flows had a similar pat-tern of development during the course of a substorm. At the substorm onset time, a clockwise vortex of dusk plasma flow was usually seen. This is consistent with the model of the substorm-related convection pattern development proposed by Grocott et al. (2002). The focus of the vortex was lo-cated in the late dusk sector and at latitudes ∼ 70◦, slightly poleward and westward of the developing bulge of the auro-ral luminosity. The vortices often exhibited strong equator-ward (meridional) flows at their eastern edge. Some of the near onset-time vortices showed an enhanced westward (az-imuthal) flow at their equatorward portion, as well. Similar enhancements of the azimuthal flows have been reported by Provan et al. (2004), in their Fig. 7. These flows well might be the ones noticed by Parkinson et al. (2003a, 2005a, b) at lower magnetic latitudes. Thus, our data support the finding of Parkinson et al. (2003a, 2005a, b) that the westward flow can be enhanced at the substorm onset time in the area equa-torward of the expanding auroral bulge. The difference from previous reports is in the timing for the onset of strongest westward flows; we noticed them to occur with a delay of 10–50 min after the substorm onset.
Later on, during the substorm expansion phase, the con-vection vortices evolve into more large-scale, cell-like flows and eventually disappear. After some time from the on-set (∼40 min for 5 December 2001) strong and more stable westward/azimuthal flows appear at the equatorward edge of the dusk convection cell in the dusk sector of ∼19:00– 23:00 MLT. These flows exist for at least 10–20 min, and they overlap with the equatorward edge of the auroral oval. The delay in strong flow development is consistent with satellite detection of strong SAIDs about 30 min after the substorm onset (Anderson et al., 1993). In this respect, an interesting result was published by Provan et al. (2004). These authors statistically studied the convection pattern evolution in the course of a substorm. By searching through their Fig. 8, we discovered that those data also show an additional enhance-ment of the azimuthal flow ∼14 min after the substorm onset. Upon our request, the first author of this study (G. Provan) performed a more detailed estimate of the time when the ve-locity was at maximum (in their paper, only convection pat-terns at 4, 14, 20 and 28 min after the onset were presented). It was found that maximum velocities are achieved ∼16 min after the substorm onset. Thus, the delays of 10-50 min that we reported are consistent with the completely different data set (no KS observations) of Provan et al. (2004).
We should note that for the event of 5 December 2001 the fastest flows were observed at the time when the IMF Bz
had changed polarity to negative values. It might be that such a change activated merging processes in the tail and thus provided stronger convection at the edge of the auroral
oval through either energetic particle delivery or a magneto-spheric electric field increase and stronger field penetration outside the oval. However, we note that the velocity in beam 1, Figs. 4 and 5a, was persistently increasing in magnitude well before the Bzchanges occurred. It even seems that the
Bz transition did not change the temporal trend of the
az-imuthal velocity.
The data presented in this study show that the fast flows vary in velocity magnitude quite quickly. We showed in Fig. 11 the development of short-lived, very fast streams (up to 2.5 km/s) over the period of several minutes. These ex-isted on top of the background azimuthal flow of ∼1.3 km/s, which, by itself, is unusually fast. Our data are similar to ob-servations by Erickson et al. (2002) and Foster et al. (2005), who reported the high variability of the flow within the SAPS channel by looking at the E-region power data underneath the SAPS flow in the F region.
In terms of the mechanism of high-velocity flow forma-tion, our data support a notion that strong westward flow channels near the equatorward edge of the auroral oval de-velop when the Region 2 FAC flows into the ionosphere with low conductance, due to the lack of precipitation there (e.g. Foster and Burke, 2002). Such conditions frequently occur at the recovery phase of the substorm in the equatorial part of the auroral oval where precipitation suddenly ceases to exist. A decrease in the precipitation intensity happens with vari-ous delays after the substorm onset, and it is not surprising that high-velocity flows detected by the KS radar have dif-ferent delays from the onset time, ranging from about 10 min to 50 min. It might well be that strong plasma flows near the equatorward edge of the auroral oval are enhanced by en-ergetic protons penetrating into the inner magnetosphere, as suggested by Galperin (2002). The data available do not al-low us to evaluate the relative importance of each of these factors.
6 Conclusions
In this study we showed that:
1. The King Salmon SuperDARN radar regularly de-tects enhanced flows (velocity >450 m/s) roughly along the magnetic L-shell directions at magnetic latitudes of 60◦–65◦ and in the local time sector of 16:00– 23:00 MLT. The flows are seen either as a broad band of echoes covering several degrees of magnetic latitude or echoes in several L-shell aligned beams corresponding to ∼1◦–2◦of magnetic latitude. The enhanced flows are seen ∼30% of the echo detection time and at relatively low magnetic activity of Kp<3–4. In individual events, the line-of-sight velocity can be as high as 2 km/s, which is in the range of maximum velocities seen with any Su-perDARN radar. There are seasonal trends in the aver-age velocity of the flow; velocities are largest (smallest)
A. V. Koustov et al. : Observations of high-velocity SAPS-like flows 1607
for the winter (summer) conditions. The maximum ve-locities are observed around 21:00 MLT during winter and equinox, and there is an additional peak at 16:00– 17:00 MLT during summer.
2. For a number of identified fast flow events, the velocity maximum coincides with the equatorward edge of the auroral oval/precipitation, as inferred from the DMSP and IMAGE particle data. Exceptionally high velocities were observed in the areas of low local precipitation.
3. The band of high-velocity echoes can consist of short-lived (5–10 min) streams with exceptionally high veloc-ity which occurs in the areas of low precipitation.
4. For a number of analyzed events, the fast flows occur at the recovery phase of a substorm developing in the area of observations. The velocity of the westward flow starts to increase near the substorm onset time, in agree-ment with previous coherent radar studies, but the max-imum velocities are achieved later, 10–50 min after the onset. The enhanced flows constitute the equatorward part of the large-scale dusk convection cell in the 19:00– 23:00 MLT sector. The westward velocity enhancement occurs after the substorm-related large-scale convection vortex, centered typically near the westward edge of the auroral luminosity bulge, evolves into larger-scale cell-like flow. Also, the fastest flows are seen with some delay from the arrival of energetic protons to the geosta-tionary satellite located in the duskside magnetosphere.
5. The observations indicate that at least some of the ob-served high-velocity westward flows seen by the KS radar can have the same origin as subauroral polariza-tion streams, and thus this radar is a useful instrument for studying these streams at low magnetic activity.
Acknowledgements. We acknowledge the support of all national
funding agencies that made possible the continuous operation of the SuperDARN radars considered in this study. The DMSP ion drift data were taken from the University of Texas at Dallas website (M. Hairston). The DMSP particle data were taken from the APL website (P. Newell). We thank F. Rich (Air Force Research Labora-tory) for providing access to the DMSP data on the AFRL website; this enormously helped us in events search. LANL particle data were taken from the CDAWeb site (E. Dors). We thank G. D. Reeves for comments on LANL satellite particle data. Helpful discussions on the topic of the research with E. V. Mishin, G. Khazanov, and S. Sazykin are appreciated. We thank G. Provan for estimates of the maximum convection velocities during substorm. This work has been supported by NSERC (Canada) grant to AVK.
Topical Editor M. Pinnock thanks H. Vo and another referee for their help in evaluating this paper.
References
Anderson, P. C., Heelis, R. A., and Hanson, W. B.: The ionospheric signatures of rapid subauroral ion drifts, J. Geophys. Res., 96, 5785–5792, 1991.
Anderson, P. C., Hanson, W. B., Heelis, R. A., Craven, J. D., Baker, B. N., and Frank, L. A.: A proposed production model of rapid subauroral ion drifts and their relationship to substorm evolution, J. Geophys. Res., 98, 6069–6078, 1993.
Anderson, P. C., Carpenter, D. L., Tsuruda, K., Mukai, T., and Rich, F. J.: Multisatellite observations of rapid subauroral ion drifts (SAID), J. Geophys. Res., 106, 29 585–29 599, 2001.
Bristow, W. A., Otto, A., and Lummerzheim, D.: Substorm con-vection patterns observed by the Super Dual Auroral Radar Net-work, J. Geophys. Res., 106, 24 593–24 609, 2001.
Bristow, W. A., Sofko, G. J., Stenbaek-Nielsen, H. C., Wei, S., Lummerzheim, D., and Otto, A.: Detailed analysis of substorm observations using SuperDARN, UVI, ground-based magnetometers, and all-sky imagers, J. Geophys. Res., 108, doi:10.1029/2002JA009242, 2003.
Carpenter, D. L. and Lemaire, J.: The plasmasphere boundary layer, Ann. Geophys., 22, 4291–4298, 2004.
Erickson, P. J., Foster, J. C., and Holt, J. M.: Inferred elec-tric field variability in the polarization jet from Millstone Hill E region coherent scatter observations, Radio Sci., 37, 1027, doi:10.1029/2000RS002531, 2002.
Foster, J. C. and Burke, W. J.: SAPS: A new characterization for sub-auroral electric fields, EOS Trans. AGU, 83, 393–395, 2002. Foster, J. C. and Vo, H. B.: Average characteristics and activity dependence of the subauroral polarization stream, J. Geophys. Res., 107, doi:10.1029/2002JA009409, 2002.
Foster, J. C., Erickson, P. J., Lind, F. D., and Rideout, W.: Millstone Hill coherent-scatter radar observations of electric field variabil-ity in the sub-auroral polarization stream, Geophys. Res. Lett., 31, L21803, doi:10.1029/2004GL021271, 2005.
Galperin, Y. I., Ponomarov, Y. N., and Zosimova, A. G.: Direct measurements of ion drift velocity in the upper ionosphere during a magnetic storm, Cosmicheskie Issled., 11, 273–283, 1973. Galperin, Y. I.: Polarization jet: Characteristics and a model, Ann.
Geophys., 20, 391–404, 2002.
Greenwald, R. A., Baker, K. B., Dudeney, J. R., Pinnock, M., Jones, T. B., Thomas, E. C., Villain, J.-P., Cerisier, J.-C., Senior, C., Hanuise, C., Hunsuker, R. D., Sofko, G., Koehler, J., Nielsen, E., Pellinen, R., Walker, A. D. M., Sato, N., and Yamagishi, H.: DARN/SuperDARN: A global view of the dynamics of high-latitude convection, Space Sci. Rev., 71, 763–796, 1995. Grocott, A., Cowley, S. W. H., Sigwarth, J. B., Watermann, J. F.,
and Yeoman, T. K.: Excitation of twin-vortex flow in the night-side high-latitude ionosphere during an isolated substorm, Ann. Geophys., 20, 1577–1601, 2002.
Hamza, A. M., Huber, M., Lyatsky, W., Kustov, A. V., Andre, D., and Sofko, G.: Eastward convection jet at the poleward bound-ary of the nightside auroral oval, Geophys. Res. Lett., 17, 2809– 2812, 2000.
Karlsson, T., Marklund, G. T., Blomberg, L. G., and Malkki, A.: Subauroral electric fields observed by the Freja satellite: A sta-tistical study, J. Geophys. Res., 103, 4327–4341, 1998.
Koustov, A. V., Sofko, G. J., Andre, D., Danskin, D. W., and Benke-vitch, L.V.: Seasonal variation of HF radar F region echo oc-currence in the midnight sector, J. Geophys. Res., 109, A06305,
1608 A. V. Koustov et al. : Observations of high-velocity SAPS-like flows
doi:10.1029/2003JA010337, 2004.
Koustov, A. V., Danskin, D. W., Makarevitch, R. A., and Gorin, J. D.: On the relationship between the velocity of E-region HF echoes and ExB plasma drift, Ann. Geophys., 23, 371–378, 2005.
Lacroix, P. J. and Moorcroft, D. R.: Ion-acoustic HF radar echoes at high latitudes and far ranges, J. Geophys. Res., 106, 29 091– 29 103, 2001.
Parkinson, M. L., Devlin, J. C., Ye, H., Waters, C. J., Dyson, P. L., Breed, A. M., and Morris, R. J.: On the occurrence and motion of decameter-scale irregularities in the sub-auroral, auroral, and polar cap ionosphere, Ann. Geophys., 21, 1847–1868, 2003a. Parkinson, M. L., Pinnock, M., Ye, H., Hairston, M. R., Devlin,
J. C., Dyson, P. L., Morris, R. J., and Ponomarenko, P.: On the lifetime and extent of an auroral westward flow channel (AWFC) observed during a magnetospheric substorm, Ann. Geophys., 21, 893–913, 2003b.
Parkinson, M. L., Dyson, P. L., and Pinnock, M.: The impor-tance of auroral westward flow channels in substorm evolution, Advances in Space Research, doi:10.1016/j.asr.2005.08.028, in press, 2005a.
Parkinson, M. L., Pinnock, M., Wild, J., Lester, M., Yeoman, T. K., Milan, S. E., Ye, H., Devlin, J. C., Frey, H. U., and Kikuchi, T.: Interhemispheric asymmetries in the occurrence of magneti-cally conjugate sub-auroral polarization streams, Ann. Geophys., 23, 1371–1390, 2005b.
Provan, G., Lester, M., Mende, S. B., and Milan, S. E.: Statistical study of high-latitude plasma flow during magnetospheric sub-storms, Ann. Geophys., 22, 3607–3624, 2004.
Ridley, A. J. and Liemohn, M. W.: A model-derived storm time asymmetric ring current driven electric field description, J. Geo-phys. Res., 107, 1151, doi:10.1029/2001JA000051, 2002. Ruohoniemi, J. M. and Greenwald, R. A.: Rates of scattering
occur-rence in routine HF radar observations during solar cycle maxi-mum, Radio Sci., 32, 1051–1070, 1997.
Ruohoniemi, J. M. and Baker, K. B.: Large-scale imaging of high-latitude convection with Super Dual Auroral Radar Network HF radar observations, J. Geophys. Res., 103, 20 797–20 811, 1998. Spiro, R. W., Heelis, R. A., and Hanson, W. B.: Rapid subauroral drifts observed by Atmospheric Explorer C, Geophys. Res. Lett., 6, 657–660, 1979.
Yeh, H. C., Foster, J. C., Rich, F. J., and Swider, W.: Storm time electric field penetration observed at mid-latitude, J. Geophys. Res., 96, 5707–5721, 1991.