HAL Id: hal-00316228
https://hal.archives-ouvertes.fr/hal-00316228
Submitted on 1 Jan 1996
HAL is a multi-disciplinary open access
archive for the deposit and dissemination of sci-entific research documents, whether they are pub-lished or not. The documents may come from teaching and research institutions in France or abroad, or from public or private research centers.
L’archive ouverte pluridisciplinaire HAL, est destinée au dépôt et à la diffusion de documents scientifiques de niveau recherche, publiés ou non, émanant des établissements d’enseignement et de recherche français ou étrangers, des laboratoires publics ou privés.
On the frequency modulation of VLF emissions
M. Goncharova, W. Lyatsky
To cite this version:
M. Goncharova, W. Lyatsky. On the frequency modulation of VLF emissions. Annales Geophysicae, European Geosciences Union, 1996, 14 (11), pp.1151-1158. �hal-00316228�
Ann. Geophysicae 14, 1151—1158 (1996) ( EGS — Springer-Verlag 1996
On the frequency modulation of VLF emissions
M. Goncharova, W. LyatskyPolar Geophysical Institute, Apatity 184200, Russia
Received: 6 September 1995/Revised: 20 May 1996/Accepted: 21 May 1996
Abstract. The VLF-wave frequency modulation efficiency as a function of magnetosphere plasma parameters under the weak pitch-angle diffusion regime is studied. The study is based on the VLF growth-rate modulation both in the magnetosphere equatorial plane and after integrating along the magnetic field line. It is shown that for the typical quiet magnetosphere plasma parameters the relative shift of the maximum intensity frequency Dum/um is approximately equal to relative disturbance of the magnetic field in the magnetosphere equatorial plane, but may exceed it when both electron temperature anisotropy and the parameter abEare small; herea is the total-to-warm electron content
ratio andbEis the electron parallel beta. It is also shown that relative shift of the maximum intensity frequency Dum/um after integrating along the field line is not less than 50% from its value at the equatorial plane, which allows the use of the equatorial-plasma-parameter data to esti-mate the VLF frequency modulation on the ground. The upper cut-off frequency modulation is considered as well. The calculated theoretical sonagrams show that this fre-quency modulation may be related to the non-dispersive and to the ‘‘inverted-V’’ structures of QP hiss.
1 Introduction
Frequency modulation in VLF range is closely associated with the observed intensity variations; it is most common for so-called quasi-periodic (QP) emissions observed out-side the plasmapause (Sato et al., 1974; Likhter and Saz-hin, 1980; Sato and Kokubun 1980, 1981; Sato and Fukunishi, 1981; Tixier and Cornilleau-Wehrlin, 1986; Sazhin and Hayakawa, 1994). The frequency modulation appears either as variations of the upper and lower emis-sion frequency boundaries or as variations of the emisemis-sion
Correspondence to: M. Goncharova
maximum frequency that is a frequency of maximum amplitude. In the first case, the maximum amplitude fre-quency of the QP emission remains almost invariable while the frequency band pulses, the modulated emission refers to non-dispersive type (Sato and Kokubun, 1980; Sato and Fukunishi, 1981). But if the maximum amplitude frequency varies, the emission refers to dispersive type (Sato and Fukunishi, 1981). As was claimed by Sato and Fukunishi (1981), almost 75% of non-dispersive emissions and most diffuse rising tones are associated with concur-rent magnetic pulsations [such QP events are classified by Sato et al. (1974) as QP1] of the same period as that of the modulation. The modulation depth of the upper hiss boundary may be as large as 20% (Sato and Fukunishi, 1981).
As was estimated by Tixier and Cornilleau-Wehrlin (1986), the experimental value of the upper cut-off fre-quency shift appears to be too large to be consistent with the theoretical value given by the modulation mechanism proposed by Coroniti and Kennel (1970) when the weak pitch-angle diffusion regime of electrons is assumed. In the concept of Coroniti and Kennel, the electron cyclotron instability is disturbed by the compressional component of the geomagnetic pulsation. This idea was used by Sato and Fukunishi (1981) when proposing the possible way of diffuse rising tone formation: they supposed a mag-netosonic wave propagating radially toward the Earth which excites consequently more and more lower L-shells. The Coroniti-Kennel mechanism has also been used by Haugstad (1976), who studied the emission upper cut-off frequency behaviour under the strong and weak electron pitch-angle diffusion regime. Haugstad (1976) had argued that the variations in upper cut-off frequency are in phase with causative magnetic pulsations of the weak diffusion and in opposite phase for the strong pitch-angle diffusion regime.
The aim of the actual paper is to examine theoretically the VLF-wave frequency modulation efficiency as a func-tion of magnetosphere plasma parameters. The study of the response of both the local and the field-line-integrated
VLF growth rate to the magnetic-field oscillations is held in the framework of the Coroniti-Kennel mechanism of the interaction for a case of weak pitch-angle diffusion. In the calculations a dipole model of the geomagnetic field is used. Sample f-t diagrams for some VLF-ULF interaction situations are simulated.
2 The model description
Consider a plane magnetosonic wave propagating radially towards the Earth in the magnetosphere equato-rial plane (Fig. 1). VLF waves are assumed to be amplified in a limited region near by the equatorial plane in a thin L-shell range wherein the magnetic-field component Bz oscillates as sin (Xt) where X is the magnetosonic wave frequency. Field-aligned VLF wave propagation is as-sumed.
The model of a mixed cold-warm plasma system by Cuperman and Landau (1974) with bi-Maxwellian distri-bution of warm electrons is used. The constancy of the anisotropy function during the VLF-wave amplification is assumed is approximately true for the regime of weak pitch-angle diffusion.
The VLF-wave growth rate, c, derived by Cuperman and Landau (1974), we write as follows:
c"
A
n2B
1@2 Xe aJabA
D! 1 1!xB
(1!x)3 ]A
1!x xB
1@2expA
!(1!x)3 2abxB
, (1) where c"Im u; x"Re u/Xe is the normalized VLF-wave frequency; Reu and Imu are the real and imaginary terms of the VLF-wave complex frequencyu; Xe"eB/mec is the electron gyrofrequency; D"¹M/¹Eis the anisotropyfactor for warm electrons;a"n/nw is the electron-num-ber-density ratio, where n refers to total- and nw to warm-electron content, respectively. b"4nnw¹E/B2 is the
electron parallel beta and B is the ambient magnetic field. Equation 1 is valid forbE(1 and for the anisotropy
A"(¹M/¹E!1) small as compared to unity. Then the condition D(2 has to be satisfied.
Fig. 1. Geometry of the problem. The VLF wave propagating in the thin flux tube is amplified in the small region (shaded) near the equatorial plane. The magnetic field Bz inside the flux tube is believed to pulse as sinXt, where X is the perturbation frequency
In the absence of perturbation, the number density of warm electrons is assumed to be the same at any point of the VLF amplification region, whereas the cold plasma density is assumed to vary along the field line so that the Alfve´n velocity remains constant.
The whistler-mode dispersion relation used throughout the paper is (Cuperman and Landau, 1974):
k2vN2E
X2eab"
x
1!x, (2)
where k is the VLF-wave number and vNE is the field-aligned warm-electron thermal velocity.
The magnetosphere plasma parameters controlling the VLF growth-rate modulation efficiency are: (i) the aniso-tropy factor D as being responsible for the instability and (ii) the ratio between the electron thermal parallel velocity square and electron Alfve´n velocity square vN 2E/v2Ae"abEas
determining the resonance condition. Either of these fac-tors appears in Eq. 1; also, in the frame of the model these factors conserve their values along the magnetic field line and thus can characterize plasma over all the interaction region. Hereafter all used plasma-parameter values refer-ring to undisturbed plasma are denoted by the subscript ‘‘0’’.
3 VLF-wave frequency modulation in the magnetosphere equatorial plane
The aim of this section is to examine the sensitivity of the VLF maximum growth-rate frequency and upper cut-off frequency response to a magnetic-field disturbance, as a function of the magnetosphere plasma parameters,
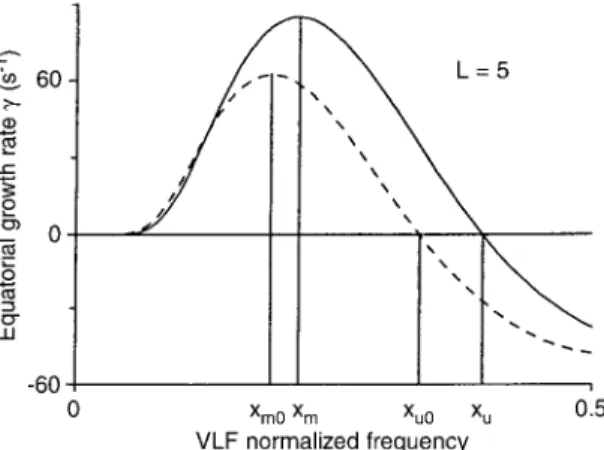
D and abE, in the equatorial plane. An example of the VLF-wave growth-rate behaviour in the equatorial plane given by Eq. 1 is presented in Fig. 2, where the maximum amplitude frequency, xm, corresponds to frequency with a maximum VLF growth rate in the equatorial plane, and the upper cut-off frequency, xu, is the frequency corres-ponding to a zero value of the growth rate. Figure 2 is calculated for the following plasma-parameter set: L"5,
n"1 cm~3, n/nw"10, bE"0.1, D"1.5.
Assume the z-axis coincides with the undisturbed-mag-netic-field direction. Consider a normalized amplitude oscillation in the equatorial plane to be e"(Bz!Bz0)/
Bz0"em sin(Xt), where X is the disturbance (Pc3-4)
fre-quency. Take into account only the vM variations due to first adiabatic invariant conservation and ignore the vM and vE perturbations due to the pitch-angle diffusion. Then for any point of the field line
Xe"Xe0(1#e) D"D0(1#e) bE"bE 0(1#e)~1 a"a0 v2Ae"(v2Ae)0(1#e). (3)
Fig. 3. ¸eft panel: frequency of the max-imum equatorial growth rate againstabE
for D"1.1 and D"2 obtained from an accurate formula (Eq. 6) (solid line) and from its linear approximation (Eq. 7) (dashed); right panel: maximum intensity frequency xm as a function of D and abEin
the equatorial plane Fig. 2. Undisturbed (dashed curve) and disturbed (solid) VLF
growth rate in the equatorial plane against normalized VLF fre-quency x"u/Xe, where u and X%, are the VLF-wave frequency and electron gyrofrequency, respectively. Frequency of maximum growth rate xm"um/Xe and frequency of upper cut-off xu"uu/Xe are shown. Computations are made for L"5, total-to-warm plasma density ratioa"n/nw"10, abE"1, D"1.5, total-electron number density n"1 cm~3
The upper cut-off frequency, xu, at any point of the field line is found according to Eq. 1 from
D!1/(1!xu)"0, (4)
where xu"uu/Xe. The upper cut-off modulation depth is defined by: Duu uu0" x@u!xu0 xu0 " e 1!1/D0" e xu0, (5)
where Duu"uu!uu0, x@u"uu/Xe0 and xu0"uu0/Xe0. Thus the Duu value keeps constant along the magnetic field line.
Hence, the less the anisotropy, the stronger the upper cut-off modulation. From Eq. 5 it follows also thatDuu changes by the same law ase does, and thus they oscillate in phase, as was pointed out earlier by Haugstad (1976) for the weak diffusion regime.
The maximum amplitude frequency, xm, can be derived from the condition dc/dx"0, where c is given by Eq. 1.
This results in 1 2xm# 1 D(1!xm)!1!(1!xm)3(1#2xm)2abEx2m #3"0. (6)
As seen from Eq. 6 the value of xm is determined com-pletely by D and abE magnetosphere parameters. Equa-tion 6 can be linearized:
xm"(abE)#1#D/(D!1)1 . (7) This approximation is valid for
xm@1 xm@ababEE(5D!4)#2D!3(D!1)#2D!1 . (8)
Figure 3 (left panel) exhibits calculation results of xm given by Eq. 6 and xm obtained from its linear approximation (Eq. 7) for two values of D. As seen in the figure, Eq. 8 allows us to estimate the values of xm with good accuracy. On the right panel of Fig. 3 the undisturbed frequency of maximum emission intensity as a function of
D andabEis shown. Figure 3 indicates the area where xm is
the most sensitive to D andabEincrements. This area is located near low D and low abE values. Note that
drop-ping the xm0 value with decreasing the factor D in Fig. 3 is in agreement with Eq. 4, which corresponds to the critical anisotropy defined by Kennel and Petscheck (1966). As seen within the considered D andabEranges, xm0 remains small as compared to unity.
The modulation depth of maximum growth-rate fre-quency is:
Dum um0"
x@m!xm0
xm0 , (9)
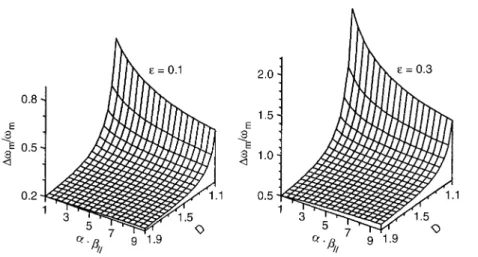
whereDum"um!um0, x@m"um/X0 and xm0"um0/X0. In Fig. 4 theDum/um0 value obtained using Eqs. 6 and 3 in the equatorial plane as a function ofabE
0and D0 is presented for moderate and strong perturbation of the magnetic field. As seen from Fig. 4, the value ofDum/um is not less than 20% fore"DB/B"0.1, and not less than
Fig. 4. Relative frequency shift of maximum in the equatorial growth rate as a function ofabEand D for moderate (e"0.1) and strong (e"0.3) perturbation of the magnetic field, Bz, in the magnetosphere equatorial plane,e"DBz/Bz
50% fore"0.3. It is also seen that the deepest modula-tion of xm corresponds to low D-parameter value; the closer the D is to 2, the less the modulation depth, and for
D'1.5 there is in fact no dependence on D and abE
values. Note that the maximum ofDum/um in Fig. 4 cor-responds to a range of D andabEvalues in Fig. 3 where xm
is, on the one hand, a sharp changing function of D orabE parameters and, on the other hand, relatively low. As seen from Fig. 3 it corresponds to a region of low D value.
4 Frequency modulation of the VLF wave after integrating along the field line
Integratingc, given by Eq. 1, along the dipole magnetic field line yields a path-integrated growth rate
C"`z: ~z
c(z)
vVLFdz, (10)
where integrating is carried out along the field line and
vVLF is the VLF-wave group velocity. For rough
numer-ical estimation of C value as vVLF the electron Alfve´n velocity has been used. As an integrating z-interval, the length of the VLF-wave amplification region along the magnetic field line was accepted corresponding to +$45° of magnetic latitude. Out of this region the c value is in fact zero for most of the range 0(x0%2(1 (see Fig. 5).
Compare the frequency modulation of the equatorial growth ratec with that of the path-integrated growth rate C. Neglecting dispersion effects, we may consider the frequency modulation based on the path-integrated growth rate to correspond to the ground observations.
4.1 Maximum intensity frequency modulation
The behaviour of the undisturbed VLF-wave growth rate along the magnetic field line for various equatorial nor-malized frequencies x0 is shown in Fig. 5. Calculations are made for L"5, n"1 cm~3, n/nw"10, bE"0.1 and
Fig. 5. Unperturbed growth-rate behaviour along the magnetic field line for several normalized VLF frequencies x. Computations are made for L"5 and for magnetosphere plasma parameters D"1.5, abE"1, a"10; x"0.19 corresponds to the maximum equatorial growth rate, x"0.23 is the frequency of the maximum path-integrated growth rate, x"0.33 is the upper cut-off frequency in the equatorial plane (no wave generation in the equatorial plane) and x"0.47 is the frequency of zero path-integrated growth rate D"1.5. As seen from the figure, the frequency at
which the area bounded by the horizontal axis and the c-curve is maximum (that is, the path-integrated growth rate, C, is maximum), x"0.23, is close to but slightly exceeds the frequency of maximum c in the equatorial plane, x"0.19.
It is interesting to compare the sensitivity of these two frequencies to the perturbation of the magnetosphere plasma parameters.
The ratio of the relative shifts (Dum/um)C and (Dum/um)%2 of emission maximum frequency um for path-integrated and equatorial values of the VLF growth rate, respectively, is in Fig. 6 presented as a function ofabE
0and
D0 parameters. Calculations are made for L"5, n"1 cm~3, bE"0.1 ande"0.06 (the latter corresponds to the disturbance amplitude of 15 nT).
As seen from Fig. 6, the shift of the maximum growth-rate frequency after integrating along the field line is systematically lower than that in the magnetosphere equa-torial plane. The difference increases by as much as two times when the anisotropy factor D grows from 1 to 2.
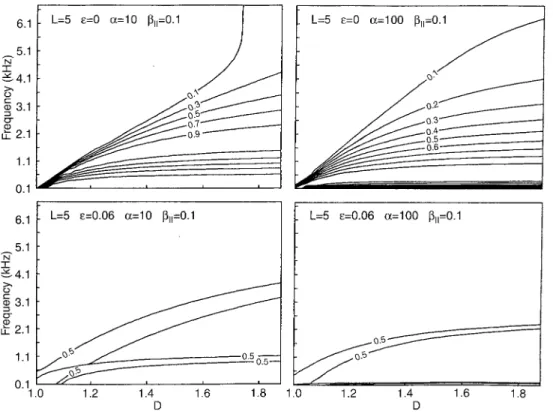
Fig. 7. ¹op panel: undisturbed VLF-wave generation band as a function of electron anisotropy factor D"¹M/¹Efor two values
of the magnetosphere electron plasma parameterabE. Both
a"n/n8!3. and bEvalues in the
figure are given for the equatorial plane. ¸abels on curves denote the logarithm of the VLF-wave out-put intensity inC/C.!9 value units, whereC is the path-integ-rated growth rate andC.!9 is its maximum value for given D and abE. Bottom panel: in the same
frame the VLF-wave generation band cut at level 0.5 in presence of the magnetic-field perturbation of 15-nT amplitude. Upper and lower band positions correspond to positive and negative phases, respectively, of the magnetic-field perturbation
Fig. 6. Relationship between relative frequency shift of the VLF emission maximum at the output of the amplification region and the relative frequency shift of the maximum growth rate in the equato-rial plane as a function ofabE
Figure 6 allows us to use the results on frequency modula-tion in the magnetosphere equatorial plane presented in Fig. 4 to estimate the modulation value after propagation of the wave along the magnetic field line. It implies parti-cularly that frequency modulation on the ground would have the same tendency as shown in Fig. 4: the maximum intensity frequency shift would be larger for D&1 (D remains, however, greater than 1); that is, the magneto-sphere plasma with low anisotropy provides more re-markable frequency modulation. Besides, the frequency modulation after integrating along the field line is about or more than 10%—25% fore"0.1 and 0.3 in the mag-netosphere equatorial plane, respectively.
4.2 Generated-frequency-band modulation
In Fig. 7 the undisturbed generated frequency band (given by isocontours of the path-integrated growth rate) as a function of the warm-electron anisotropy factor D is shown. Two values of the parameterabEdistinguish one from the other by warm plasma content. Curve labels denote C/C.!9 values where the path-integrated growth rateC is given by Eq. 10 and C.!9 is a function of D and abEonly.
It is suitable for analysis to consider the frequency band cut at a levelC"0.5 C.!9; note that emissions at lower intensity levels may be difficult to extract from the back-ground noise.
In Fig. 7, lower panel, two positions of the gener-ated frequency band cut at level 0.5 are exhibited for two phases of the magnetosonic wave perturbing the VLF amplification region at the fifth L-shell. The upper position corresponds to #15 nT of magnetic-field per-turbation and the lower corresponds to !15 nT. Com-parison of the left and right parts in the lower panel indicates that when the warm plasma content is large enough (a"n/n8!3."10), and hence the abE value is low, the generated frequency band is disposed to be systematically higher than when the warm plasma content is poor (a"100). The sensitivity of the emis-sion upper boundary at level 0.5 to the perturbations increases as the factor D drops, and is higher for low values of the parameterabE. In the case of relatively high abE, the emission lower boundary does not in fact
respond to the factor-D changes, and the remarkable variations may be observed at the emission upper bound-ary only.
Fig. 8. Theoretical frequency-time diagrams of path-integrated growth rates for two L-shells. The time evolution of the relative disturbance amplitude in the equatorial plane at the top panel is shown. Computations are made for magnetosphere plasma
para-meters abE"1, D"1.5, n"1 cm
~3, a"n/n8!3."10, the mag-netic-field disturbance amplitude in the VLF amplification region is 15 nT
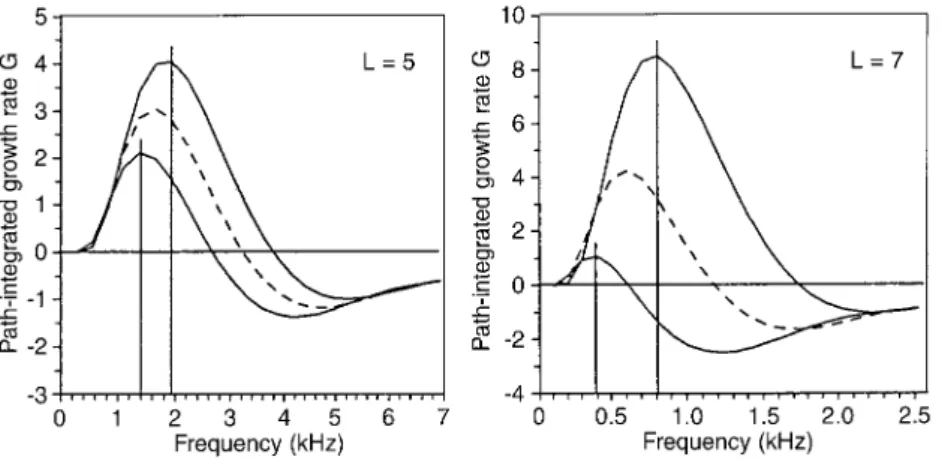
Fig. 9. Path-integrated growth rate against fre-quency for L"5 and L"7 shells (the output spectrum of VLF emission) for two phases of the magnetic-field perturbation (solid). The dashed
line corresponds to undisturbed conditions. The
figure demonstrates more clearly the frequency shifts seen in Fig. 8
As follows from our results, the significant modulation of both upper and lower emission boundaries (taken at level 0.5 from the emission-intensity maximum) can be observed on the ground even by the weak pitch-angle diffusion regime. So, at the fifth L-shell, with a magnetic perturbation amplitude of 15 nT, the variation of both upper and lower emission boundaries forabE"10 would reach 25% for D"1.2 and 18% and 10%, respectively, for D"1.5. ForabE"100, the upper-boundary frequency shift is roughly 15% for D"1.2.
As seen in Fig. 7, the factor D controls more effectively the upper-boundary frequency position than the para-meter abE does. Figure 7 shows also that for lower abE values, the disturbed frequency band will in fact shift as a whole, giving a possibility of the inverted-V structure formation. As to higherabEvalues, the modulation ought to be observed at the upper emission boundary only, which provides the non-dispersive QP hisses. Note how-ever, that the behaviour of the upper boundary frequency depends on the choice of the intensity level, as illustrated by the comparison of curves for 0.5 and 0.1 levels in Fig. 7, upper panel.
In fact the upper emission boundary visible in ground sonagrams is strongly affected by the VLF-wave propaga-tion condipropaga-tions. Emissions at frequencies exceeding one-half of the equatorial gyrofrequency are poorly guided by
the field-aligned plasma irregularities (Helliwell, 1965). When the upper emission boundary at the chosen level reaches 0.5Xe, the upper cut-off frequency starts to co-incide with so-called duct cut-off, and its variation is defined by a simple expression
u$6#5u :0.5Xe0(1#e), (11) where Xe0 is the undisturbed equatorial gyrofrequency. Note that in this case the variation ofDu$6#5
u "0.5e · Xe0 does not depend on ambient magnetic field, and this value is approximately the same at different L-shells.
5 Some examples of theoretical sonagrams
The considered model allows us to calculate theoretically the sonagrams (f-t diagrams) expected on the ground after propagation of the VLF wave (assumed initially to be ‘‘white noise’’) along the magnetic field line.
Two samples of the calculated theoretical sonagrams of the VLF wave are presented in Fig. 8. The magnetic dis-turbance in the magnetosphere equatorial plane was as-sumed to be $15 nT and henceem"0.06 at L"5 and em"0.17 at L"7. The following plasma parameters in the magnetosphere equatorial plane are summed: D"1.5, abE"1,a"n/n8!3."10.
Figure 8 shows the path-integrated growth rate as a function of the VLF frequency and time. As seen, both sonagrams may be related to weak inverted-V structures of QP hiss, the modulation on the left panel (for L"5) is even closer to the non-dispersive type. The disturbance starts at t"10 s and has a period of 30 s. One can see that the variations of the maximum intensity frequency and upper cut-off frequency coincide in phase withe(t), whose maximum and minimum appear at t"17.5 and 32.5 s, respectively.
Figure 9 shows the calculated path-integrated growth rate against frequency for L"5 and L"7 shells (the output spectrum of VLF emission in fact) for two phases of the magnetic-field perturbation corresponding to the maximum and minimum of the effect in the frequency modulation (solid lines). The dashed line corresponds to undisturbed condition. The figure exhibits more clearly the frequency shifts observed in Fig. 8.
The upper cut-off frequency in Figs. 8 and 9 is shifted up to 0.6 kHz at L"5 and L"7, that is by 18% and 50%, respectively. The modulation depth of the emission maximum frequency is about 18% at L"5 and about 30% at L"7.
The calculated results show that the VLF frequency modulation due to interaction between geomagnetic pul-sations and VLF emission near the magnetosphere equa-torial plane under the weak pitch-angle diffusion regime may be rather significant (of order of 10%—20% in max-imum amplitude frequency of the VLF emission) and may explain some of observed cases of the VLF frequency modulation.
6 Conclusions
In the present paper the efficiency of the VLF-wave frequency modulation by geomagnetic pulsations in the Pc3-4 period-range as a function of the mag-netosphere plasma parameters is considered. Those parameters are the electron-temperature anisotropy factor D"¹M/¹Eand the abEparameter, wherea is the
total-to-warm electron concentration ratio andbEis the electron parallel beta. The factor D was assumed to be more than 1 but less than 2; theabEchange interval was chosen from 0.5 to 10. The maximum intensity frequency and the upper cut-off frequency modulation study is based on the VLF growth-rate modulation, both in the mag-netosphere equatorial plane and after integrating along the magnetic field line. The following results have been obtained:
1. Numerical calculations of the VLF growth-rate modulation in the magnetosphere equatorial plane have shown that a relative shift of the maximum intensity frequency Dum/um is approximately inversely propor-tional to the anisotropy factor D, and depends weakly on abEfor D'1.5; for smaller D theDum/um value increases
whenabEdrops. Note that maximum values of Dum/um
correspond to small D andabEvalues.
For the typical quiet magnetosphere plasma conditions at L"5 (B"250 nT, Ne"1 cm~3) and for the warm plasma content of about 10% in the magnetosphere
equa-torial plane, the relative shift of the maximum intensity frequencyDum/um is not less than 10% for the magnetic disturbance in the equatorial plane e"0.1 and 25% for e"0.3.
2. The emission maximum frequency on the ground has shown to be slightly higher than the frequency of the maximum growth rate in the equatorial plane. However, the variations of the former appear to be weaker than the variations of the latter (up to two times weaker at L"5 for typical quiet magnetosphere conditions). The obtained results allows us also to estimate the ground-observed variation of the maximum intensity frequency when mag-netosphere-plasma-parameter values near the equatorial plane are known.
3. The calculation results show that a significant modulation of the emission frequency band can be ob-served by the weak diffusion regime. At L"5 for the magnetic perturbation of $15 nT in the VLF amplifica-tion region the variaamplifica-tion of both upper and lower emis-sion boundaries at level 0.5 from the emisemis-sion intensity maximum may reach 10%—25% for reasonable values of the anisotropy factor D"1.2—1.5. The considered mecha-nism allows us to obtain both inverted-V and non-disper-sive structures of QP hisses.
When the emission-boundary frequency exceeds the duct cut-off frequency, a variation of the emission upper cut-off is given by Eq. 11; it appears, therefore, to depend on the perturbation amplitude only, and is in phase with the magnetic-field oscillations.
4. Examples of calculated theoretical sonagrams show that the remarkable modulation is present both at the maximum intensity frequency and at the emission boundaries. The exhibited modulation type may be refer-red to intermediate type between QP inverted-V struc-tures and non-dispersive QP hiss (Sato and Fukunishi, 1981).
Acknowledgements. Topical Editor K.-H. Glaßmeier thanks N.
Cor-nilleau-Wehrlin and another referee for their help in evaluating this paper.
References
Coroniti, F. V., and C. F. Kennel, Auroral micropulsation instability,
J. Geophys. Res., 75, 1863—1878, 1970.
Cuperman, S., and R. W. Landau, On the enhancement of the whistler mode instability in the magnetosphere by cold plasma injection, J. Geophys. Res., 79, 128—134, 1974.
Haugstad, B. S., Upper cut-off frequency changes in quasi-periodic emission events, J. Atmos. ¹err. Phys., 38, 781—784, 1976. Helliwell, R. A., ¼histlers and related ionospheric phenomena,
Stan-ford Univ. Press, Calif., 1965.
Likhter, Ya. I., and S. S. Sazhin, On the frequency shift in modulated VLF emissions, J. Atmos. ¹err. Phys., 42, 381—384, 1980. Kennel, C. F., and H. E. Petschek, Limit on stably trapped particle
fluxes, J. Geophys. Res., 71, 1—28, 1966.
Sato, N., and H. Fukunishi, Interaction between ELF-VLF emis-sions and magnetic pulsations: classification of quasi-periodic ELF-VLF emissions based on frequency-time spectra, J.
Geo-phys. Res., 86, 19—29, 1981.
Sato, N., and S. Kokubun, Interaction between ELF-VLF emissions and magnetic pulsations: quasi-periodic ELF-VLF emissions associated with Pc3-4 magnetic pulsations and their geomagnetic conjugacy, J. Geophys. Res., 85, 101—113, 1980.
Sato, N., and S. Kokubun, Interaction between ELF-VLF emissions and magnetic pulsations: regular period ELF-VLF pulsations and their geomagnetic conjugacy, J. Geophys. Res., 86, 9—18, 1981.
Sato, N., K. Hayashi, S. Kokubun, T. Oguti, and H. Fukunishi, Relationship between quasi-periodic VLF-emissions and geomagnetic pulsations, J. Atmos. ¹err. Phys., 36, 1515—1526, 1974.
Sazhin, S. S., and M. Hayakawa, Perodic and quasi-periodic VLF emissions, J. Atmos. ¹err. Phys., 56, 735—753, 1994.
Tixier, M., and N. Cornilleau-Wehrlin, How are the VLF quasi-periodic emissions controlled by harmonics of field-line os-cillations? The results of a comparison between ground and GEOS satellite measurements, J. Geophys. Res., 91, 6899—6919, 1986.
.