HAL Id: insu-00853377
https://hal-insu.archives-ouvertes.fr/insu-00853377
Submitted on 8 Sep 2014
HAL is a multi-disciplinary open access
archive for the deposit and dissemination of sci-entific research documents, whether they are pub-lished or not. The documents may come from teaching and research institutions in France or abroad, or from public or private research centers.
L’archive ouverte pluridisciplinaire HAL, est destinée au dépôt et à la diffusion de documents scientifiques de niveau recherche, publiés ou non, émanant des établissements d’enseignement et de recherche français ou étrangers, des laboratoires publics ou privés.
Increased nitrogen availability in soil after repeated
compost applications: Use of the PASTIS model to
separate short and long-term effects
Maha Chalhoub, Patricia Garnier, Yves Coquet, Bruno Mary, Francois
Lafolie, Sabine Houot
To cite this version:
Maha Chalhoub, Patricia Garnier, Yves Coquet, Bruno Mary, Francois Lafolie, et al.. Increased nitrogen availability in soil after repeated compost applications: Use of the PASTIS model to sep-arate short and long-term effects. Soil Biology and Biochemistry, Elsevier, 2013, 65, pp.144-157. �10.1016/j.soilbio.2013.05.023�. �insu-00853377�
Increased nitrogen availability in soil after repeated compost applications:
use of the PASTIS model to separate short and long-term effects.
Maha CHALHOUB a, Patricia GARNIER a, Yves COQUET b, Bruno MARY c, François LAFOLIE d, Sabine HOUOT a*
a.INRA, UMR 1091 INRA-AgroParisTech Environnement et Grandes Cultures, F-78850, Thiverval Grignon, France
b.AgroParisTech, UMR 1091 INRA-AgroParisTech Environnement et Grandes Cultures, F-78850, Thiverval Grignon, France
c.INRA, US 1158 Agro-Impact, F-02000 Barenton Bugny, France d. INRA, UMR1114 INRA-UAPV EMMAH, F-84914 Avignon, France
* Corresponding author: Sabine Houot
INRA, UMR 1091 INRA-AgroParisTech Environnement et Grandes Cultures, F-78850, Thiverval Grignon, France
[email protected] Tel : +33 130815401
Abstract
Regular application of composts on cropped soils has been shown to restore soil organic matter contents. The effect of repeated applications of three urban composts on the nitrogen (N) dynamics in a cropped loamy soil was compared to farmyard manure application and a control receiving no amendment. Each amendment application brought on average 250 to 400 kg ha-1of total N. After five applications, total organic N increased in amended soils from 9 to 27% compared to control and the increase of soil organic N corresponded to 32 to 79% of total N brought by the amendments. The PASTIS model was used to describe the N balance in the soil-plant system during the 2 years after a sixth amendment application and provided correct predictions of N dynamics in cropped plots. The N availability increased in all treatments receiving organic amendments. The N availability in the soils amended with urban composts or manure was predominantly driven by the biodegradability of the organic amendments, their mineral N content and by the cropping conditions. Composts with high biodegradability exhibited higher proportion of N recovery by plants (21% for the municipal solid waste compost) during the year following their application, while more stabilised composts (biowaste compost, co-compost of sludge and green wastes) increased the N availability mainly through the increase of soil organic N content and mineralisation after several compost applications (6 to 8% of the soil organic N increase). Mature composts behaved comparably to FYM, except that for FYM very little N from the last application was available. Regular compost applications equivalent to 200 kg N ha-1 every other year could increase N availability for crops of 50 to 70 kg N ha-1over the 2 years of the crop rotation. However, the most stabilised composts led to a higher crop N recovery but also to potential higher amounts of leached N compared to less mature composts.
Keywords: Nitrogen mineralisation, compost, PASTIS model, long-term, organic matter
1.Introduction
The recycling of urban composts on cropped soils has been shown to restore soil organic matter contents (Peltre et al., 2012). The related increase of organic nitrogen (N) affects the N dynamics in soil. The progressive release of mineralised N from both soil and compost organic forms makes the assessment of N availability for crops difficult and raises the environmental risks of groundwater contamination related to leaching of an excessive or unbalanced supply of nutrients (Mamo et al., 1999). To improve the uptake of N by crops and reduce N losses through leaching remains a challenge (Singh et al., 2001). The N availability in composts depends on the stability of their organic matter, thus on compost maturity and on their physico-chemical characteristics. The carbon to nitrogen ratio (C/N) has been discussed as a relevant indicator of compost maturity (Cooperband et al., 2003) and has been commonly used to predict N availability. Composts with high C/N ratio (>15) often limit N availability due to immobilisation of N in the soil (Amlinger et al., 2003; Gutser et al., 2005). The N dynamics in soil after compost incorporation can also be affected by environmental conditions (e.g., soil type, climate) and management practices (e.g., rate and frequency of compost application, crop rotation, etc.), which makes the comparison of separate experiments difficult (Mamo et al., 1999; Wolkowski, 2003; Hartl and Erhart, 2005; Gutser et al., 2005). Long-term experiments contribute to a better understanding of the effect of repeated compost applications on N dynamics and N release from accumulated organic matter (Amlinger et al., 2003; Gutser et al., 2005). Modelling is a powerful tool to understand the complex interactions between agricultural practices and N dynamics in the soil-plant-water system and predict the potential environmental impacts such as N leaching after compost application (Gerke et al., 1999; Cabrera et al., 2005; Bruun et al., 2006).
Our study investigated the performance of different types of urban composts at increasing soil organic N and N availability for crops. The potential contamination of groundwater through mineral N leaching was also evaluated. The N dynamics after compost application was simulated with the soil-plant model PASTIS (Garnier et al., 2003), based on data from a long-term field trial in which the different urban composts were compared. The use of the PASTIS model made possible the distinction of the N fluxes that would have been impossible to measure at the field scale. The first objective was to investigate how the repeated applications of the composts increased the N availability for crops in soil and to distinguish between the short term direct effect related to the last compost application, and the longer term, related to the repeated previous applications and increased soil organic nitrogen stocks. The second objective was to relate the differences in N availability to the compost organic matter stabilities and chemical characteristics.
2.Materials and methods
2.1. Field experiment
A long-term field experiment located in Feucherolles (Yvelines, France) has been conducted since 1998 to characterise the benefits and potential environmental impacts of urban waste composts (Houot et al., 2002). Three different composts have been evaluated (Table 1): (i) a biowaste compost (BIO) resulting from the co-composting of green wastes and the source-separated organic fraction of municipal wastes; (ii) a municipal solid waste compost (MSW) made from mechanically separated organic fractions after selective collection of dry and clean packaging; and (iii) a co-compost of green wastes, wood chips and sewage sludge (GWS). The composting processes have been summarised in Table 1 and have been detailed in Annabi et al. (2007). The 3 composts were compared to farmyard manure (FYM), as a
reference amendment, and to a control treatment without organic application (CONT). The soil was a silt loam Glossic Luvisol (FAO classification) and the main physico-chemical characteristics are described in Table 1S of the supporting information. The field experiment included 4 replicate blocks of the 5 organic treatments randomly distributed within each block. All plots (10 m x 45 m) were separated by 6-m-wide cropped bands and the blocks by 25-m-high cropped bands to avoid contamination between treatments during application. All treatments received additional mineral N fertilisation calculated on the potential N balance in the treatments (solutions of urea and ammonium nitrate, containing 39 % nitrogen). The field was cropped with a winter wheat (Triticum aestivum L.) – corn maize (Zea mays L.) rotation. Composts and manure were applied on the wheat stubbles in early September of 1998, 2000, 2002, 2004 and 2006. In 2007, barley (Hordeum vulgare L.) was sown instead of maize, due to the presence of maize rootworm (Diabrotica virgifera). Additional organic application was performed in September 2007 on the barley stubble. All organic amendments were applied based on the same C rate, with an average of 4 Mg organic C ha-1 at each application (Table 1). The doses were 2 to 3 times larger than usually applied by the farmers. The organic amendments were incorporated to a depth of 14 cm by chisel ploughing the day after application. The N-NH4 losses through ammonia (NH3) volatilisation within the first 24 h
after amendment application were measured using field-based wind tunnel trials in 1998, 2002, 2004 and 2006. These losses reached on average 4, 16, 18 and 53% of the N-NH4
applied for BIO, GWS, MSW and FYM, respectively. The soil was ploughed every year in mid-October to mid-November to a depth of 30 cm with a four-furrow mouldboard plough.
Our study was conducted during the 2 years after the 6th application of the composts and manure from September 2007 to September 2009. The barley straw was exported, and only the barley stubble (measured as 30% of the total aerial biomass) was incorporated into the soil with the organic amendments by chisel ploughing on September 11th, 2007 (Table 2). Maize was sown on May 6th, 2008, and harvested on October 27th, 2008. Mineral N fertiliser was applied on April 28th, 2008, on only the control treatment (110 kg N ha-1) because the mineral N contents measured in all of the organic treatments were calculated as being sufficient to satisfy plant requirements. All of the maize residues (dry mass measured at harvesting) were incorporated into the ploughed layer prior to winter wheat sowing on October 31st, 2008. In all treatments, the wheat received two mineral N applications of 110 kg N ha-1 and 74 kg N ha-1 in March and April 2009, respectively. The wheat was harvested on August 30th, 2009.
The above-ground plant biomass (aerial biomass and grain yields) was measured by sampling 5 spots of 4 m2 and 10 spots of 0.25 m2 distributed within the entire surface of each plot for maize and wheat, respectively. The total dry matter of the aerial biomass and the grain yields were calculated (Mg ha-1) based on the moisture content of the aerial and grain subsamples. The total C and N contents in the grains and aerial biomass (stems plus leaves) were determined by elemental analysis (Table 2).
In one block, one-fourth of each plot was kept uncropped and bare to monitor the mineralisation of organic N issued from the recently applied organic amendments and humified soil organic matter in the soil. The uncropped area did not receive any mineral fertilisation. Eleven soil samplings were performed from September 2007 to September 2009 in the uncropped sections (six soil cores per sampling campaign and treatment). The cores were cut in 30 cm increments down to 120 cm. Mineral N was extracted on fresh homogenised soil samples during one hour (50 g soil/100 mL 1 M KCl) and analysed by colorimetry using a continuous flow analyser (Skalar, Breda, The Netherlands) for N-NH4+
and N-NO3-. The analytical results expressed as concentrations were converted to kg per ha
using the bulk density values (Table 1S of the supporting information).
Similar soil samplings for mineral N analysis were done in the cropped plots after barley harvest and before amendment application (July 11th, 2007), at the end of the first cold period (January 29th, 2008), before maize sowing and mineral N fertiliser application (April 2nd, 2008), immediately after maize harvesting (October 29th, 2008), at the end of the second cold period (February 11th, 2009) and after wheat harvest (September 3rd, 2009). Nine soil cores were sampled down to 90 cm and pooled into 3 samples for each depth.
All statistical analyses were performed using XLSTAT 2011 software. All measured data were subjected to ANOVA, and the Bonferroni test at p< 0.05 was used to determine significant differences between the treatments.
Daily climatic data were recorded onsite. Soil temperature was recorded daily at 0 and 160 cm soil depths using temperature sensors (Campbell Scientific, France). Tensiometers (7.5-cm long, 9.9-mm diameter ceramic ends) and time domain reflectometry probes (rod length 20 cm) have been installed at 7 depths (20, 40, 60, 80, 100, 130, and 160 cm) within one plot per treatment, to monitor the soil water pressure head and water content. The soil water potential and water content measurements have been recorded three times per week from November 2007 to October 2008.
2.3. Characterisation of soil organic matter
The ploughed layer (0-30 cm) was sampled in each plot before the first amendment application in September 1998 and before each further application including in September 2007 (10 pooled samples). In 2007, the soils were sieved to 4 mm immediately after sampling, and the microbial biomass C was determined using the fumigation extraction technique (Vance et al., 1987). The mineral N was extracted on fresh 4 mm-sieved samples
with 100 mL of 0.5 M KCl for 50 g of fresh soil samples. The total organic C and N contents were measured by elemental analysis of air dried 200-µm ground soil samples (Table 3).
The potential mineralisation of total soil organic C and N was assessed during 91-day incubations under controlled conditions (temperature of 28°C and gravimetric water content 23%). Fresh 4mm-seived soil samples (equivalent to 25 g of dry soil) were incubated in air-tight 500 mL jars, with one replicate for each plot leading to four replicates for each treatment, for either the organic C or N mineralisation measurements during separate parallel experiments. The C-CO2 was trapped in 10 mL of NaOH (0.5 M), which was periodically
sampled and replaced. The C-CO2 trapped in NaOH was analysed by colorimetry on a
continuous flow analyser (Skalar, The Netherlands). The opening renewed the jar atmosphere and maintained aerobic conditions. On the same dates, the mineral N (N-NH4+ and N-NO3-)
was extracted with 100 mL of 0.5 M KCl and then analysed by colorimetry on a continuous flow analyser (Skalar, The Netherlands). All jars incubated for N mineralisation were opened simultaneously to those used for C mineralisation to ensure aerobic conditions.
2.4. Characterisation of applied organic amendments
The FYM was kept in piles for two months in the field before application in September 2007, as for the previous applications. The composts were provided a few days before their application. All applied organic amendments were sampled during their application for analysis (Table 1). Mineral N was extracted with 200 mL of 0.5 M KCl from 50 g fresh samples and analysed as described previously. The organic amendments were then dried and ground to 1 mm before further analysis. Since mineral N is partly lost during the drying, it was measured again on dry 1mm-ground samples. The biochemical fractionation was performed using the Van Soest method as described in French Standard XPU 44-162 (AFNOR, 2009a) and adapted for the measurement of C and N in the biochemical fractions as
proposed by Doublet et al. (2011). Four biochemical fractions were isolated: “soluble” (SOL), "hemicellulose-like” (HCE), “cellulose-like” (CEL) and “lignin-like" (LIG). The total N and organic C contents within the different fractions were measured by elemental analysis (NA 1500, Fison Instrument, San Carlos, CA, USA) after additional grinding to 200µm (Retsch SM 2000, Haan, Germany). All results were expressed as a proportion of total organic C of the organic amendments. The kinetics of C and N mineralisation were measured for all of the organic amendments during incubation of soil-organic amendment mixtures under laboratory conditions as described above, following a standard method (AFNOR, 2009b). The soil used for the incubations was sampled in a plough layer (30 cm) from a control plot of the field experiment and used fresh and 4mm-seived. Each incubation was performed in 4 replicates. The added amounts of composts and manure (dry and 1mm-ground) were calculated to bring 50 mg of organic C for 25 g of soil. Mineral N was added at the beginning of the incubation (25 mg N-NO3 kg-1 soil). As previously all jars were regularly opened to ensure aerobic
conditions during incubations.
Total organic C and total N were measured on 200 µm-ground dry samples by dry combustion (combustion at 1000°C on a Thermo Scientific Flash 2000 Series CHNS/O, NF ISO 10694 for organic C and 13878 for total N). When necessary, the carbonates were measured and deduced from total C. Organic N was calculated by subtracting mineral N measured on dry samples from total N measured by dry combustion on dry samples. Total N of fresh samples was calculated by adding organic N and mineral N measured on fresh samples.
2.5. PASTIS model
The mechanistic PASTIS model (Garnier et al., 2003) includes three sub-models describing i) transport processes, ii) crop growth and nutrient uptake (plant module) and iii) C and N transformations in soil (CANTIS sub-model). The transport model is one-dimensional and
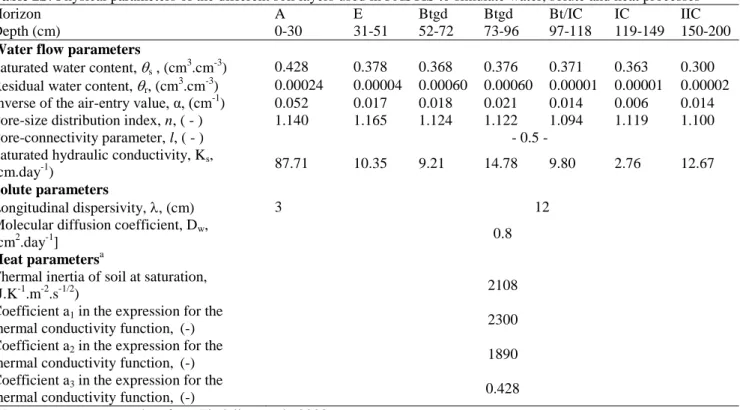
describes water flow based on Richard’s equation, the convection-dispersion equation for solute transport, and the convection-diffusion equation for heat flow. The water retention and the hydraulic conductivity curves were fitted with Mualem-van Genuchten’s equations (van Genuchten, 1980). Soil hydrodynamic dispersion is expressed as a function of soil dispersivity (L) and the molecular solute diffusion coefficient in water D0 (L2.T-1). The
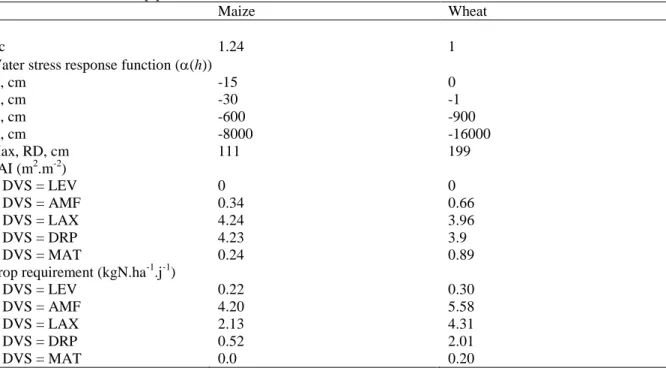
water and solute parameters are presented in Table 2S of the supporting information. The hydraulic parameters of the van Genuchten’s functions were estimated from the field measurements of soil water content and pressure head data using an inverse procedure with the water flow portion of the PASTIS model. The soil dispersivity was determined by fitting a convection-dispersion equation to resident bromide concentration profiles measured during a tracer study performed between October 2007 and June 2008 in the bare plots (Chalhoub et al., 2013). All heat flow parameters were taken from Findeling et al. (2003) and are presented in Table 2S of the supporting information. Nitrogen uptake by plants in the PASTIS model was simulated using a detailed crop growth routine derived from STICS 6.2 (Brisson et al., 2003). All maize- and wheat-related parameters were derived from the database of the STICS crop model (Brisson et al., 2003). The relevant parameters for our study are provided in Table 3S of the supporting information.
2.5.1. Sub-model CANTIS
The sub-model CANTIS (C and N Transformations in Soil) considers the decomposition of organic matter, mineralisation, immobilisation, nitrification and humification. Soil organic matter is divided into two living organic pools (zymogenous and autochthonous biomass) and three non-living organic pools (Fig. 1): fresh organic matter (FOM), humified organic matter (HOM) and soil soluble organic compounds (SOLSoil) (Garnier et al., 2003). The
zymogenous biomass (ZYB) decomposes fresh (FOM) and soil soluble (SOLSoil) organic
matter. The rates of N transformation, except nitrification, are driven by the rates of C transformation and the C/N ratio of all organic pools (Garnier et al., 2003). The decomposition of fresh, soluble and humified organic pools (FOM, SOLSoil and HOM) is
assumed to follow first-order kinetics:
. .ƒ ƒ . Τ . i w i i C K dt dC ƒ [1] B i m i B B K B ƒ [2]
where Ci is the C content of the organic pool i; Ki is the decomposition rate of that pool; ƒT,ƒw
and ƒB are the temperature, moisture and microbial limitation functions, respectively, as
described in Garnier et al. (2003), Bi is the C content in the ZYB or AUB microbial biomass; and Km is the contact factor connected to the size of the microbial biomass (Kmz for ZYB
biomass and Kma for AUB biomass were equal to zero as default values for optimal contact
between microbial biomass and organic matter).
Initially, CANTIS was built to describe the biotransformation processes of plant residues in soil. The FOM pool was composed of the four biochemical fractions obtained by the Van Soest analysis. We modified CANTIS to apply it for compost decomposition. Peltre et al. (2010) showed that during composting, the chemical composition of the Van Soest soluble fraction (SOL) changes with a decrease in biodegradable polysaccharides and an increase in N compounds, which leads to a less biodegradable fraction. Thus, the SOL fraction could not be treated as a single compartment of readily biodegradable organic matter in the composts and was divided into two compartments: "SOLF", consisting of soluble
compounds with a fast degradation rate, and "SOLS", consisting of soluble compounds with a
slow degradation rate. The “hemicellulose-like” and “cellulose-like” experimental compartments were merged into a single “hemicellulose + cellulose” (HCE+CEL)
compartment. The new representation of the compartments describing fresh organic matter (FOM) and N and C flows in the adapted CANTIS model is schematised in Fig. 1. Some of the biological transformation parameters were maintained from previous simulations (mainly from Garnier et al. 2003) and were supposed to have the same values for all treatments (Table 4).
2.5.2. Estimation of biological transformation parameters from incubation experiments using CANTIS
Unknown biological transformation parameters were obtained by fitting the sub-model CANTIS to the results of laboratory incubations. Three parameters describing the decomposition of humified organic matter, the decomposition rate of the autochthonous biomass (Ka), the decomposition rate of the humified organic matter (Kh), and the
humification coefficient of the degraded autochthonous biomass (Ha) were optimised using
the mineralisation kinetics of C and N from incubation of soils sampled from the ploughed layer of the different treatments. Then, the estimated input parameters of the control treatment were used to simulate the experimental incubations of the soil organic amendments. In this second step, optimisations were performed for (i) the proportion of C from added organic matter in the SOLF compartment, (ii) the decomposition rate of the SOLS fraction (K4) and
(iii) parameters related to the dynamics of the zymogenous biomass (ZYB) (the C assimilation yield of the soluble pool by ZYB, Ys; the decomposition rate of the ZYB, Kz; the humification
coefficient of the degraded ZYB, Hz; the C/N ratio of ZYB, C/Nzyb) because the behaviour of
ZYB may vary depending on the type of organic matter added (Recous et al., 1995).
First, the unknown parameters were estimated for each treatment, and then, the mean of each parameter was calculated to obtain the same set of input parameters for all treatments, except for the proportion of C in the SOLF compartment and the C/N ratio of ZYB that
differed for the MSW compost. The CANTIS sub-model was used with this unique set of averaged parameters (Table 4).
2.5.3. Modelling methodology using the PASTIS model
A schematic overview of our modelling methodology was given in Fig. 2.
First, the sub-model CANTIS (C-N module) was calibrated from incubations experiments described in sections 2.3, and 2.4 that provided the biological transformation parameters for soil organic matter and amendment decomposition (see section 2.5.2). The water transfer and solute transport parameters has been already described in details in Chalhoub et al. (2013) from field measurements in the bare plots.
Second, the N dynamic simulated by the PASTIS model in field condition was tested against experimental measurements of mineral N in bare and cropped soils (4 amended treatments and control), from September 2007 to September 2009 (section 2.2). In the control treatment with plants, the simulations with the PASTIS model were realised (1) considering the applied mineral N fertilisation to compare the simulated results with the observed crop growth and yield in the control treatment and (2) without considering the applied mineral N fertilisation during the maize growing season to compare the control and the amended treatments and to assess the effect of amendment application.
Third, extra-simulations were performed without the 6th amendment application of September 2007 in order to quantify the N fluxes related to the residual effect of the 5 previous applications (so-called “long-term” effect of compost application). These simulations were compared with simulations obtained with the 6th application of organic amendments to assess the N fluxes related to the last application (so-called “short-term” effect of compost application). The short and long term effects are discussed in section 3.3.
The flow domain geometry in the model was discretised into 6 layers corresponding to the different soil horizons. The upper boundary condition was set by the daily atmospheric conditions (rainfall and potential evapotranspiration), and the lower boundary condition was the free drainage. Potential evapotranspiration was calculated using the Penman equation (1948). The upper solute transport boundary condition was defined as a Cauchy boundary condition. The temperatures measured at depths of 0 and 160 cm were set as boundary conditions for the top and bottom, respectively, to simulate heat flux. The initial conditions for the organic pools and microbial biomass corresponded to the soil analysis performed before the last organic amendment applications in September 2007 (Table 3). The organic matter content below 30 cm was assumed to be equal to 0 because the organic C and N contents measured below that depth were negligible. The initial soil mineral N content was obtained from observations made on July 11th, 2007. The amount of mineral N in the organic amendment remaining after ammonia volatilisation, estimated using the proportion mentioned in section 2.1 was integrated to the initial soil mineral N contents in the different treatments.
2.5.4. Modelling Performance
Graphical comparisons and statistical criteria were used to evaluate the ability of the PASTIS model to simulate the measured data. The efficiency (Ef, Eq. 3) determined the relative magnitude of the residual variance of the model predictions compared to the variance of the measured data.
∑
∑
n 1 = i 2 i n 1 = i 2 ) -( ) -( -1 = m m m s Ef i i (3)where mi, si and m were the observed value of the variable at time i, the simulated value of
value of 1 would indicate a perfect fit, a negative efficiency that the mean value of the observed time series would have been a better predictor than the model.
3. Results and discussion
3.1. Characteristics of amendments and amended soils
3.1.1. Characteristics of the applied amendments in 2007
The four amendments applied in 2007 significantly differed in their organic C, organic and mineral N contents, C/N ratio and pH (Table 1). Compared to the previously applied amendments, the MSW compost had a lower dry matter content and a particularly large mineral N content; the C/N ratio was also higher (Table 4S of the supporting information). The BIO compost presented a larger content in organic and mineral N than previously. The C and N mineralisation during incubation in soil was used to assess the behaviour of the organic amendments immediately after their incorporation in the soil. The mineralised C corresponded to 56% of the added organic C for the MSW compost, while it fell between 10 and 16% for the other organic amendments (Table 1). The MSW compost was found to mineralise faster than the other organic amendments (p< 0.05) as was observed for the previous applications as well (Table 4S), meaning it was the least mature compost (no maturation period during the composting process vs. 8 and 12 weeks for the other composts), confirmed by the high C/N ratio and low pH (Francou et al., 2005; Said-Pullicino et al., 2007). Moreover, the MSW compost had the largest proportion of easily biodegradable cellulose and the lowest proportion of more recalcitrant lignin compared to the other products (Table 1), resulting in a high ratio of (CEL+HCE)/LIG proposed as indicator of unstabilised compost (3.7 for the MSW compost when it varied between 0.7 and 1.1 for the other organic amendments). The total organic C mineralised from the GWS, FYM and BIO amendments did not differ significantly (p>0.05). The mineralisation of compost and manure organic N
was assessed by subtracting the mineralised N measured during the incubation of control soil alone from mineral N measured during the incubation of soil-compost mixtures. The mineralisation of organic N was calculated on the basis of the extra-mineralisation of organic N compared to the control treatment with soil alone. It was slow and reached 3, 3 and 4% of the added organic N for the GWS, FYM and BIO amendments, respectively (Fig. 3a, d and c, respectively). A temporary net immobilisation of mineral N during the first 14 days of incubation was observed with the less mature MSW compost, which related with its high C/N ratio (23.9) and the high C/N ratio (53) of the cellulose-like fraction (Gabrielle et al., 2004). After 14 days of incubation, the net N mineralisation became positive again, and between day 14 and the end of incubation (91 days), corresponded to 26% of the added organic N for the MSW compost. Similar behaviours of organic C and N mineralisation have been observed with the previously applied amendments (Table 4S of the supporting information for C mineralisation, results not shown for N mineralisation).
3.1.2. Characteristics of soil organic matter related to the previous applications (1998-2006) of organic amendments
The five applications of organic amendments from 1998 to 2006 significantly increased (p< 0.05) the soil organic C (SOC), soil organic N (SON) and soil microbial biomass in the ploughed layer (Table 3). In the control treatment, the soil characteristics have not changed since the on setting of the experiment except for pH that tended to decrease. Compared to the control non-amended treatment, the SON increased by 9% for MSW, 18% for FYM and 27% for GWS and BIO. These variable increases were mostly attributed to the repeated incorporation of the organic amendments that brought between 1998 and 2006, 1236, 1511, 1728 and 2033 kg N ha-1 with 5 applications of MSW, BIO, FYM and GWS, respectively; the differences in incorporated crop residues related to enhanced crop yields in the organic
treatments could be neglected since it corresponded to less than 100 kg N ha-1 for the same period. A yield in SON was calculated for the organic amendments by dividing the increase in SON relative to control by the total N brought by the repeated amendments; it represented 79% for BIO, 58% for GWS, 46% for FYM and 32% for MSW. The bulk density in the plough layer was considered unchanged since the beginning of the field experiment.
The lowest increases of the SOC and SON contents were found in the treatment that received the most biodegradable organic amendment, i.e., the MSW compost, followed by the FYM amendment (Scherer et al., 2011; Peltre et al., 2012). However, the repeated addition of such biodegradable organic amendments enhanced the microbial biomass in soil more than the stabilised compost GWS. The microbial biomass increased by 14% for GWS, 18% for FYM, 19% for MSW and 25% for BIO compared to the control.
The potential C and N mineralisation was measured in soils of different treatments (Fig. 4 shows the N mineralisation). The C and N mineralisation significantly increased in the amended soils compared to the control treatment (p<0.05). In all treatments, the net N mineralisation (additional N mineralised compared to control soil without addition of organic amendment) at the end of the 91-day incubation period corresponded to 5 to 6% of SON that could be assimilated to the proportion of SON mineralised after one year in field conditions, calculated based on the hypothesis that 91 days at 28°C in laboratory conditions is equivalent to one year in outdoor conditions (Lashermes et al., 2009).
3.1.3. Parameters of the CANTIS model related to biological activity
The overall fit between the simulated and observed curves for N mineralisation in incubation experiments was good (Fig. 3 and 4). The modelling efficiencies were all higher than 0.75 (results not presented). The simulations based on one common set of parameters (each
parameter was calculated as the mean of the parameters estimated for each treatment) are presented in Fig. 4.
The estimated parameters related to the decomposition of humified organic matter (HOM) and added fresh organic matters (FOM) are presented in Table 4. The degradation rates of the autochthonous biomass (Ka = 0.02 d-1) and humified organic matter (Kh = 0.0006 d-1) were
consistent with the values previously proposed by Garnier et al. (2003) and Oorts et al., (2007). The biological transformation parameters related to the decomposition of added organic matter (FOM) were similar for all organic treatments except for the MSW compost. The easily decomposable soluble fraction SOLF contained the entire Van Soest soluble
fraction (100%) for the MSW compost, which was the most degradable. For the other organic amendments (BIO, GWS and FYM), the entire Van Soest soluble fraction was considered as SOLS that degraded slowly. For the BIO and GWS amendments, this could be related to their
higher stabilisation during composting. Indeed, the longer maturation period during composting led to the transfer of more resistant soluble compounds from the microbial products to the Van Soest soluble fraction (Francou et al., 2008; Peltre et al., 2010). The recalcitrance of the soluble fraction increased during composting and explained the large proportion of the slowly decomposable soluble fraction SOLS for the BIO and GWS
amendment. For the FYM amendment, the SOLF was also optimised at 0, meaning that the
entire Van Soest soluble fraction was considered as SOLS. The FYM was kept in piles for two
months in outdoor conditions before application, and the organic matter stabilised during this period as revealed by the low (CEL+HEM)/LIG ratio of 0.85 mentioned previously. The low estimated value of C/N for ZYB of the MSW treatment (5.6 for MSW versus 10.0 for the other treatments) indicated that the microbial biomass stimulated by the MSW addition required more N and would most likely be dominated by bacteria as the main decomposers of degradable soluble compounds, while fungi, characterised by a higher C/N ratio, were mainly
responsible for the decomposition of the larger lignin pools in the other amendments (Recous et al., 1995).
3.2. Nitrogen dynamics in bare and cropped soils: experimental results and modelling
The dynamics of mineral N was simulated with the PASTIS model and validated at field scale over the 2 years following the 2007 application (Sept. 2007 - Sept. 2009) by periodic soil sampling under bare or cropped conditions. Because the rate of application was based on the total organic C content in the organic amendments, the total N applied varied from 229 kg N ha-1 for the MSW compost to 418 kg N ha-1 for the GWS compost (Table 1). The applied doses of N were 1.3 to 2.5 larger than the maximum authorised dose of 170 kg ha-1.
The plant N uptakes simulated with the PASTIS model during two years increased from 396 to 514 kg N ha-1 (Table 5, Fig. 5) with the following order: CONTROL < MSW < FYM < BIO < GWS. From the experimental results, we found values of 418 to 506 kg N ha-1 (Table 2) increasing in the following order: CONTROL < BIO < MSW < GWS < FYM. Simulated plant N uptake fell within the experimental error for the measurements except for the BIO treatment (Fig. 5). The rate of decomposition of soil and amendment organic matter, estimated from the 91-d incubation experiment (Fig. 3c and 4c), might have over-estimated N mineralisation for the BIO treatment and explained the higher crop N uptake simulated by the model.
The mineral N evolution in soils was well simulated by the PASTIS model in the GSW, FYM, BIO and control treatments as shown by the high model efficiencies (Table 6) calculated for the bare and cropped soils. Examples for the GWS treatment under bare and cropped conditions are presented in Fig. 6 and 7, respectively. While plants affected the distribution of water and nitrate in soil, a preliminary comparison with data obtained in bare soils facilitated the evaluation of the N dynamic model. The model efficiencies were better in
bare soils than in cropped conditions for the topsoil layer (0-30 cm). The soil mineral N contents were always underestimated in the 30-60 cm layer (from December 2007 to March 2008 in Fig. 6 and 7), which could be explained by the fact that no organic matter was considered in this soil layer.
The evolution of mineral N content in the MSW bare treatment was not accurately simulated in our first simulation when using a contact factor Kmz equal to zero in the PASTIS model
(Eq. 1 and 2). The model underestimated the soil mineral N content in deep soil layers during the winter because of an overestimation of N immobilisation in the 0-30 cm soil layer during the initial stages of MSW decomposition. We assumed there was a N diffusion limitation due to the high heterogeneous distribution of the compost and its high C/N ratio. This assumption was accounted for by reducing the limitation function B through the adjustment of the
contact factor Kmz using equation 2 (Garnier et al., 2003). Increasing Kmz (Kmz = 600 and B =
0.09) improved the simulations. This adaptation of the model was also discussed by Oorts et al., (2007) and Garnier et al., (2008) to simulate the N limitation in conventional tillage.
3.3. Simulation of nitrogen balance in cropped soils
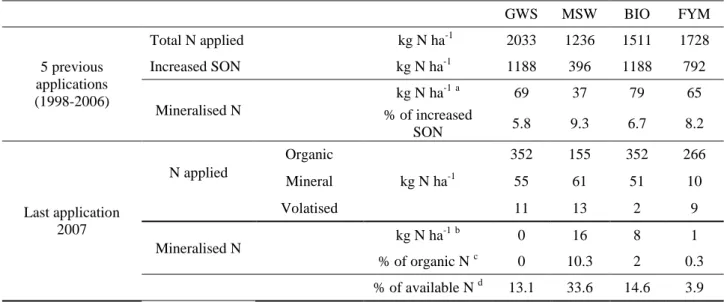
In this section, we only used the N mass balance calculated in cropped soils and not in the bare soils. The mineral N balance was calculated from September 2007 to September 2009 by taking into account the mineral N inputs (from applied mineral fertilisers, the mineral N contents of the amendments, N mineralised from the SON and the applied amendments) and the N outputs (crop uptake, leached mineral N and volatilised mineral N from the last application), as obtained by the PASTIS model for the various treatments, with and without the last amendment application in September 2007 on cropped soils (Table 5). The mineral N volatilised immediately after amendment application was calculated based on the proportions previously measured in field conditions (cf. Section 2.1) before simulation with the PASTIS
model. The effects of the previous and last applications on N mineralisation, N crop uptake and N leaching were calculated (Tables 7 and 8) using the data from Table 5. The effects of the organic treatments were assessed in reference to the control fertilised treatments. Although there were some differences in crop yields and biomass of residues within the different treatments compared to the control treatment, the impact of these differences on N dynamics in the soil-plant-water system was neglected.
3.3.1. Effects of previous and last applications on mineral N availability
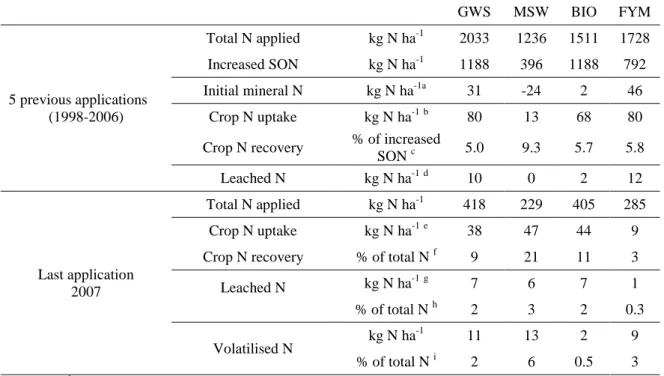
Without considering the last application of the amendments, the increase of mineralised N from the SON in the amended treatments compared to the control treatment varied from 37 to 79 kg N.ha-1 and represented from 6 to 9% of the increase in SON related to the 5 previous applications (Table 7). When considering the last application, the MSW compost presented the highest amount of mineralised organic N during the 2 years following its 2007 application, with 16 kg N.ha-1 corresponding to 10.3% of the applied organic N, while the net mineralised N from the less biodegradable amendments remained between 0 and 8 kg N.ha-1, corresponding to 0 to 2% of the total organic N applied. The proportions of mineralised organic N simulated in field conditions were much lower than during incubation in controlled conditions probably because amendment grinding enhanced the mineralisation.
3.3.2. Effects of previous and last applications on crop N uptake
The simulations of the crop N uptake with the PASTIS model (Table 8) showed that the previous amendment applications (1998-2006) increased the crop N uptake from 13 to 80 kg N. ha-1 compared to the control treatment with the following order: MSW < BIO < GWS = FYM. Taking into account both the differences in soil mineral N in the different treatments when starting the simulation and the leached N, the increased crop N uptake in the organic
treatments represented 5.0 to 9.3% of the increased SON after the 5 previous amendment applications with the lowest proportion found for the GWS compost. The last amendment application additionally increased the crop N uptake by 9 to 47 kg N.ha-1 with the order FYM < GWS < BIO < MSW, ranging from 3 to 21% of the N applied with the last application and with the largest proportion found for the MSW compost. These results were consistent with the 2–25% range of crop N recovery reported in previous studies (Sanchez et al., 1997; Amlinger et al., 2003; Scherer et al., 2011).
3.3.3. Effects of previous and last applications on N leaching
Without considering the last organic amendment application, the previous applications increased N losses through leaching up to 12 kg N ha-1 in comparison with the control treatment (Table 8), with the following order: MSW < BIO < GWS < FYM. The larger mineral N observed in the amended soils at the beginning of the simulated period explained the larger N leaching during the simulated period and represented less than 2% of the increased SON after the 5 previous amendment applications between 1998 and 2006. The increases in N losses through leaching compared to the control and related to the last application were low (1-7 kg N ha-1): lower for FYM (0.3% of total applied N) and higher for the other treatments, especially for MSW (3% of total applied N). This was mainly related to the high amount of mineral N in the MSW amendment and the faster mineralisation of organic N in this compost compared to the other organic amendments (Table 7). The N losses by leaching were in the lower range of previously synthesised data by Amlinger et al. (2003), who showed that N leaching was enhanced by 0 to 50 kg N ha-1 under compost application. These losses mainly occurred just after amendment application from September 2007 to April 2008, when the soil was kept bare before sowing maize. Sanchez et al. (1997) advised application of MSW compost only 3 months before sowing time for spring maize in May,
leading to a greater N availability during the time of largest N demand by crops. . The sowing of a catch crop after barley harvest would probably have decreased mineral N leaching during this period. Some N losses also occurred from October 2008 to April 2009 during the early stage of winter wheat, which used very little N during winter dormancy.
3.4. Relationship between organic matter stability in the applied amendments and N
dynamics in soils
The influence of the various organic amendments on N availability for crops varied with the characteristics of the organic matter in the amendments. The MSW compost, characterised by a fast degradability and a high mineral N content, rapidly delivered available mineral N during the 2 years after application, which was taken up by the crops (21% of total N from the last application recovered by crops). The MSW compost less contributed to the increase in SON than the other amendments and thus less to the mineral N provided to crops by SON mineralisation. In contrast, the repeated applications of the most stabilised composts (GWS and BIO) resulted in larger increases in the SON, thus increasing the available mineral N due to SON mineralisation (additional 69 and 79 kg N ha-1 in the BIO and GWS treatments, respectively, compared to the control; Table 7), but only 9-11% of the total N from the last application was used by the crops (Table 8). The behaviour of N applied with FYM was similar to the stabilised composts, with low recovery of N from the last application by the crops and large additional N mineralised from the SON compared to the control.
The available N from the last application also largely depended on the mineral N content of the amendments (Table 7), with the lowest value measured for the FYM treatment (3.9% of available N) and the highest value for the MSW treatment (33.6% of available N) with the highest content in mineral N (Table 1). Generally, the N in organic amendments is mainly found in organic forms, with less than 20% in mineral forms (Amlinger et al., 2003; Scherer
et al., 2011). However, the mineral N content of the MSW compost was much higher in 2007 (33% of total N) than observed for the previous years.
In the field experiment, the rates of compost application were calculated to bring equivalent amounts of organic C, thus brought contrasted doses of N (229 to 418 kg N ha-1). The simulated crop N uptakes from the 5 previous and last applications were calculated for rates of compost application equivalent to N input of 200 kg N ha-1 every other year (Fig. 8). The increase in total crop uptake during 2 years (maize-wheat rotation) compared to crops receiving mineral N fertiliser remained rather similar for all organic treatments (50 to 70 kg N ha-1) with very different dynamics of mineralisation for the MSW compost for which most N was provided by the last application (Fig. 8).
4. Conclusion
Regular compost applications to a cropped soil increased total SON with various efficiency depending on the stability of compost organic matter. The results of a long-term field experiment were used to calibrate and evaluate the PASTIS model to determine the effect of such regular compost applications on N dynamics in soil and N availability for crops and to compare them with regular farmyard manure application. All amendment degradability was well predicted with the PASTIS model by taking into account the biochemical fractions characterised by their own specific degradability and their N content. A unique set of biological transformation parameters was able to simulate the C and N dynamics after the incorporation of the different organic amendments into the soil. We found a good agreement between the model and the N content measured in soil and crops in field conditions. The adaptation of the model was necessary to take into account the initial transitory immobilisation of N for compost with a high C/N ratio such as the MSW compost. The repeated applications of organic amendments increased the total SON, N mineralisation, plant
uptake and leaching compared to the control treatment as higher doses of total N were applied with the organic amendments.
Our study shows that the organic matter stability in the organic amendments drove the dynamics of mineral N release for crops at the short term, directly through the N mineralisation of organic amendment with faster biodegradability (example of the MSW compost) or at the longer term through the mineralisation of enlarged stocks of soil organic N stocks by the repeated incorporations of more stabilised amendments, including FYM. For regular amendment applications equivalent to 200 kg N ha-1every other year, the increase in total crop N uptake compared to mineral N fertilizer during 2 years (maize-wheat rotation) could vary between 50 to 70 kg N ha-1 with very different dynamic of mineralisation for the less stabilised amendments for which most N would be provided by the last application while most crop N uptake would be related to the previous applications for more stabilised amendments. Mature composts behaved comparable to FYM, except that for FYM very little N from the last application was available.
Mineral N leaching was mainly related to the autumn mineralisation of enlarged soil organic N due to the repeated applications and to the mineral N applied with the last application and could be prevented by sowing intermediate crops. In the future, the PASTIS model could be used to improve the synchronisation of N release from composts with plant N demand, taking into account the physico-chemical characteristics of the added organic materials and climatic factors.
Acknowledgments: The Qualiagro field experiment is managed under a collaboration
between INRA and Veolia Environment, which financially supports the experiment. Most physico-chemical analysis of soils and composts were realized by the central laboratory of analysis of INRA (LAS, Arras, France). The authors are grateful to Jean-Noel Rampon,
Guillaume Bodineau and Vincent Mercier for their help in the field experiment and during the incubation experiments. The authors thank the reviewers for their detailed comments that were very helpful at improving the manuscript.
References
AFNOR, 2009a. Norme XP U 44-162. Amendements organiques et supports de culture - Fractionnement biochimique et estimation de la stabilité biologique - Méthode de caractérisation de la matière organique par solubilisations successives. AFNOR, Paris. AFNOR, 2009b. Norme XP U 44-163. Amendements organiques et supports de culture-
Caractérisation de la matière organique par la minéralisation potentielle du carbone et de l'azote. AFNOR, Paris.
Amlinger, F., Gotz, B., Dreher, P., Geszti, J., Weissteiner, C., 2003. Nitrogen in biowaste and yard waste compost: dynamics of mobilization and availability - a review. European Journal of Soil Biology 39, 107-116.
Annabi, M., Houot, S., Francou, C., Poitrenaud, M., Le Bissonnais, Y., 2007. Soil aggregate stability improvement with urban composts of different maturities. Soil Science Society of America Journal 71, 413-423.
Brisson, N., Gary, C., Justes, E., Roche, R., Mary, B., Ripoche, D., Zimmer, D., Sierra, J., Bertuzzi, P., Burger, P., Bussière, F., Cabidoche, Y.M., Cellier, P., Debaeke, P., Gaudillère, J.P., Hénault, C., Maraux, F., Seguin, B., Sinoquet, H., 2003. An overview of the crop model STICS. European Journal of Agronomy 18, 309-332.
Bruun, S., Hansen, T.L., Christensen, T.H., Magid, J., Jensen, L.S., 2006. Application of processed organic municipal solid waste on agricultural land - a scenario analysis. Environmantal Modeling and Assessment 11, 251-265.
Cabrera, M.L., Kissel, D.E., Vigil, M.F., 2005. Nitrogen mineralization from organic residues: research opportunities. Journal of Environmental Quality 34, 75-79.
Chalhoub, M., Coquet, Y., Vachier, P., 2013. Water and bromide dynamics in a soil amended with different urban composts. Vadose Zone Journal doi:10.2136/vzj2012.0056
Corbeels, M., Hofman, G., Van Cleemput, O., 1999. Siumlation of net immobilisation and mineralization in substrate-amended soils by the NCSOIL computer model. Biology and Fertility of Soils 28, 422-430.
Cooperband, L.R., Stone, A.G., Fryda, M.R., Ravet, J.L., 2003. Relating compost measures of stability and maturity to plant growth. Compost Science & Utilization 11, 113-124. Doublet, J., Francou, C., Poitrenaud, M., Houot, S., 2011. Influence of bulking agents on
organic matter evolution during sewage sludge composting; consequences on compost organic matter stability and N availability. Bioresource Technology 102, 1298-1307. Findeling, A., de Chanzy, A., Louvigny, N., 2003. Modeling heat and water flows through a
mulch allowing for radiative and long-distance convective exchanges in the mulch. Water Resources Research 39, 12-44.
Francou, C., Poitrenaud, M., Houot, S., 2005. Stabilization of organic matter during composting: influence of process and feedstocks. Compost Science and Utilization 13, 72-83.
Francou, C., Linères, M., Derenne, S., Le Villio-Poitrenaud M., Houot, S. 2008. Influence of green waste, biowaste and paper–cardboard initial ratios on organic matter transformations during composting. Bioresource Technology 99, 8926-8934.
Gabrielle, B., Da-Silveira, J., Houot, S., Francou, C., 2004. Simulating urban waste compost impact on C–N dynamics using a biochemical index. Journal of Environmental Quality 33, 2333-2342.
Garnier, P., Neel, C., Aita, C., Recous, S., Lafolie, F., Mary, B., 2003. Modelling carbon and nitrogen dynamics in a bare soil with and without straw incorporation. European Journal of Soil Science 54, 555-568.
Garnier, P., Cambier, C., Bousso, M., Masse, M., Chenu, C., Recous, S., 2008. Modeling the influence of soil-plant residue contact on carbon mineralization: Comparison of a
compartmental approachand a 3D spatial approach. Soil Biology and Biochemistry 40, 2754-2761.
Gerke, H.H., Arning, M., Stöpler-Zimmer, H., 1999. Modeling long-term compost application effects on nitrate leaching. Plant and Soil 213, 75-92.
Gutser, R., Ebertseder T., Weber A., Schraml M., Schmidhalter, U., 2005. Short-term and residual availability of nitrogen after long-term application of organic amendments on arable land. Journal of Plant Nutrition and Soil Science 168, 439-446.
Hartl, W., Erhart, E., 2005. Crop nitrogen recovery and soil nitrogen dynamics in a 10- year field experiment with biowaste compost. Journal of Plant Nutrition and Soil Science
168, 781-788.
Houot, S., Clergeot, D., Michelin, J., Francou, C., Bourgeois, S., Caria, G., Ciesielski, H., 2002. Agronomic value and environmental impacts of urban composts used in agriculture In: Insam, H.,Klammer, S. (Eds.), Microbiology of Composting. Springer - Verlag, Berlin Heidelberg, pp. 457 - 472.
Lashermes, G., Nicolardot, B., Parnaudeau, V., Thuries, L., Chaussod, R., Guillotin, M.L., Lineres, M., Mary, B., Metzger, L., Morvan, T., Tricaud, A., Villette, C., Houot, S., 2009. Indicator of potential residual carbon in soils after exogenous organicmatter application. European Journal of Soil Science 60, 297-310.
Mamo, M., Rosen, C.J., Halbach, T.R., 1999. Nitrogen availability and leaching from soil amended with municipal solid waste compost. Journal of Environmental Quality 28, 1074-1082.
Oorts, K., Garnier, P., Findeling, A., Mary, B., Richard, G., Nicolardot, B., 2007. Modeling soil carbon and nitrogen dynamics in no-till and conventional tillage using PASTIS model. Soil Science Society of America Journal 71, 336-346.
Peltre, C., Dignac, M.F., Derenne S., Houot, S., 2010. Change of the chemical composition and biodegradability of the Van Soest soluble fraction during composting: A study using a novel extraction method. Waste Management 30, 2448-2460.
Peltre, C., Christensen, B.T., Dragon, S., Icard, C., Kätterer, T., Houot, S., 2012. RothC simulation of soil carbon accumulation in four long-term field experiments with repeated applications of widely different organic amendments. Soil Biology and Biochemistry 52, 49-60.
Penman, H.L., 1948. Natural evaporation from open water, bare and grass. Proceedings of the Royal Society of London 193, 120-145.
Recous S., Robin, D., Darwis, D., Mary, B., 1995. Soil mineral N availability: effect on maize residue decomposition. Soil Biology and Biochemistry 27, 1529-1538.
Said-Pullicino, D., Erriquens, F.G., Gigliotti, G., 2007. Changes in the chemical characteristics of water-extractable organic matter during composting and their influence on compost stability and maturity. Bioresource Technology 98, 1822-1831. Sanchez, L., Diez, J.A., Polo, A., Roman, R., 1997. Effect of timing of application of
municipal solid waste compost on N availability for crops in central Spain. Biology and Fertility of Soils 25, 136-141.
Scherer, H.W., Metker, D.J., Welp, G., 2011. Effect of long-term organic amendments on chemical and microbial properties of a Luvisol. Plant Soil and Environment 57, 513-518.
Singh, U., Giller, K.E., Palm, C.A., Ladha J.K., Breman, H., 2001. Synchronizing N release from organic residues: Opportunities for integrated management of N. Scientific World Journal 1, 880-886.
Vance, E.D., Brookes, P.C., Jenkinson, D.S., 1987. An extraction method for measuring soil microbial biomass-C. Soil Biology and Biochemistry 19, 703-707.
van Genuchten, M.T., 1980. A closed-form equation for predicting the hydraulic conductivity of unsaturated soils. Soil Science Society of America Journal 44, 892-898.
Wolkowski, R. 2003. Nitrogen management considerations for landspreading municipal solid waste compost. Journal of Environmental Quality 32, 1844-1850.
Figure captions
Figure 1: Schematic of C and N flows in the CANTIS model adapted to organic waste
composts.
Figure 2: Schematic overview of the measurements and modelling
Figure 3: CANTIS-simulated (lines) and observed (symbols, ± standard deviation) data for N
mineralization kinetics during incubation of amendments in control soil with (GWS) green waste and sewage sludge compost (a), (MSW) municipal solid waste compost (b), (BIO) biowaste compost (c), (FYM) farmyard manure (d), (CONT) control soil (e).
Figure 4: CANTIS-simulated (lines) and observed (symbols, ± standard deviation) data for N
mineralization kinetics during incubation of soils that have received 5 successive applications of amendments from 1998 to 2006: (GWS soil) green waste and sewage sludge compost (a), (MSW soil) municipal solid waste compost (b), (BIO soil) biowaste compost (c), (FYM soil) farmyard manure (d) and (CONT soil) control soil (e) that did not receive amendment application.
Figure 5: Comparison between simulated and observed cumulated crop N uptake of maize
and wheat during the 2008-2009 period.
Figure 6: Simulated (lines) and observed (symbols, ± standard deviation) soil mineral N
content (N) in the different layers of the soil that received the green waste and sewage sludge compost (GWS) and was maintained bare from September 2007 to September 2009: (a) layer 0-30 cm, (b) layer 30-60 cm, (c) layer 60-90 cm, (d) layer 90-120 cm. Ef is the model efficiency coefficient.
Figure 7: Observed (symbols, ± standard deviation) and simulated (lines) soil mineral N
content in the treatment that received the green waste and sewage sludge compost (GWS), kept bare from September 2007 to April 2008 then cropped with maize (April-October 2008)
and then wheat (October 2008-August 2009) over the 2-year simulation period (September 2007- September 2009): (a) layer 0-30 cm, (b) layer 30-60 cm, (c) layer 60-90 cm. From September 2007 until April 2008, the data correspond to the bare plots.
Figure 8: Crop N uptake from 5 previous and one last applications of composts and manure.
The crop N uptakes were calculated based on results presented in Table 8 and normalised for rates of amendment applications equivalent to 200 kg N ha-1.
List of tables
Table 1: Physico-chemical and biochemical characteristics of organic amendments applied in
September 2007 (mean of 3 replicates); information on the composting processes.
Table 2: Amount and chemical composition of barley stubbles and maize residues (aerial
biomass) incorporated in soil (4 replicates). Crop dry matter yields and N uptake (grains + aerial residues) for maize and wheat. The standard error is reported in parentheses. Different letters between amendments for the same variable indicate significant differences at P<0.05.
Table 3: Main soil characteristics of the ploughed layer (0-30 cm) for the different treatments,
measured in 1998 before the first amendment application and before the last amendment application in September 2007 in the different treatments (mean of 4 replicates in the 4 blocks): Soil1998, before the first application in 1998, SoilControl, control treatment without
amendment application, SoilGWS, soil amended with the co-compost of sludge and green
waste, SoilBIO, soil amended with the biowaste compost, SoilMSW, soil amended with the
municipal solid waste compost, SoilFYM, soil amended with the farmyard manure.
Table 4: Values of the biological transformation parameters used in the CANTIS sub-model. Table 5: N balance simulated by PASTIS over 2 years without and with the 2007 amendment
applications. The soil was cropped with maize from April to October 2008 and wheat from October 2008 to August 2009. Crop N uptake of maize and wheat were added and total N losses by leaching were evaluated at 2 m depth over the 2 years.
Table 6: Model efficiency coefficients for soil mineral N content in the 0-30 cm, 30-60 cm
and 60-90 cm layers for bare and cropped soils.
Table 7: Simulated net N mineralisation in soil due to the previous applications (1998-2006)
mineral release was assessed in the presence of crops. The calculations were based on fluxes considered in N balance and presented in Table 5.
Table 8: Plant N uptake by maize and wheat and N losses (evaluated at 2 m depth) due to the
last (2007) and the previous (1998-2006) applications calculated by the model over 2 years (Sept. 2007 - Sept. 2009). During this period, the soil was cropped with maize from April to October 2008 and with wheat from October 2008 to August 2009. The calculations were based on fluxes considered in N balance and presented in Table 5.
Figure 1
SOLSoil
Autochthonous biomass
(AUB)
Humified organic matter
(HOM) CO2 CO2 CO2 NH4 NH4 NO3 NH4 CO2 NH4 K1 K2 K3 Kh K4 Ks Ys Ha Kz Ya Ka Yz Yh HCE+CEL LIG SOLF
Fresh organic matter (FOM)
SOLS
Zymogenous biomass
(ZYB)
Table 1:
GWS MSW BIO FYM
Amount applied, Mg dw ha-1 a 16.6 (2.9) 10.5 (2.3) 16.2 (5.1) 13.3 (2.8) Dry matter, g kg-1 fw 592.0 (7.1) 454.6 (1.9) 648.5 (8.4) 356.4 (14.5) OC, g kg-1dw 238.3 (3.8)a* 359.3 (6.4)c 228.7 (5.0)a 274.7 (4.2)b ON, g kg-1dw 21.3 (0.5)bc 14.7 (0.7)a 21.7 (0.2)c 20.0 (0.7)b C/N 11.2 (0.4)a 24.5 (1.4)c 10.5 (0.3)a 13.8 (0.3)b Mineral Nb, g kg-1dw 4.0 (0.2)c 7.0 (0.1)d 3.3 (0.1)b 1.4 (0.0)a Estimated volatilized N c, g kg-1dw 0.7 1.2 0.1 0.7 pH (in H2O) 7.4 (0.0)ab 7.0 (0.4)a 7.6 (0.0)b 9.3 (0.0)c
Potentially Mineralized Carbond % Corg 16 56 10 15
Soluble fraction % Corg 55 35 46 63
C/N 7 13 7 11
Hemicellulose –like fraction % Corg 4 7 8 0
C/N 17 10 8 0
Cellulose –like fraction %Corg 20 45 15 17
C/N 28 53 17 48
Lignin–like fraction %Corg 21 14 31 20
C/N 18 27 18 14
Composting process
Fermentation phase, days 42 30 35
Maturation phase, days 90 0 60
a
fw, fresh weight; dw, dry weight; OC, organic carbon content; ON, organic nitrogen content ; C/N, organic C to organic N ratio
* Different letters between amendments for the same variable indicate significant differences at 5 %
b Mineral N was mainly N-NH
4 in amendments c N-NH
4 losses through ammonia (NH3) volatilization within the first 24h after amendment application. The
volatilized N was measured in the field experiment,
d The excess mineralized carbon after 91 days in the soil-organic amendment mixtures was expressed as a
percentage of the amendment organic C applied during incubation (after subtracting mineralized C of the control treatment)
Table 2:
Control GWS MSW BIO FYM
Incorporated crop residues Barley stubbles, September 2007
Biomass, t dw ha-1 1.0 (0.1)a 1.5 (0.3)a 1.2 (0.2)a 1.4 (0.1)a 1.2 (0.2)a
OC, g kg-1dw 450 460 454 453 452
ON, g kg-1dw 4 8 5 5 5
Corn Maize, October 2008
Plant residues, t dw ha-1 10.0 (0.7)ab 11.3 (1.0)b 9.9 (0.5)a 11.0 (0.6)ab 11.1 (0.4)ab
OC, g kg-1dw 462 461 462 457 459
ON, g kg-1dw 7.4 8.7 7.3 8.1 8.8
Crop yields
Corn Maize , October 2008
Grain yield, t dw ha-1 8.3 (0.4)a 8.9 (0.5)a 8.7 (0.4)a 8.9 (0.6)a 9.2 (0.4)a N uptake, kg ha-1 204 (14)a 223 (19)ab 211 (12)a 216 (8)ab 234 (7)b
Wheat, July 2009
Grain yield, t dw ha-1 8.1 (0.1)a 9.0 (0.3)b 8.8 (0.3)b 8.6 (0.4)ab 8.9 (0.5)b N uptake, kg ha-1 214 (6)a 276 (7)b 269 (18)b 249 (18)b 272 (18)b Maize and Wheat N
uptake, kg ha-1
Table 3:
Soil1998b Soil Control Soil GWS Soil MSW Soil BIO Soil FYM
SOCa, g kg-1 10.6 (0.2) 10.5 (0.3)a* 14.0 (0.4)c 12.0 (0.2)b 14.3 (1.4)c 13.8 (0.9)bc SONa, g kg-1 1.1 (0.0) 1.1 (0.0)a 1.4 (0.1)c 1.2 (0.0)b 1.4 (0.1)c 1.3 (0.1)bc C/Na 9.5 (0.1) 9.9 (0.4)a 10.0 (0.2)a 9.9 (0.2)a 10.5 (0.3)a 10.4 (0.3)a pH, H2O 7.1 (0.1) 6.8 (0.1) 6.9 (0.1) 7.4 (0.1) 7.7 (0.1) 7.2 (0.1)
Microbial biomass, mg C kg-1 - 244 (17)a 278 (8)b 291 (9)b 304 (16)b 287 (11)b * Different letters between treatments in 2007 for the same variable indicate significant differences at 5 %
a SOC, soil organic carbon; SON, soil organic nitrogen ; C/N, organic C to organic N ratio b