HAL Id: hal-02989847
https://hal.archives-ouvertes.fr/hal-02989847
Submitted on 5 Nov 2020
HAL is a multi-disciplinary open access
archive for the deposit and dissemination of
sci-entific research documents, whether they are
pub-lished or not. The documents may come from
teaching and research institutions in France or
abroad, or from public or private research centers.
L’archive ouverte pluridisciplinaire HAL, est
destinée au dépôt et à la diffusion de documents
scientifiques de niveau recherche, publiés ou non,
émanant des établissements d’enseignement et de
recherche français ou étrangers, des laboratoires
publics ou privés.
on the contribution to nebular He ii emission
Peter Senchyna, Daniel Stark, Jordan Mirocha, Amy Reines, Stephane
Charlot, Tucker Jones, John Mulchaey
To cite this version:
Peter Senchyna, Daniel Stark, Jordan Mirocha, Amy Reines, Stephane Charlot, et al.. High-mass
X-ray binaries in nearby metal-poor galaxies: on the contribution to nebular He ii emission. Monthly
Notices of the Royal Astronomical Society, Oxford University Press (OUP): Policy P - Oxford Open
Option A, 2020, 494 (1), pp.941-957. �10.1093/mnras/staa586�. �hal-02989847�
High-mass X-ray binaries in nearby metal-poor galaxies:
on the contribution to nebular He
ii emission
Peter Senchyna
1?
, Daniel P. Stark
1
, Jordan Mirocha
2,3
, Amy E. Reines
4
,
St´ephane Charlot
5
, Tucker Jones
6,7
, and John S. Mulchaey
8
1Steward Observatory, University of Arizona, 933 N Cherry Ave, Tucson, AZ 85721 USA
2Department of Physics and McGill Space Institute, McGill University, 3550 rue University, Montreal, QC, H3A 2T8, Canada 3CITA National Fellow
4eXtreme Gravity Institute, Department of Physics, Montana State University, Bozeman, MT 59717, USA 5Sorbonne Universit´e, CNRS, UMR7095, Institut d’Astrophysique de Paris, F-75014, Paris, France 6Department of Physics, University of California Davis, 1 Shields Avenue, Davis, CA 95616, USA 7Institute of Astronomy, University of Hawaii, 2680 Woodlawn Drive, Honolulu, HI 96822, USA
8Observatories of the Carnegie Institution of Washington, 813 Santa Barbara Street, Pasadena, CA 91101, USA
Accepted XXX. Received YYY; in original form ZZZ
ABSTRACT
Despite significant progress both observationally and theoretically, the origin of high-ionization nebular He ii emission in galaxies dominated by stellar photohigh-ionization re-mains unclear. Accretion-powered radiation from high-mass X-ray binaries (HMXBs) is still one of the leading proposed explanations for the missing He+-ionizing photons, but this scenario has yet to be conclusively tested. In this paper, we present nebular line predictions from a grid of photoionization models with input SEDs containing the joint contribution of both stellar atmospheres and a multi-color disk model for HMXBs. This grid demonstrates that HMXBs are inefficient producers of the photons necessary to power He ii, and can only boost this line substantially in galaxies with HMXB populations large enough to power X-ray luminosities of 1042 erg/s per unit star formation rate (SFR). To test this, we assemble a sample of eleven low-redshift star-forming galaxies with high-quality constraints on both X-ray emission from Chan-dra and He ii emission from deep optical spectra, including new observations with the MMT. These data reveal that the HMXB populations of these nearby systems are in-sufficient to account for the observed He ii strengths, with typical X-ray luminosities or upper limits thereon of only 1040–1041erg/s per SFR. This indicates that HMXBs are not the dominant source of He+ ionization in these metal-poor star-forming galaxies. We suggest that the solution may instead reside in revisions to stellar wind predictions, softer X-ray sources, or very hot products of binary evolution at low metallicity. Key words: X-rays: galaxies – X-rays: binaries – galaxies: stellar content
1 INTRODUCTION
As the nearest collections of young and very metal-poor stars in the universe, local star-forming dwarf galaxies represent a crucial testbed for models of stellar populations at low metallicity. Nebular emission lines from highly-ionized gas provide a window onto the shape of the ionizing spectra of these systems in the extreme ultraviolet (EUV, 10–100 eV). The EUV potentially contains contributions from both the
? E-mail: senchp@email.arizona.edu
hottest stars and emission from gas heated by compact ob-ject accretion and shocks, all of which are highly uncertain at very low-metallicity. The promise of obtaining quantita-tive constraints on these processes with deep spectroscopy is alluring, but physically interpreting this nebular emission has proved challenging.
In particular, the presence of nebular Heii emission in nearby star-forming regions remains a puzzle three decades after it was first noted (Garnett et al. 1991, and references therein). The difficulty in understanding this emission is rooted in the very high energy of the photons necessary
to doubly-ionize helium (> 54.4 eV, or > 4 Ryd) and thus power the recombination spectrum of Heii; most notably, Heiiλ4686 ˚A andλ1640 ˚A. Theoretical stellar atmosphere models generally predict very little emergent flux beyond 54.4 eV, as He+ionization in the atmosphere and expanding winds of massive stars introduces a strong absorption edge at this energy (e.g.Gabler et al. 1989;Pauldrach et al. 2001;
Lanz & Hubeny 2003;Puls et al. 2005). In order to account for this apparent excess in flux at the He+-ionizing edge rel-ative to the stellar models, Garnett et al.(1991) proposed two alternative non-stellar sources of ionizing radiation: ra-diative shocks and X-ray binaries.
Massive progress has since been made in expanding the sample of nebular Heii detections both in the local Universe (e.g. Thuan & Izotov 2005; Kehrig et al. 2011;
Shirazi & Brinchmann 2012; Kehrig et al. 2015;Senchyna et al. 2017; Kehrig et al. 2018; Berg et al. 2019b) and at z ∼ 1–4 (e.g. Erb et al. 2010; Cassata et al. 2013; Berg et al. 2018;Nanayakkara et al. 2019). This body of observa-tional evidence has made clear that nebular Heii is strongly metallicity-dependent, and is likely ubiquitous among star-forming systems at metallicities 12+ log O/H < 7.7 (equiv-alently, Z/Z < 0.1; e.g.Senchyna & Stark 2019;Senchyna
et al. 2019). Yet despite commensurate advances in stel-lar modeling, including state-of-the-art treatments of atmo-spheres, binarity, and rotation (e.g.Sz´ecsi et al. 2015;G¨ ot-berg et al. 2017; Eldridge et al. 2017; G¨otberg et al. 2018;
Stanway & Eldridge 2019;Kub´atov´a et al. 2019), there is as-yet no clear solution to the apparent modeling deficit of hard ionizing photons.
In recent years, the Chandra X-ray Observatory has rev-olutionized our understanding of X-ray binaries, enabling a reappraisal of their possible role in providing the miss-ing ionizmiss-ing photons. High-mass X-ray binaries (HMXBs), which power hard X-ray emission via accretion from a mas-sive stellar companion onto a compact object (black hole or neutron star), have been shown to power nebular Heii in cases where they act as the sole ionizing source in a neb-ula (Pakull & Angebault 1986;Kaaret et al. 2004b;Guti´ er-rez & Moon 2014). While it has long been established that HMXBs dominate the hard X-ray flux (& 1 keV) of actively star-forming galaxies in the local Universe (e.g.Grimm et al. 2003;Mineo et al. 2012), early studies largely ignored very low-metallicity galaxies due to their faintness. Now, strong evidence has arisen that the X-ray luminosity per unit of star formation rate increases by nearly an order of magnitude in extremely metal-poor galaxies (Z/Z . 0.1) relative to those
at near-solar metallicity (Mapelli et al. 2010;Prestwich et al. 2013;Basu-Zych et al. 2013;Brorby et al. 2014;Douna et al. 2015;Brorby et al. 2016;Brorby & Kaaret 2017). Theoret-ical models reproduce this general trend, suggesting that it is likely driven by the weaker stellar winds driven at low metallicity (e.g.Dray 2006;Linden et al. 2010;Fragos et al. 2013a). In particular, weaker winds lead to both more mas-sive black holes and a higher incidence of HMXB systems undergoing Roche lobe overflow accretion, which both tend to produce more luminous X-ray binary populations.
The similarity of the metallicity dependence of HMXBs to that of nebular Heii motivatedSchaerer et al.(2019) to revisit the possibility that HMXBs may be solely responsi-ble for this emission line in metal-poor star-forming galax-ies. By assuming that the nebular Heii in IZw18 NW is
en-tirely powered by the X-ray source observed in that cluster (c.f. Lebouteiller et al. 2017), Schaerer et al.(2019) derive a scaling relationship between Heii flux and hard X-ray lu-minosity. Applying this to the population synthesis models ofFragos et al.(2013a,b), the authors demonstrate that the metallicity-dependent HMXB population produces a trend in the strength of Heii relative to Hβ similar to that ob-served. Though suggestive, the model presented bySchaerer et al.(2019) has yet to clear two critical hurdles. First, it has yet to be demonstrated through full photoionization model-ing that an HMXB spectrum can successfully power nebu-lar Heii when combined with stellar ionizing flux. Second, a detailed galaxy-by-galaxy investigation of both Heii and X-ray constraints has not yet been conducted for more than a handful of systems (e.g.Thuan & Izotov 2005;Kehrig et al. 2018).
In this paper, we will test the hypothesis that HMXBs dominate the production of Heii in star-forming galaxies from both a theoretical and observational perspective. First, we produce a grid of photoionization models with input SEDs reflecting the joint impact of young stellar populations and a variable HMXB contribution, and examine the impact of the latter on the predicted nebular line spectrum (Sec-tion2). Then, leveraging recent work targeting metal-poor galaxies with both Chandra and high-resolution optical spec-troscopy including data from Keck and new measurements from the MMT 6.5m telescope, we assemble a sample of eleven star-forming regions with robust constraints on both X-ray emission and nebular Heii in Section3. In Section4
we examine these observational constraints in the context of the photoionization model results, providing a stringent empirical test of the claim that HXMBs dominate produc-tion of He+-ionizing photons in these systems. We conclude in Section5.
2 MODELING GAS PHOTOIONIZED BY
STARS AND HMXBS
In order to investigate the possibility that Heii or other high-ionization emission lines are powered by high-mass X-ray binaries, we construct a semi-empirical framework to model this scenario explicitly. This requires us first to construct a model SED representing the combined ionizing spectrum of both massive stars and the emission from HMXB accre-tion disks. Then, we use a photoionizaaccre-tion modeling frame-work to simulate the reprocessing of this ionizing spectrum through surrounding gas, producing predictions about the resultant nebular emission. We describe these two steps be-low in Section2.1, then discuss the results and predictions of this modeling in Section2.2.
2.1 Methodology
Our primary goal in this section is to assess the magnitude of the effect on nebular emission lines introduced by adding a HMXB spectrum to a stellar population model. While there are many existing prescriptions for full galaxy SED modeling in the literature (see e.g.Charlot & Longhetti 2001;Gutkin et al. 2016; Chevallard & Charlot 2016; Leja et al. 2017;
Byler et al. 2017;Fioc & Rocca-Volmerange 2019), none yet account explicitly for the impact of HMXBs on nebular gas
emission. We describe out methodology in this subsection with comparison to other approaches in the literature where relevant.
2.1.1 Construction of the Spectral Energy Distribution First, we describe how we construct the joint SED represent-ing the ionizrepresent-ing flux emitted by massive stars and HMXBs. Since strong interstellar absorption precludes the direct ob-servation of the EUV spectrum of massive stars or HMXBs, we must rely on models calibrated at higher or lower energies to predict the SED in this energy regime.
There are a variety of stellar population synthesis frameworks in the literature designed to predict the emer-gent flux from stars themselves (for a review, see Conroy 2013). As we will discuss further later in the paper, the shape of model stellar spectra in the EUV beyond the Ly-man limit is highly uncertain, as these photons cannot be directly observed for any individual hot OB stars. In partic-ular, the emergent flux from stars at and just beyond the He+-ionizing edge (54.4 eV, or 228 ˚A) is subject to sub-stantial systematic uncertainties from both atmosphere and evolutionary models, and varies significantly between differ-ent population synthesis prescriptions. For instance, mass transfer can strip the donor star of its outer hydrogen lay-ers, and potentially spin-up the acceptor star sufficiently to change its evolution, both of which can enhance the escape rate for He+-ionizing photons which are easily blocked by the outer layers or dense winds of ‘typical’ massive stars (e.g.Eldridge & Stanway 2012;Sz´ecsi et al. 2015;G¨otberg et al. 2018;Stanway & Eldridge 2019;G¨otberg et al. 2019). Accounting for high ZAMS rotation rates can also boost stel-lar flux in the EUV (e.g.Maeder & Meynet 2000;V´azquez et al. 2007;Levesque et al. 2012;Byler et al. 2017). Signifi-cant uncertainties remain in the specific treatment of all of these factors, and they have not yet been considered simul-taneously in a full population synthesis prescription.
For the purposes of this paper, we are primarily inter-ested in constraining the potential impact of HMXBs on nebular emission when added to a stellar population. Thus, we focus solely on the latest version of the BPASS models accounting for binary evolutionary effects (2.2, described in
Stanway & Eldridge 2018). These models incorporate pre-scriptions for some binary mass transfer processes which can have a substantial impact on emergent hard ionizing flux. It is important to note that modifications to our treatment of the stellar population that tend to increase the stellar contribution to flux at the He+-ionizing edge will decrease the relative impact of the HMXB spectrum. The BPASS flux predictions in the EUV are fairly representative of the state-of-the-art population synthesis codes, and in partic-ular are lower than the newest results from the modified
Bruzual & Charlot (2003) models (Charlot & Bruzual, in-prep.) incorporating newer theoretical stellar atmospheres for massive main-sequence and Wolf-Rayet stars (see Stan-way & Eldridge 2019;Plat et al. 2019).
The ionizing flux of of a purely-stellar SED depends strongly on the assumed IMF, star formation history, and stellar metallicity. Since we are interested primarily in the HMXB contribution, we will make reasonable assump-tions about the IMF and star formation history while leaving metallicity as a free parameter. We assume the
fiducial BPASS IMF, which consists of a broken power-law with a Salpeter (1955) slope (−2.35) over the mass range 0.5–300 M . Extreme IMFs can enhance the He+
-ionizing flux achieved, though not sufficiently to alone ex-plain the strongest Heii emission observed (Stanway & El-dridge 2019). We assume a constant star formation history that has proceeded for sufficiently long for the SED to sta-bilize (100 Myr), noting that instead adopting younger ages or adding young bursts will act to enhance the relative flux beyond 54.4 eV per unit SFR by increasing the number of early O and Wolf-Rayet stars (e.g.Shirazi & Brinchmann 2012;Chisholm et al. 2019). Adopting a more extreme IMF or a star formation history weighted to younger ages would both increase the amount of hard ionizing flux from the stel-lar population at fixed SFR and reduce the relative impact of the HMXB spectrum on nebular line emission. Our rela-tively conservative assumptions about the stellar population synthesis prescription, IMF, and star formation history are chosen to provide a reasonable first estimate of the effect on nebular lines of adding HMXBs to a stellar ionizing spec-trum.
With the stellar model prescription, IMF, and star for-mation history fixed, the most important variable affecting the ionizing flux of the stars themselves is then the stellar metallicity. As the bulk metallicity of a stellar population is lowered, reduced opacities in the stellar interior and atmo-sphere lead to both hotter temperature evolution for mas-sive main-sequence stars and dramatically weakened stellar winds. These factors both directly lead to harder ionizing spectra for individual metal-poor stars, and the reduced im-pact of stellar wind mass loss at low metallicity can result in rotational and binary evolutionary effects playing a more prominent role in producing very hot stars. Models of these evolutionary stages are still highly uncertain and are not uniformly included in population synthesis predictions (e.g.
Sz´ecsi et al. 2015;Stanway et al. 2016;G¨otberg et al. 2019, and references therein). We allow the stellar metallicity to vary from Z= 0.020 (solar, Z ) to Z= 0.001 (Z/Z = 5%),
the lowest metallicity provided by the BPASSv2.2 grids. We note that adopting lower stellar metallicities would harden the stellar spectrum and further increase the maximal neb-ular Heii flux powered by the stars alone. However, this metallicity range encompasses the full range of gas-phase oxygen abundances in our observational sample (assuming solar α/Fe; Table 1); and as already discussed, such lower metallicities would further diminish the relative impact of HMXBs to Heii.
In contrast to the stellar ionizing spectrum which drops-off at energies above 54.4 eV due to absorption in stellar winds, the spectra of high-mass X-ray binaries are domi-nated by extremely hot accretion disks and peak at hard X-ray energies in the 1–10 keV range (Figure1). Their spectra can be approximated with a multi-color disk (MCD) model (Mitsuda et al. 1984), which produces a modified blackbody spectrum representing gas at a range of temperatures in the accretion disk. This model is parameterized by the mass of the accreting black hole MBH and the maximum radius of the disk Rmax (in this work, we compute this spectrum
using code from theARES package1; Mirocha 2014). For
black hole masses in the range of 10–100 M and radii of
103–105 cm, 54.4 eV remains solidly in the Rayleigh-Jeans tail of this spectrum, with flux far lower than at the SED peak in the keV range. Over this range, the black hole mass has the largest impact on flux at 54.4 eV for a fixed total luminosity, with more massive black holes yielding a softer spectrum and more flux at 54.4 eV. Increasing Rmax from
103 to 104 cm increases the flux at 54.4 eV by . 25% for black hole masses in this range, and essentially no change is seen when Rmaxis increased further to 105cm. Accordingly,
we fix Rmax= 104cm for our grid. HMXBs are known to
un-dergo spectral transitions, though generally their spectrum is found to harden relative to an MCD spectrum likely due to Compton up-scattering during a super-Eddington accretion event (e.g. Kaaret & Feng 2013; Brorby et al. 2015), de-creasing the flux at low ( 1 keV) energies. A more sophis-ticated model including Comptonization would thus cause the HMXB spectrum to be less efficient at producing pho-tons at the He+-ionizing edge. For simplicity in this analysis, we adopt a single MCD model to represent the HMXB con-tribution to the total SED. While in massive galaxies we expect the X-ray spectrum to be a composite of several ac-tive HMXBs, the total unresolved X-ray luminosity of most nearby dwarf galaxies studied inBrorby et al. (2014,2016, 1038–1040 erg/s) is actually suggestive of the luminosity of individual HMXBs resolved in larger spiral galaxies (e.g. Mi-neo et al. 2012), so this assumption may actually be more appropriate for the study of Heii in the lowest-metallicity, lowest-mass galaxies found locally.
We are interested in the impact of explicitly varying the HMXB contribution on high-ionization nebular emission. Thus, we incorporate as an additional parameter the X-ray luminosity measured in a broad Chandra band (erg/s) pro-duced per unit of star formation (M /yr), hereafter referred
to as the X-ray production efficiency: LX,0.5−8 keV/SFR. Pre-vious observations with Chandra provide guidance as to the range of values of this parameter attained in local galaxies. For the purposes of this study, we allow this quantity to vary over a broad range bracketing the values typically measured in nearby dwarf galaxies (e.g.Brorby et al. 2016) by several orders of magnitude: 1040–1044erg/s/(M /yr).
Figure1compares these two SED components for a rep-resentative model in our grid. We plot here a BPASS model computed with the above assumptions (constant star for-mation history at 1 M /yr and fiducial IMF) at Z = 0.004
(Z/Z = 0.2). Next to this, we plot an MCD spectrum
as-suming Rmax = 104 cm for MBH = 10–100 M , in each case
normalized in the 0.5–8 keV band to the median X-ray pro-duction efficiency in our grid: 1042erg/s/(M /yr). This
par-ticular X-ray production efficiency is chosen such that the HMXB spectrum begins to impact significantly on the total EUV flux. At this X-ray luminosity per unit of star for-mation, the Rayleigh-Jeans tail of the MCD spectrum ap-proaches the stellar contribution to the SED at the He+ -ionizing edge as the black hole mass is increased.
2.1.2 Photoionization Modeling
Accurately predicting the nebular emission powered by HMXBs requires photoionization modeling, taking into ac-count the joint effects of both HMXBs and stars in heating and ionizing their surrounding gas. We use the codecloudy
10
010
110
210
310
4E/eV
10
3510
3610
3710
3810
3910
4010
41F
λerg
/s
/˚A
BPASS2.2 MBH/M = 10 MBH/M = 50 MBH/M = 100Figure 1. Representative SEDs for a model stellar population (BPASS v2.2, constant star formation at 1M /yr, Z= 0.004) and a model HMXB (multi-color disk spectrum, Rmax= 104cm, with MBH/M = 10–100). The HXMB spectrum is normalized in the 0.5–8 keV range (shaded grey) to the median X-ray production ef-ficiency adopted in our grid: LX,0.5−8 keV/SFR= 1042erg/s/(M /yr). At this X-ray normalization, the Rayleigh-Jeans tail of the HMXB spectrum is within an order of magnitude of the stellar SED at the He+-ionizing edge (black dashed line).
(version 17.1, detailed in Ferland et al. 2017) to perform this part of the analysis. This photoionization code natively handles the processing of X-rays by nebular gas, including accounting for secondary ionizations. Following the stan-dard methodology for modeling integrated light from star-forming galaxies (e.g.Byler et al. 2017), we assume a closed radiation-bounded spherical geometry consisting of a shell of material located sufficiently far from the central source (1019 cm) to be essentially plane-parallel. We allow the computa-tion to iterate to convergence up to 5 times (typically only 3 are required), and stop the calculation once the temperature drops below 100 K or the edge of the hydrogen ionization front is reached (beyond either of which nebular line emis-sion will be minimal). We run thecloudy models with a separate high-resolution input file for each SED, and mea-sure the strength of the emission lines we are interested in directly from the saved output. To organize and analyze the grid, we utilize a modified version of the grid construction tools developed as part of cloudyfsps (Byler 2018). Our approach is appropriate for our model of radiation-bounded Hii regions surrounding recently-formed young stellar pop-ulations, but modeling more massive galaxies with several dominant generations of stars generally benefits from more complex approaches (e.g.Charlot & Longhetti 2001). Con-sidering density-bounded model conditions is also beyond the scope of this paper, butPlat et al.(2019) demonstrate that the suppression of lower-ionization emission that these conditions introduce is generally inconsistent with the neb-ular properties of a broader sample of local Heii-emitters.
There are several other important variables describing the gas to consider in this modeling scheme. We fix the gas density to nH= 102 cm−2 to approximate the typical values
measured from [Sii] in nearby star-forming galaxies, includ-ing those which power strong high-ionization line emission (e.g. Brinchmann et al. 2008; Senchyna et al. 2017; Berg et al. 2019a). While typical Hii region densities may be somewhat higher in galaxies in the early universe (e.g. Shi-razi et al. 2014;Sanders et al. 2016), this is unlikely to sig-nificantly affect recombination lines such as Heii (e.g.Plat et al. 2019). Since in this work we focus on metal-poor star-forming dwarf galaxies with low dust extinction measure-ments, we do not consider the effects of extinction or de-pletion onto dust in this analysis (though these effects are very important for general galaxy modeling; see e.g.Gutkin et al. 2016). The attenuation introduced by dust extinction is minimal for X-ray photons (dominated by small-angle for-ward scattering;Draine 2011) and we only consider observed optical line ratios after correction for extinction according to the Balmer decrement (Section3).
Next, we must consider the gas-phase metallicity and chemical abundance patterns, which directly impact upon both metal line strengths and thereby the gas cooling effi-ciency and thus temperature. We fix the gas abundance pat-terns to those adopted byDopita et al.(2000), which is based upon the solar abundances found by Anders & Grevesse
(1989) with an additional empirically-motivated scaling of N/O with O/H imposed to account for the secondary pro-duction of nitrogen. In this first analysis, we scale the gas-phase metal abundances directly with the metallicity Z of the stellar population, while noting that allowing for an off-set in this ratio could enhance the contribution of stellar ionizing flux to the production of high-ionization metal lines (e.g.Steidel et al. 2016;Senchyna et al. 2019).
Finally, we also allow the gas ionization parameter U to vary. This dimensionless quantity parametrizes the relative density of hydrogen-ionizing photons to the gas density:
U= QH
4πR2nHc
, (1)
where QHis the total number of hydrogen-ionizing photons emitted by the source spectrum per second, c is the speed of light, and R is the radius of the ionized region. In this effectively plane-parallel case, the Str¨omgren sphere radius is approximately equal to the inner radius of the shell, and their distinction is unimportant (e.g. Charlot & Longhetti 2001;Byler et al. 2017). Nebular line ratios are typically in-sensitive to changes in R and QH that preserve log U (e.g.
Evans & Dopita 1985;McCall et al. 1985). Since we fix the radius, specifying the ionization parameter implicitly nor-malizes the input spectrum. We allow this parameter to vary between −3 < log U < −1, which spans the range typically observed in galaxies dominated by recent star formation.
2.2 Modeling Results and Predictions
The framework described above results in a model for a composite stellar and HMXB spectrum with four free pa-rameters. These are metallicity Z (of both the stars and the gas, which we couple); the ionization parameter of the gas log U; the X-ray production efficiency, LX,0.5−8 keV/SFR; and
the black hole mass for our MCD model, MBH. We construct a grid of models while varying these parameters, and extract the CLOUDY predicted line fluxes for each point therein,
al-−3 −2 −1
log
10He
ii
/H
β
1040 1041 1042 1043 1044L
X,0.5−8 keV/SFR
herg s
−1(M
yr
−1)
−1 i −10 −5 0log
10Ne
v
/H
β
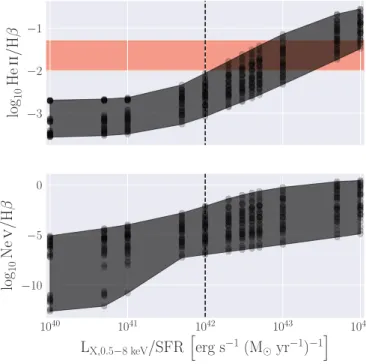
Figure 2. Line fluxes for Heii λ4686 and Ne v λ3426 (top and bottom panels, respectively) relative to Hβ for all points in our model grid, plotted as a function of the X-ray lumi-nosity per unit of star formation. The individual photoioniza-tion model grid points are displayed as black circles, and we outline in grey the flux range spanned by the models at each value of LX,0.5−8 keV/SFR. In the top panel for Heii, we shade in red the range of values observed for this line in low-metallicity nearby star-forming galaxies (e.g. Shirazi & Brinchmann 2012;
Senchyna et al. 2017,2019). Heii is only boosted into the ob-served range of values for this line by the addition of the HMXB spectrum for systems with very high X-ray production efficien-cies (LX,0.5−8 keV/SFR > 1042erg s−1/(M yr−1), marked by a vertical black dashed line).
lowing us to investigate the relative impact of these variables on nebular line emission.
We are particularly interested in how varying the HMXB contribution to the spectrum impacts the high-ionization nebular lines. In Figure2, we plot the predicted line fluxes for Heii λ4686 and Ne v λ3426 relative to Hβ for our entire grid as a function of the X-ray production efficiency. These two species have ionization potentials of 54 eV and 97 eV (respectively). As the X-ray production efficiency is increased from 1040–1044 erg/s at a star for-mation rate of 1 M /year, we find that the range of flux
in Heii relative to Hβ is increased by 2 orders of magni-tude. The effect on Nev is even more dramatic, increasing from essentially unobservable at < 10−5 times the flux of Hβ to uniformly greater than this limit for the highest X-ray productions rates. At the highest X-X-ray luminosities per SFR tested, both lines approach the flux of Hβ, indicating that the composite spectrum is effectively dominated by the hard Rayleigh-Jeans tail of the HMXB model. If we assume HMXBs provide the photons necessary to power Heii and Nev, then our models suggest we should observe a trend between enhanced flux in these lines relative to Hβ and the X-ray production efficiency.
−3 −2 −1
log
10He
ii
/H
β
1040 1041 1042 1043 1044L
X,0.5−8 keV/SFR erg s
−1(M
yr
−1)
−1 −6 −4 −2log
10Ne
v
/H
β
Z = 0.004
log U =
−2
0 1 2log
10(M
BH/M
)
Figure 3. Same as Figure2, but displaying a subset of the mod-els with metallicity and ionization parameter fixed to Z= 0.004 and log U= −2 to illustrate the dependence of the nebular lines on MBH. Increasing the black hole mass from 1–100 M can effectively boost the prominence of Heii by up to nearly an order of magnitude, but this only has a modest effect at low LX,0.5−8 keV/SFR values where the the stellar spectrum dominates the EUV.
However, Heii and Ne v are only substantially affected by the HMXB spectrum for systems with very large X-ray output relative to their star formation rate. As the X-ray production efficiency is increased from 1040to 1041erg/s per unit SFR, the ratio of Heii λ4686/Hβ remains in the range observed for the BPASSv2.2 models alone, with the maxi-mum achieved value increasing only from Heii/Hβ= 0.20% to 0.23%. This is an order of magnitude below measurements in metal-poor dwarf galaxies, which span 1–5% (the red band in Figure2, e.g.Shirazi & Brinchmann 2012;Senchyna et al. 2019). None of the models exceed 1% flux in Heii or Ne v relative to Hβ until LX,0.5−8 keV/SFR exceeds 1042erg s−1 at
1 M yr−1 (marked with a dashed black line in Figure 2).
That is, galaxies with HMXB populations less luminous per SFR than this cutoff do not produce sufficient flux in the EUV to power Heii at the level observed locally.
Though both Heii and Ne v increase in strength rela-tive to Hβ as the X-ray production efficiency is increased, the dispersion in their flux at fixed LX,0.5−8 keV/SFR evident in Figure 2 illustrates that they are also sensitive to the other model parameters (MBH, log U, and Z). We now in-vestigate the impact of these variables in-turn, starting with the model black hole mass. In Figure 3, we fix the metal-licity and ionization parameter to Z= 0.004 and log U = −2 while allowing MBH to vary over our full grid range (1–100
M ). At X-ray production efficiencies below 1042 erg/s at
1 M /year, the modeled black hole mass has essentially no
effect, since the EUV is still largely dominated by the stellar SED. At higher values of LX,0.5−8 keV/SFR where the HMXB
spectrum begins to impact significantly on the EUV, we see
−3.0 −2.5 −2.0 −1.5 −1.0 log 10 He ii /H β
Z = 0.004
M
BH/M
= 10
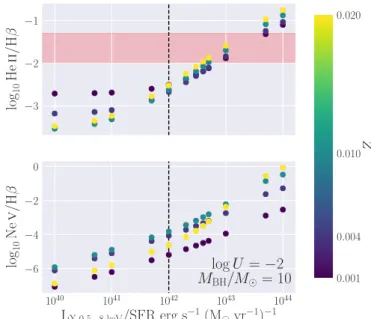
1040 1041 1042 1043 1044 LX,0.5−8 keV/SFR erg s−1(M yr−1)−1 −10.0 −7.5 −5.0 −2.5 log 10 Ne v /H β −3 −2 −1 log UFigure 4. Same as Figure 2, but with metallicity and black hole mass fixed to Z = 0.004 and MBH/M = 10 to investi-gate the dependence of the various lines on log U. The relative strength of Nev to Hβ is strongly dependent on log U, increasing with this quantity by up to more than five orders of magnitude with other parameters fixed. However, Heii is only modestly af-fected by an increase in the ionization parameter (especially at low LX,0.5−8 keV), due to the fact that both Heii and Hβ are re-combination lines. −3 −2 −1 log 10 He ii /H β 1040 1041 1042 1043 1044 LX,0.5−8 keV/SFR erg s−1(M yr−1)−1 −6 −4 −2 0 log 10 Ne v /H β
log U =
−2
M
BH/M
= 10
0.001 0.004 0.010 0.020 ZFigure 5. Same as Figure2, but with the ionization parameter and black hole mass fixed to log U= −2 and MBH/M = 10, while the metallicity Z is allowed to vary. At low X-ray production effi-ciencies where the stellar SED dominates (left of the dashed line), Heii is substantially more affected by decreasing metallicity than by log U or MBH, increasing by nearly an order of magnitude as the metallicity is decreased. Nev shows a more complicated be-havior, due to the competing effects of increased gas temperature and diminishing neon abundances with decreasing metallicity.
that increasing the black hole mass boosts both Nev and es-pecially Heii (since it is produced at lower energies). This is because a higher black hole mass yields a softer MCD spec-trum (Figure1), allowing the HMXB flux to play a larger role in the ionization structure of the nebula.
The gas geometry can also significantly affect the promi-nence of Heii and Ne v with the input spectrum fixed (Fig-ure4). Increasing log U from −3 to −1 can increase Nev/Hβ by nearly 3 orders of magnitude, by effectively expanding the size of the highest-ionization part of the Hii region. How-ever, log U has a smaller effect on the flux of Heii relative to Hβ (. 0.2 dex). Since He ii and Hβ are recombination lines, their ratio is fixed to first-order by the hardness of the in-put ionizing spectrum (e.g.Hummer & Storey 1987;Draine 2011;Senchyna et al. 2017).
The metallicity also plays a role in modulating the strength of Heii and Ne v. In the regime where the stellar SED dominates Heii production (left of the dashed line in Figure5), Heii is most strongly affected by metallicity, in-creasing by nearly an order of magnitude as metallicity drops from Z = 0.02 to 0.001. As mentioned in Section 2.1, this is due to the hardening of the stellar SED with decreasing metallicity. At high X-ray production efficiencies (right of the dashed line), Heii/Hβ decreases modestly with decreas-ing metallicity, due to the lowerdecreas-ing of the recombination rate with increasing gas temperature (Hummer & Storey 1987). In contrast, Nev/Hβ displays a very different behavior; at all but the highest X-ray production efficiencies, Nev/Hβ peaks at Z= 0.01 before dropping at lower metallicity. Since the adopted stellar SED is too soft to contribute effectively to these lines, this behavior is due primarily to gas physics, with a competition between the diminishing abundance of neon and the increasing electron temperature (due to less efficient cooling). At the lowest metallicities (Z< 0.01), the diminishing neon abundance dominates, and Nev become less prominent with decreasing metallicity. At the highest X-ray production efficiencies, gas heating is far more efficient, and this line simply decreases in strength with decreasing abundance over the entire metallicity range.
While MBH, log U, and Z all impact on Heii and Ne v to
some degree, our full set of photoionization models suggest two testable observational predictions independent of these variables if we assume that HMXBs dominate Heii produc-tion. First, strong Heii emission should be associated with very high X-ray production efficiencies: that is, X-ray lumi-nosities in-excess of 1042 erg/s for a galaxy forming stars at 1 M /year. And second, stronger Heii relative to Hβ (and,
with greater dispersion due to gas physics, Nev/Hβ) should positively correlate with higher X-ray luminosities per unit star formation rate. In the remainder of this paper, we will test whether these predictions hold in a sample of local star-forming galaxies with both high-quality Chandra and optical line constraints.
3 OBSERVATIONS
Through photoionization modeling, we have established an observational test of the scenario in which HMXBs dominate the production of Heii in star-forming galaxies (Section2). To investigate this, we have collated archival Chandra ACIS-S imaging of nearby z< 0.2 star-forming dwarf galaxies and
assembled both ESI and new MMT spectra covering Heii λ4686 and (in several cases) Ne v λ3426. Though X-ray de-tections have previously been published for several of the targets in our sample, the absence of reported coordinates for these X-ray sources and the fact that several of our col-lected datasets are unpublished requires that we reanalyze these X-ray data. We present the sample in Sections 3.1
and3.2; the optical spectroscopy in Section3.3; the Chan-dra data in Section3.4; and describe the results of this joint optical and X-ray analysis in Section3.5.
3.1 Selection of the Sample
In order to test whether HMXBs are responsible for Heii, we need an observational sample with high-quality constraints on both X-ray emission and nebular Heii. In particular, the X-ray imaging must have sufficiently high spatial resolution (. 100) to confidently associate X-ray point sources with the spectroscopic targets, which is presently only attained by Chandra. In addition, the optical spectra must have suffi-ciently high spectral resolution and signal-to-noise to confi-dently deblend the narrow (< 500 km/s) nebular He iiλ4686 recombination line from the broad (> 1000 km/s) compo-nent originating in the winds of WR or very massive O stars, which is generally not possible with SDSS spectra (see e.g. Senchyna et al. 2017). In the past several years, we have acquired high resolution optical spectra for a total of eleven star-forming dwarf galaxies which have Chandra X-ray imaging observations available in the archive (Table1). Though selected in different ways initially, all are actively star-forming galaxies at subsolar metallicity and thus po-tential hosts for metal-poor HMXB populations.
Eight of these eleven are galaxies targeted with HST /COS ultraviolet spectroscopy inSenchyna et al.(2017) andSenchyna et al.(2019) for which we also obtained deep echellette optical spectra (we will subsequently refer to these papers as S17 and S19, respectively). These galaxies were originally selected on the basis of either a detection of optical Heii emission in an SDSS spectrum (S17) and as having gas-phase metallicity measurements placing them in the regime of extremely metal-poor galaxies (XMPs, 12+ log O/H < 7.7, Z/Z . 0.1;S19). All are compact regions of active star
for-mation dominated by the light from young (typically< 50 Myr) stellar populations. We cross-matched the entire sam-ple of sixteen presented in these publications with publicly-available observations in the Chandra Observation Catalog accessed via ChaSeR to obtain the subsample of eight with Chandra coverage discussed here2. We refer the reader to these previous papers for a more thorough discussion of the sample properties.
We also obtained new deep optical spectra for three ad-ditional galaxies previously studied with Chandra. In par-ticular, we targeted three galaxies classified as Lyman Break Analogues (LBAs;Heckman et al. 2005) and studied in X-rays using Chandra byBasu-Zych et al.(2013) andBrorby et al. (2016, hereafter B16) with the MMT Blue Channel spectrograph: SHOC042, J2251+1427, and SHOC595. These
2 Note that while SB198 fromS17falls within the standard 100 search radius employed by ChaSeR, the optical target falls outside the footprint of the ACIS-S3 chip.
spectra provide coverage of both Heii λ4686 and Ne v λ3426. We will discuss the reduction and analysis of these observa-tions in Section3.3below.
3.2 Star Formation Rates and General Characterization
Before advancing to the high-quality optical spectra and Chandra data available for the galaxies in our sample, we will first discuss their bulk properties. All but one of the targeted systems (HS1442+4250) has an SDSS spectrum available as of the latest data release (DR15;Aguado et al. 2019), and the other (HS1442+4250) has an MMT spectrum described inS19. We derive distance estimates by comparing the red-shifts measured in these spectra to the local flow model pre-sented byTonry et al.(2000) with H0= 70 km/s/Mpc, with
this simply reverting to the cosmological distances for the most distant objects. We present these distances in Table1, along with gas-phase metallicities and the references to their derivation.
Since the higher-resolution spectra discussed in Sec-tion 3.3 do not all provide access to both Hβ and Hα,
we obtain uniformly-calibrated measurements of the strong optical lines from the SDSS spectra for reddening correc-tion and SFR estimacorrec-tion. We follow the procedure outlined in S17; S19: in particular, we measure line fluxes using a custom python routine based on MCMC fits ( Foreman-Mackey et al. 2013) with a linear continuum plus Gaussian line model, and correct for extinction by comparing the ob-served Balmer decrement to that predicted from our direct determination of Te with PyNeb (Luridiana et al. 2015),
assuming an SMC extinction curve (Gordon et al. 2003) af-ter correction for Galactic extinction (Schlafly & Finkbeiner 2011;Fitzpatrick 1999). We follow the procedure described inS17usingPyNeb to derive direct temperature metallic-ities (with [Oiii]λ4363) for the three LBAs from the B16
sample, yielding uniform metallicity measurements for the entire sample (Table 1). In the case of HS1442+4250, we use an MMT Blue Channel spectrum obtained with the 300 lines/mm grating on January 25, 2017 (described inS19). To correct for aperture differences between this MMT spectrum and the other SDSS spectra, we derive an effective aperture correction by comparing the measured fluxes of the strong lines of H and O in MMT spectra taken in the same con-figuration and on the same night for SBSG1129+576 and J1119+5130 to their SDSS spectra. This yields consistent correction factors of 0.58 and 0.57 for SBSG1129+576 and J1119+5130 with a scatter of ∼ 3% among the different lines, respectively; we adopt a value of 0.57 and add an additional statistical uncertainty of 10% in this conversion.
These measurements of Hα and Hβ provide a direct estimate of the current star formation rate in the spectral aperture where Heii is constrained. Following the standard methodology, we convert the dust-corrected Balmer line lu-minosities into SFR estimates using a conversion factor de-rived from the same BPASS v2.2 models employed in the photoionization modeling (Section2). In particular, we as-sume Z = 0.003 (corresponding to the mean metallicity of our sample, 12+ log O/H = 7.9, assuming solar abun-dances) and the fiducial BPASS IMF (Salpeter slope). For each galaxy, we derive an SFR conversion factor appropriate for the effective age of the dominant stellar population by
choosing the constant star formation rate model with pre-dicted Hβ equivalent width closest to that observed. The uncertainty in the resulting estimates (Table1) represents the statistical uncertainties in the flux measurement and de-termination of Q(Lyc)/LHα. These estimates only account for star formation within the spectroscopic aperture, and thus represent lower limits to the total star formation rate of the target galaxies.
These bulk measurements reveal a diverse set of ac-tively star-forming galaxies. They range in distance from ∼ 10 to 800 Mpc, with all but the relatively distant LBAs fromB16residing at < 50 Mpc (redshifts z . 0.01). Their gas-phase metallicities span from the extremely metal-poor regime 12+ log O/H = 7.5–7.7 up to over half solar metallic-ity at 12+ log O/H = 8.3. Though they are all dominated by young stars, their absolute star formation rates span over four orders of magnitude, from 10−3.6 to 100.77 M /year.
3.3 Optical Spectroscopy
Here, we collate and summarize the deep optical spectral constraints available for the systems under study. As demon-strated inS17, nebular and broader stellar Heii can be con-fused at the signal-to-noise and resolution typically attained in SDSS fiber spectra. We have specifically selected galax-ies for which we have additional optical spectral constraints that can separate nebular from stellar Heii and in some cases provide constraints on Nev λ3426, which probes even higher-energy photons. We obtained optical echelle spectra covering Heii and Hβ (but not Ne v) for eight of the systems with the Echellette Spectrograph and Imager (ESI;Sheinis et al. 2002) on Keck II in 2016–2017 as part of an ongoing joint optical and ultraviolet spectroscopic campaign (S17; S19). We refer the reader to these previous publications for a de-tailed description of the Keck/ESI observations and analysis, and present the measurements of dust-corrected Heii/Hβ derived from these spectra in Table3.
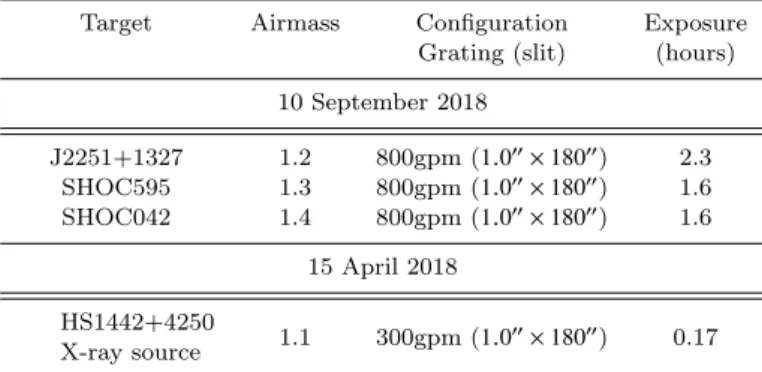
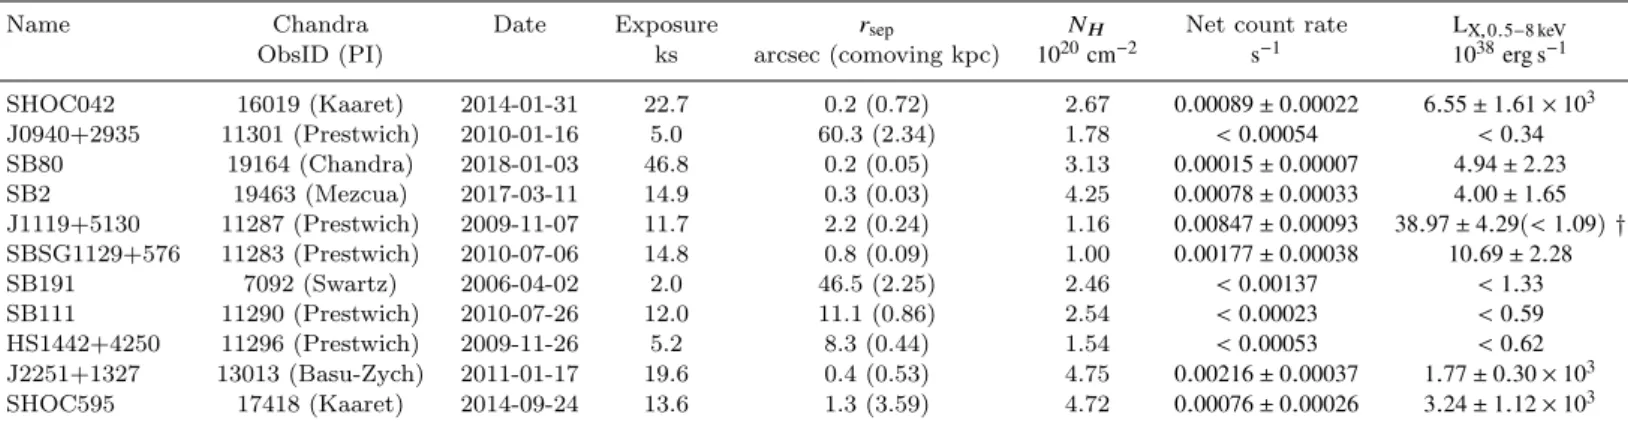
We have also obtained several new spectra with the Blue Channel Spectrograph on the 6.5m MMT (MMT/BC) specifically targeting Nev and He ii (Table2). We observed J2251+1327, SHOC595, and SHOC042 (LBAs from B16) on the night of September 10, 2018 with the 800 lines/mm grating and the 1.000× 18000 slit (0.75 ˚A/pixel dispersion), at central wavelengths chosen to span the rest-wavelength range from Nev λ3426 to Hβ at the SDSS redshift of each target. The standard stars G24-9, Feige 110, and LB 227 (re-spectively) and a HeAr/Ne comparison lamp were observed either before or after each target object with the same spec-trograph configuration for flux and wavelength calibration. In addition, on April 15 2018 we used the 300 lines/mm grating to observe an optical point-source identified in SDSS imaging as coincident with an X-ray source in the ACIS-S image of HS1442+4250 (see Section4for more details). All spectra were reduced using standard longslit techniques with a custompython pipeline.
To measure nebular Heii confidently in these MMT/BC spectra, we follow the same technique adopted with the Keck/ESI data. In order to distinguish the nebular contribu-tion from the broad> 500 km/s FWHM stellar component, we fit two Gaussians simultaneously to the Heii λ4686 line, with one constrained to narrow width comparable to that measured for the strong nebular lines (FWHM < 7 ˚A) and
Table 1. Basic properties of the eleven galaxies analyzed in this work, ordered by right ascension. Redshifts are measured from the strong optical lines in SDSS spectra (or, in the case of two of the XMPs, from an MMT spectrum; Senchyna et al. 2019), and the corresponding distances computed using the local velocity flow model presented byTonry et al.(2000) as described in (Senchyna et al. 2017,2019). We also present gas-phase metallicities measured using the direct-Te method and star formation rates measured using the Balmer lines.
Name RA Dec Sample z Distance 12+ log O/H W0,Hβ log10SFR(Hβ)/(M /yr) (J2000) (J2000) (Mpc) (direct-Te) (˚A) SHOC042 00:55:27.46 -00:21:48.7 B16 0.1674 805 8.21 ± 0.09 47 ± 4 0.77 ± 0.03 J0940+2935 09:40:12.87 +29:35:30.2 S19 0.0024 8 7.63 ± 0.14 37 ± 1 −3.58 ± 0.10 SB80 09:42:56.74 +09:28:16.2 S17 0.0109 46 8.24 ± 0.06 243 ± 17 −0.90 ± 0.02 SB2 09:44:01.87 -00:38:32.2 S17 0.0048 19 7.81 ± 0.07 274 ± 17 −1.61 ± 0.02 J1119+5130 11:19:34.37 +51:30:12.0 S19 0.0045 22 7.51 ± 0.07 50 ± 1 −2.31 ± 0.04 SBSG1129+576 11:32:02.64 +57:22:36.4 S19 0.0050 25 7.47 ± 0.06 81 ± 3 −2.45 ± 0.05 SB191 12:15:18.60 +20:38:26.7 S17 0.0028 10 8.30 ± 0.07 392 ± 23 −2.20 ± 0.02 SB111 12:30:48.60 +12:02:42.8 S17 0.0042 16 7.81 ± 0.08 102 ± 5 −2.37 ± 0.02 HS1442+4250 14:44:11.46 +42:37:35.6 S19 0.0023 11 7.65 ± 0.04 113 ± 4 −3.03 ± 0.05 J2251+1327 22:51:40.32 +13:27:13.4 B16 0.0621 279 8.29 ± 0.06 56 ± 1 0.22 ± 0.02 SHOC595 23:07:03.76 +01:13:11.2 B16 0.1258 589 8.07 ± 0.10 61 ± 4 0.49 ± 0.04
Table 2. A summary of the new MMT Blue Channel observa-tions presented in this work.
Target Airmass Configuration Exposure Grating (slit) (hours) 10 September 2018 J2251+1327 1.2 800gpm (1.000× 18000) 2.3 SHOC595 1.3 800gpm (1.000× 18000) 1.6 SHOC042 1.4 800gpm (1.000× 18000) 1.6 15 April 2018 HS1442+4250 X-ray source 1.1 300gpm (1.0 00× 18000) 0.17
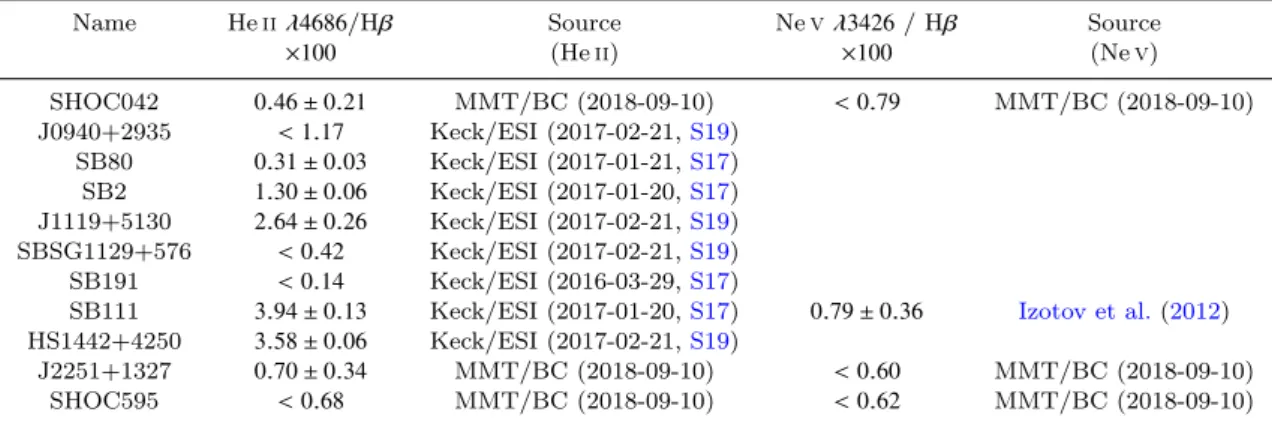
the other forced to be broader than this cutoff. The results of these fits are displayed in Figure6. We detect a distinct nar-row component in J2251+1327 and SHOC042 at a relative strength of Heii/Hβ = 0.0070 ± 0.0034 and 0.0046 ± 0.0021 (respectively), and place a 3σ upper limit on the nebu-lar component of Heii/Hβ < 0.0068 for SHOC595. These relatively weak detections (Heii/Hβ < 0.01) are consistent with the metallicities of these systems (12+ log O/H > 8.0) in the context of the trend towards stronger Heii at low metallicity (e.g. Figure 7 ofSenchyna et al. 2019, which in-cludes the other systems discussed in this paper). In ad-dition, these MMT spectra place strong constraints on the presence of nebular Nev λ3426 (Ne v/Hβ < 0.8 in all three cases). These line measurements and dereddened 3σ upper limits where appropriate are reported in Table 3. We also include the measurement of Nev/Hβ= 0.79±0.36 for SB111 (or J1230+1202) reported byIzotov et al. (2012). We dis-cuss these measurements in the context of the Chandra con-straints in the following section.
3.4 Chandra X-ray Imaging
All objects in our sample have publicly available Chandra ACIS-S imaging observations. While detections have been published for several of these systems in the past, these prior
studies generally do not include the coordinates of the iden-tified X-ray sources and our sample also includes several galaxies covered by unpublished Chandra datasets. This re-quires that we reanalyze the Chandra data in a uniform way. We compare to these literature measurements where avail-able in AppendixA. We first reprocessed the level 1 event files for these observations using the latest version of CIAO (4.11, CALDB version 4.8.2 Fruscione et al. 2006), focus-ing on the back-illuminated S3 chip which all targets were placed on. We usedfluximage to produce a clipped expo-sure map in the broad Chandra band, which we then used for source detection with a significance threshold of 10−6run on the√2 series of pixel scales (see e.g.Mineo et al. 2012;
Brorby et al. 2014).
The spatial resolution afforded by Chandra is a key ad-vantage in conducting a study connecting X-ray observations to optical data. The astrometry of Chandra detections on the ACIS-S detector is accurate to< 1.400in 99% of cases in comparisons with ICRS optical counterparts3. Since we are concerned in this work with the potential impact of HMXBs on nebular line emission measured on spatial scales of ∼ 100 (Section3.3), we are not interested in X-ray sources signif-icantly offset from the optical galaxy. This is in contrast to much of the previous work on these galaxies, where signif-icantly offset sources were included to account for the fact that HMXBs may be kicked up to hundreds of parsecs from their birthplace (e.g. Kaaret et al. 2004a; Zuo & Li 2010;
Brorby et al. 2014). It is important to note that even with this resolution, we cannot unambiguously associate X-ray sources with the gas in which the observed Heii is excited. At the distances of our targets, 100corresponds to comoving physical distances of 50 pc to 3 kpc, larger than the sizes of individual star clusters in the local universe (e.g.Meurer et al. 1995).
We adopt the 99% confidence positional accuracy limit of 1.400as a limiting radius to establish association between the X-ray sources and the observed optical line emission, and consider separations between 1.400–500on an individual
3 CIAO manual: http://cxc.cfa.harvard.edu/cal/ASPECT/
Table 3. Optical spectroscopic constraints on nebular Heii and Ne v for our target galaxies (including 3σ upper limits where appropriate). All measurements have been dereddened using an SMC extinction curve and the Balmer decrement measured in the corresponding SDSS spectrum.
Name Heii λ4686/Hβ Source Nev λ3426 / Hβ Source
×100 (Heii) ×100 (Nev)
SHOC042 0.46 ± 0.21 MMT/BC (2018-09-10) < 0.79 MMT/BC (2018-09-10) J0940+2935 < 1.17 Keck/ESI (2017-02-21,S19) SB80 0.31 ± 0.03 Keck/ESI (2017-01-21,S17) SB2 1.30 ± 0.06 Keck/ESI (2017-01-20,S17) J1119+5130 2.64 ± 0.26 Keck/ESI (2017-02-21,S19) SBSG1129+576 < 0.42 Keck/ESI (2017-02-21,S19) SB191 < 0.14 Keck/ESI (2016-03-29,S17)
SB111 3.94 ± 0.13 Keck/ESI (2017-01-20,S17) 0.79 ± 0.36 Izotov et al.(2012) HS1442+4250 3.58 ± 0.06 Keck/ESI (2017-02-21,S19)
J2251+1327 0.70 ± 0.34 MMT/BC (2018-09-10) < 0.60 MMT/BC (2018-09-10) SHOC595 < 0.68 MMT/BC (2018-09-10) < 0.62 MMT/BC (2018-09-10)
basis (see Section 3.5 and Appendix A). To compute net count rates, fluxes, and 68% uncertainties for these detected sources in the 0.5–8.0 keV band, we ran srcflux on the filtered level 2 event files assuming an absorbed power law model with photon index Γ = 1.7 and a neutral absorbing column with density NH set to the Galactic value towards
each system in the NRAO dataset of Dickey & Lockman
(1990) accessed by colden. This photon power law is a reasonable approximation of the shape of the assumed in-trinsic MCD spectrum over the 0.3–8.0 keV band, and is commonly assumed in flux measurements for similar samples (e.g.Douna et al. 2015). Adopting a steeper index of Γ= 2.0 (corresponding to a softer spectrum, as inMineo et al. 2012;
Fabbiano 2006) would decrease the inferred fluxes by 12+1
−2%.
If no sources were detected within 1.400from the SDSS ICRS coordinates on which the optical spectra were centered, we consider the target undetected in X-rays. In this case, we compute a 95% confidence upper limit to the count rate and flux usingsrcflux. In both cases, we convert the observed fluxes to luminosities in the same band using the distance to each galaxy (Table 1). These measurements and upper limits are presented in Table4.
One concern in computing the X-ray fluxes is the possi-bility that uncertainties in the absorbing column density of neutral gas towards each source might impact on the inferred X-ray luminosities. We do not have a robust way to estimate this internal absorption for these galaxies without X-ray spectral information or Lyα constraints (e.g.Thuan et al. 2004), so we follow the standard procedure for such data and correct only for Galactic NH as described above.
For-tunately, the galactic absorbing column density towards our sources is uniformly low (NH< 1021cm−2). Increasing the
as-sumed value of NH by a factor of five in the above-described
srcflux measurements increases the resulting LX,0.5−8 keV
values by a median factor of only 1.15, suggesting that the effect of accounting for additional absorption internal to the target galaxies would likely be small.
This procedure yields Chandra detections of seven of the galaxies in X-rays (Figure 7and Table 4). We discuss the results in more detail in Section3.5and AppendixA.
3.5 Results
With both optical and X-ray data in-hand, we can now build a picture of the X-ray properties of the galaxies in our sample. For a detailed discussion of the results for each system, we refer the reader to AppendixA. Following the procedure described in Section 3.4, we detect X-ray emis-sion cospatial with the star-forming clump targeted with optical spectroscopy in seven of the eleven galaxies in our sample (Table 4 and Figure 7). The resulting measure-ments of LX,0.5−8 keV range over three orders of magnitude,
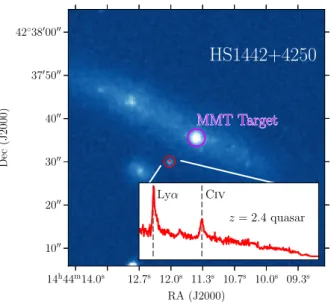
with the nearest sources revealing X-ray luminosities of 1– 40×1038 erg/s and the more distant LBAs residing at 2– 7×1041erg/s. The available observations place strong upper limits on the X-ray luminosities of the undetected systems, constraining their luminosities to . 1038erg/s. We find good agreement with the X-ray luminosities measured byBrorby et al.(2014,2016) for the subset of our Chandra observations previously analyzed in these works, but our more stringent matching of the X-ray and optical coordinates reveals two key differences with earlier analysis.
The undetected systems include two galaxies previously reported as HMXB hosts based upon the same Chandra data. For both SB111 and HS1442+4250 (Brorby et al. 2014), we identified a nearby X-ray source, but found that it resided at a distance of 1100and 800(respectively) from the center of the star-forming region targeted with ESI (Fig-ure 7). This offset is far larger than the uncertainty asso-ciated with the Chandra coordinates (< 1.400
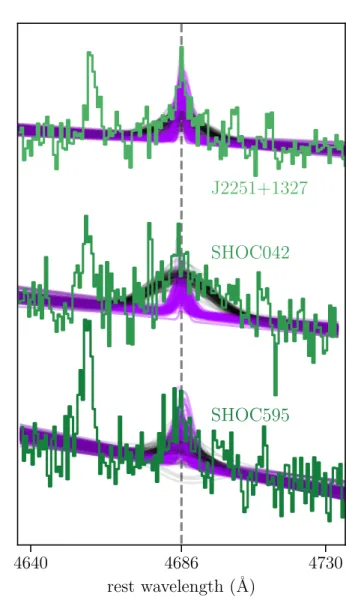
at 99% confi-dence). Even assuming the X-ray source resides at the same redshift, this places the object at a significant distance from the Hii region in which we observe nebular He ii (0.9 and 0.4 comoving kpc). In the case of SB111, the nearest X-ray source has no SDSS optical counterpart. However, the X-ray emission near HS1442+4250 is clearly associated with a faint i= 21 point source in the SDSS image (Figure7). As detailed in AppendixA, we obtained an MMT/BC spectrum of this source and discovered broad emission lines consistent with Lyα and C iv at z = 2.4 (Figure8). Thus, in this case the X-ray emission previously thought to belong to an ejected HMXB is actually associated with a background quasar. In both cases, we conclude the X-ray emission cannot be phys-ically associated with the observed nebular Heii.
Table 4. Summary of the Chandra ACIS-S observations analyzed in this work. We highlight the program ID and PI and the observation time for each. The separation between the nearest detected X-ray source and the optical spectroscopic target is given in both arcseconds and comoving kpc. We provide the galactic column density NH towards each source, and the count rate and derived luminosity if the target is detected with Chandra or the 95% confidence upper limits if not (see Section3.4and AppendixA).
Name Chandra Date Exposure rsep NH Net count rate LX,0.5−8 keV
ObsID (PI) ks arcsec (comoving kpc) 1020cm−2 s−1 1038erg s−1 SHOC042 16019 (Kaaret) 2014-01-31 22.7 0.2 (0.72) 2.67 0.00089 ± 0.00022 6.55 ± 1.61 × 10³ J0940+2935 11301 (Prestwich) 2010-01-16 5.0 60.3 (2.34) 1.78 < 0.00054 < 0.34 SB80 19164 (Chandra) 2018-01-03 46.8 0.2 (0.05) 3.13 0.00015 ± 0.00007 4.94 ± 2.23 SB2 19463 (Mezcua) 2017-03-11 14.9 0.3 (0.03) 4.25 0.00078 ± 0.00033 4.00 ± 1.65 J1119+5130 11287 (Prestwich) 2009-11-07 11.7 2.2 (0.24) 1.16 0.00847 ± 0.00093 38.97 ± 4.29(< 1.09)† SBSG1129+576 11283 (Prestwich) 2010-07-06 14.8 0.8 (0.09) 1.00 0.00177 ± 0.00038 10.69 ± 2.28 SB191 7092 (Swartz) 2006-04-02 2.0 46.5 (2.25) 2.46 < 0.00137 < 1.33 SB111 11290 (Prestwich) 2010-07-26 12.0 11.1 (0.86) 2.54 < 0.00023 < 0.59 HS1442+4250 11296 (Prestwich) 2009-11-26 5.2 8.3 (0.44) 1.54 < 0.00053 < 0.62 J2251+1327 13013 (Basu-Zych) 2011-01-17 19.6 0.4 (0.53) 4.75 0.00216 ± 0.00037 1.77 ± 0.30 × 10³ SHOC595 17418 (Kaaret) 2014-09-24 13.6 1.3 (3.59) 4.72 0.00076 ± 0.00026 3.24 ± 1.12 × 10³
†The X-ray detection in this system is > 200away from the optical spectroscopic target and likely does not contribute to the observed Heii, but is clearly associated with the galaxy; see AppendixA. We consider this galaxy detected for the purposes of this paper, but note the 95% confidence upper limit to the luminosity derived withsrcflux centered on the spectroscopic target and note this caveat in Figure9as well.
Balmer lines (Section 3.2), these Chandra detections pro-vide a measurement of the X-ray production efficiency of these galaxies. These systems power luminosities LX,0.5−8 keV ranging from 4 × 1039 to 8 × 1041 erg/s at a fixed SFR of 1 M /year (Appendix A). Crucially, none of the galaxies
ex-ceeds 1042 erg/s per M /year. We discuss the implications
of these measurements in the context of our photoionization model predictions in the following section.
4 DISCUSSION
With the assembled set of eleven metal-poor galaxies with optical and X-ray constraints, we can test whether HMXBs are a plausible explanation for the observed nebular Heii. In particular, we derived two key observational predictions from our photoionization modeling adopting the assump-tion that HMXBs provide the extra EUV ionizing radiaassump-tion necessary to power Heii (Section 2). First, we found that the HMXB spectrum could only boost the Heii luminosity relative to Hβ to & 1% at extraordinarily large X-ray lumi-nosities per star formation rate of> 1042erg/s at 1 M /year
(Figure 2). And second, our models indicate that this sce-nario should create a positive correlation between high X-ray luminosities at fixed SFR and strong high-ionization emis-sion relative to Hβ (especially high He ii/Hβ).
First, we compare the X-ray production efficiencies at-tained by the galaxies in our sample to the results of our model grid. In Figure9, we plot the flux ratio of Heii to Hβ as a function of the X-ray luminosity per unit star formation rate measured for these eleven galaxies, alongside our full set of photoionization models. Our targets with Heii detections are entirely disjoint from the photoionization modeling, pow-ering Heii up to an order of magnitude stronger relative to Hβ than expected. For instance, consider SB2, in which we detect Heii at a high flux ratio with Hβ of 0.0130 ± 0.0004. This system is detected in X-rays as well, but at an X-ray
production efficiency of only 1.47 ± 0.61 × 1040 erg/s for a star formation rate of 1 M /year, two orders of magnitude
lower than we estimate is required for the HMXB spectrum to reach the level of the stellar SED at the He+-ionizing edge. Seven of our target systems are detected in Heii, in-cluding some of the highest values of Heii/Hβ yet measured locally (up to 0.04), and yet all are found to be relatively inefficient producers of X-ray flux. None reach an X-ray pro-duction efficiency of 1042 erg/s for a star formation rate of 1 M /year, which we predict is the minimum required for
HMXBs to begin powering strong Heii. This indicates that HMXBs (with a standard MCD spectrum) in these galaxies do not produce sufficient flux at the He+-ionizing edge to account for the observed Heii emission.
Our photoionization models also make a clear prediction that if HMXBs are primarily responsible for He+-ionization, we should observe a correlation between Heii/Hβ and the SFR-normalized X-ray luminosity, with the strongest Heii emission expected in galaxies most efficient in X-ray pro-duction. Our observational results show no evidence for a relationship between these features. In particular, the six galaxies with the strongest X-ray emission (exceeding 1041 erg/s in LX,0.5−8 keV for a SFR of 1 M /year) include only
three Heii detections, with all but one revealing relatively-weak Heii (He ii/Hβ . 0.01). The most prominent cases of Heii emission in our sample (He ii/Hβ > 0.025, among the highest observed in any star-forming galaxies) occur in three systems: J1119+5130, SB111, and HS1442+4250. The latter two of these are both confidently undetected in X-rays, with limiting X-ray production efficiencies as low as< 1.2 × 1040 erg/s at 1 M /year. In the third case (J1119+5130), it is
highly unlikely that the X-ray emission associated with the galaxy is capable of powering the observed Heii due to the sizable spatial offset from the spectroscopic aperture (Sec-tion3.5). Analogously to Heii, our models also suggest that the relative strength of Nev should correlate with higher X-ray production efficiencies if it is also powered by HMXBs.
4640
4686
4730
rest wavelength (˚
A)
normalized
F
λSHOC595
SHOC042
J2251+1327
Figure 6. The Heii λ4686 complex for each of the LBAs ob-served with Blue Channel (green). We overplot models drawn from the fit posterior distribution, decomposed into the broad (black) and narrow (purple) components atop the fit linear con-tinuum. A narrow component is detected at> 2σ for J2251+1327 and SHOC042, whereas the profile for SHOC 595 appears to be completely dominated by a line profile with width significantly larger than the strong nebular lines.
While only three of our systems have Nev constraints, none of these three reveal detections of both X-ray emission and Nev. The X-ray output of these systems appears entirely de-coupled from the strength of high-ionization emission, con-trary to our expectations assuming the two are physically related.
A potential source of concern in this analysis is HMXB variability, which could plausibly cause scatter relative to the models in Figure9if systems were observed with optical spectroscopy during an outburst and in X-rays during a pe-riod of quiescence. Due to their nature as accretion-driven systems, HMXBs exhibit variability in both spectral shape and normalization during outbursts (e.g.Mineo et al. 2012;
Kaaret & Feng 2013;Brorby et al. 2015). We see tentative possible evidence for variability in the X-rays in the multiple
observations of SB80 and SHOC595 (Section3.5). However, the strongest nebular Heii emission in our sample (in SB111) was found at nearly identical strength relative to Hβ in our 2017 Keck/ESI spectrum and in a 2011 MMT/BC spectrum (Izotov et al. 2012; Senchyna et al. 2017), suggesting that in contrast to the emission from HMXBs, the Heii emission in this object is not significantly variable. In addition, in this scenario we would expect to see with equal likelihood observations of systems with enhanced LX,0.5−8 keV due to being caught in an outburst and relatively low Heii/Hβ (i.e. residing to the right of the models in Figure9), which we do not observe. This argument applies also to the similar concern that geometrical beaming (as we see some evidence for in ultraluminous X-ray sources, e.g. King et al. 2001;
Kaaret et al. 2017) may lead some systems to appear under-luminous in X-rays while still producing strong Heii; in this scenario we would also expect some systems to appear un-expectedly bright in X-rays relative to their Heii emission when observed down the beam, which we do not. Even exam-ining the larger sample of X-ray detected galaxies presented byB16, there are no instances of a measurement of an X-ray production efficiency in-excess of 1042 erg/s per 1 M /year
SFR in any local dwarf galaxy. Thus, HMXB variability or beaming cannot readily explain the discrepancies we have discussed.
With HMXBs effectively ruled-out as the dominant source of Heii in these galaxies, we consider the possibility that the model stellar ionizing spectra may simply be un-derestimating the flux at the He+-ionizing edge. Even with the latest generation of models for the expanding outer at-mospheres and winds of massive stars incorporating line-blanketing and NLTE effects, the estimation of emergent flux beyond the He+-ionizing edge for a given star remains significantly uncertain (e.g.Gabler et al. 1992; Puls et al. 2005). In addition, there are large systematic uncertainties in predictions of the evolutionary tracks taken by stars at low metallicity, especially for those which undergo binary mass transfer. In particular, stars stripped by binary mass transfer or structurally reshaped by high rotation rates can potentially provide substantial ionizing flux beyond 54.4 eV even at relatively low initial mass (e.g.Sz´ecsi et al. 2015;
Vink 2017;G¨otberg et al. 2017,2018;Kub´atov´a et al. 2019). Such stars have only recently been included in any form in population synthesis predictions (Eldridge & Stanway 2012;
G¨otberg et al. 2019), and may provide a natural explanation for both the strong metallicity dependence and lack of corre-lation with high specific star formation rates found for Heii in dwarf galaxies (e.g.Senchyna & Stark 2019;Plat et al. 2019) as well as some of the peculiar Heii nebulae lacking co-incident massive stars in the Local Group (e.g.Pakull 2009;
Kehrig et al. 2011). While some constraints can be placed on such stars from resolved work in the Local Group (e.g.
Smith et al. 2018), extending calibrations of stellar models below the metallicity of the SMC in this way is challenging with current facilities given the limited number of appro-priate resolved stellar populations (e.g.Bouret et al. 2015;
Garcia et al. 2019;Evans et al. 2019). The study of nebu-lar Heii in large samples of dwarf galaxies in the context of improved stellar population synthesis models may provide some of our only insight into and constraints on such stars, which are likely to exist but challenging to directly observe. It is still possible that other non-stellar ionizing sources
SHOC042 J0940+2935 SB80 SB2 J1119+5130 SBSG1129+576
SB191 SB111 HS1442+4250 J2251+1327 SHOC595
Figure 7. Optical and X-ray imaging for the eleven galaxies in our sample. The bluescale background image is a linear-scaled display of the SDSS u-band image probing light from recently-formed stars, and in red we overplot contour lines at count levels [0.25, 0.5, 1, 2] from the primary Chandra image after smoothing by a normalizedσ = 100Guassian. A purple circle with radius 200centered on the optical spectral target (the brightest region in the u-band) is drawn in each case. Chandra X-ray sources are confidently detected within this optical radius in five cases, where it is possible for them to contribute to the observed nebular emission.
14h44m14.0s 12.7s 12.0s 11.3s 10.7s 10.0s 09.3s 42◦3800000 3705000 4000 3000 2000 1000 RA (J2000) Dec (J2000)
HS1442+4250
z = 2.4 quasar Lyα CivFigure 8. Follow-up spectroscopy of the X-ray source near HS1442+4250. The Chandra contours (red; same as Fig.7) corespond precisely to a faint point source visible in the SDSS r-band (background bluescale image) 800away from the optical star-forming region in HS1442+4250 studied with previous deep spec-troscopy (outlined with a purple 200-radius circle). A 10-minute MMT/BC spectrum (inset, red) reveals strong broad emission at 4130 and 5470 ˚A (observed-frame), which we interpret as Lyα and Civ at z= 2.4. In this case, the observed X-ray emission appears to be associated with a background AGN rather than an ejected HMXB associated with HS1442+4250.
contribute to the He+-ionizing photon budget. Fast radiative shocks driven by supernovae and stellar winds are another candidate origin for Heii and Ne v emission (e.g.Dopita & Sutherland 1996;Thuan & Izotov 2005;Izotov et al. 2012;
Plat et al. 2019). While galaxies with strong Heii emission often lack clear signatures of significant shock-ionized gas (e.g. Senchyna et al. 2017; Kehrig et al. 2018;Berg et al.
10
4010
4110
42L
X
/SFR(Hα) [erg/s (M
/yr)
−1
]
10
−310
−2He
ii
λ
4686
/
H
β
Photoionization ModelsSenchyna+17 Senchyna+19b Brorby+16
Figure 9. Observed and predicted Heii/Hβ line ratios versus LX,0.5−8 keV/SFR for our observational sample and our photoion-ization model grid. The observed galaxies detected in Heii lie uniformly in-excess of the maximal predictions of our photoion-ization model grid over the inferred range of X-ray production efficiencies. In addition, the most intense Heii-emitters show no indication of enhanced X-ray emission relative to galaxies with less extreme Heii. This comparison suggests that HMXBs are not the dominant source of Heii production in this sample of galaxies.
2018), a small shock contribution can boost Heii while keep-ing the other high-ionization UV lines consistent with obser-vations in some cases (Plat et al. 2019). However, no pre-dictive model of this shock contribution can yet account for the strong observed metallicity dependence in nebular Heii