HAL Id: hal-00295724
https://hal.archives-ouvertes.fr/hal-00295724
Submitted on 12 Aug 2005
HAL is a multi-disciplinary open access
archive for the deposit and dissemination of
sci-entific research documents, whether they are
pub-lished or not. The documents may come from
teaching and research institutions in France or
abroad, or from public or private research centers.
L’archive ouverte pluridisciplinaire HAL, est
destinée au dépôt et à la diffusion de documents
scientifiques de niveau recherche, publiés ou non,
émanant des établissements d’enseignement et de
recherche français ou étrangers, des laboratoires
publics ou privés.
the ultraviolet
G. van Soest, L. G. Tilstra, P. Stammes
To cite this version:
G. van Soest, L. G. Tilstra, P. Stammes. Large-scale validation of SCIAMACHY reflectance in the
ultraviolet. Atmospheric Chemistry and Physics, European Geosciences Union, 2005, 5 (8),
pp.2171-2180. �hal-00295724�
Atmos. Chem. Phys., 5, 2171–2180, 2005 www.atmos-chem-phys.org/acp/5/2171/ SRef-ID: 1680-7324/acp/2005-5-2171 European Geosciences Union
Atmospheric
Chemistry
and Physics
Large-scale validation of SCIAMACHY reflectance in the ultraviolet
G. van Soest, L. G. Tilstra, and P. StammesRoyal Netherlands Meteorological Institute (KNMI), P.O. Box 201, 3730 AE De Bilt, The Netherlands Received: 28 December 2004 – Published in Atmos. Chem. Phys. Discuss.: 21 March 2005
Revised: 30 June 2005 – Accepted: 3 August 2005 – Published: 12 August 2005
Abstract. In this paper we present an extensive validation of
calibrated SCIAMACHY nadir reflectance in the UV (240– 400 nm) by comparison with spectra calculated with a fast ra-diative transfer model. We use operationally delivered near-real-time level 1 data, processed with standard calibration tools. A total of 9 months of data has been analysed. This is the first reflectance validation study incorporating such a large amount of data. It is shown that this method is a valu-able tool for spotting spatial and temporal anomalies. We conclude that SCIAMACHY reflectance data in this wave-length range are stable over the investigated period. In addi-tion, we show an example of an anomaly in the data due to an error in the processing chain that could be detected by our comparison. This validation method could be extremely use-ful too for validation of other satellite spectrometers, such as OMI and GOME-2.
1 Introduction
The reflectance measured by a satellite instrument is at the basis of all geophysical information derived from the obser-vations. The quality of the retrieved data depends crucially on the quality of the reflectance and its calibration. Besides, the spectral reflectance data set of the earth in the UV-visible-NIR range that was started with GOME (Global Ozone Mon-itoring Experiment) (Burrows et al., 1999) may be relevant for global change research, if it can be continued over a long time period. Therefore, it is of vital importance that the re-flectance is carefully characterised spectrally and radiomet-rically, but also temporally and spatially to accommodate for trends and other systematic anomalies. Such a characteri-sation of SCIAMACHY nadir reflectance is the aim of this validation study. The properties of the observed radiation
Correspondence to: P. Stammes
as derived from the raw measurements are collectively called “level 1 data”. These include earth radiance, solar irradiance, reflectance and polarisation.
Calibrated level 1 data is produced from the unprocessed (level 0) detector signal through application of a set of cali-brations and corrections, e.g. wavelength calibration, radio-metric calibration, polarisation correction, dark current cor-rections, etc. (Slijkhuis, 2001). Anomalies in level 1 data may be caused by the instrument, by the auxiliary parame-ters used for calibration and correction, and by the algorithms used to apply these.
A common strategy in the validation of retrieved geophys-ical parameters is the comparison with a collocated obser-vation made by a different instrument. In the validation of level 1 data, this procedure is not generally applicable, as there is usually no instrument that can perform an in-dependent collocated measurement. SCIAMACHY is in a relatively favourable position in this respect, since SCIA-MACHY reflectance can be compared with that measured by MERIS (Medium Resolution Imaging Spectrometer) on the same platform (Acarreta and Stammes, 2005) and with the reflectance measured by the GOME spectrometer on ERS-2, which is in the same orbit with 30 min time difference. A drawback of this approach is the dependence on the calibra-tion of the other instrument, which is a concern especially for the degraded UV channel of GOME. The MERIS calibration has been shown to be accurate to within 2–3% (Santer et al., 2005), but this instrument is not equipped with a UV band. Validation of the SCIAMACHY IR channels is also not pos-sible by comparing with these instruments.
The nadir reflectance measured by a satellite instrument can, however, also be validated by comparing it with the re-flectance that is calculated with a radiative transfer model (RTM). In order for this method to work, a careful estimate has to be made of the state of the atmosphere that is being sampled, along with the sensitivity of the spectrum to all parameters. The estimated parameters are the input for the
RTM, which calculates the spectrum expected from the satel-lite instrument. We choose to employ this technique in this paper, and apply it to the UV part of the spectrum, for two reasons: first, it complements the validation by comparison with other satellite instruments, and second, the sensitivity of the UV spectrum to the ground albedo and clouds, which are the main uncertainties in the input parameters, is small, especially for λ<350 nm (Tilstra et al., 2005). The major er-ror source around 300 nm is ozone, which can be estimated accurately.
SCIAMACHY (Scanning Imaging Absorption Spectrom-eter for Atmospheric Chartography) is a large spectral range, medium resolution spectrometer aimed at studying the com-position of the Earth’s atmosphere (Bovensmann et al., 1999). The instrument was launched onboard the ESA En-visat platform in 2002. Several different retrieval algorithms are applied to obtain information about trace gas concentra-tions. The different methods present specific requirements to the quality of the level 1 data. Ozone, NO2 and other trace gas column densities, for example, are typically re-trieved with a DOAS-type retrieval scheme (Platt, 1994), which is particularly sensitive to small scale spectral struc-ture in the reflectance spectrum, and less so to broadband offsets. Ozone profile retrieval and retrieval of aerosol or surface properties, on the other hand, critically depend on the absolute radiometric calibration, and suffer less from spuri-ous structures in the spectrum. Wavelength calibration is of crucial importance to all.
All systematic SCIAMACHY reflectance validation ac-tivities until present have concentrated on nadir data from specially processed verification data sets. Although these verification data have the same properties, in theory, as the operational data product, a validation of operational SCIA-MACHY data may reveal characteristics of those data that would not be found otherwise. There may be accidental differences between the processing of dedicated verification data and the operational chain. More importantly, some sys-tematic properties of the data only show up in a data set that covers a large area geographically and a long time span. Val-idation of a large data set may reveal certain correlations that are overlooked if single orbits are investigated. Conversely, due to considerations of computing time and data volume, in-vestigation of a large data set is less suited for a high spectral resolution investigation of possible residual structure in the reflectance spectrum.
2 Data and method
2.1 SCIAMACHY data
We investigate SCIAMACHY data from the near-real-time delivery stream, dated from 1 September till 15 December 2003, and from 1 April till 31 August 2004. These data are commonly used as a basis for geophysical retrieval products
generated by scientific institutes. Over these periods, the in-strument was stable, apart from a decontamination between 18 and 30 June. Data from this period have been excluded from the study. There were no large changes in the oper-ational level 0–1b data processor configuration. The 2003 data have processor version 4.01 or 4.03, while the 2004 data have versions 5.01 and 5.04. We found no trace of the change in minor version number in the data. Noticeable effects of the difference between the processor versions 4.0x and 5.0x will be discussed below. Some parameters in the calibration key data have also changed, but signatures of a difference cannot be found in our analysis.
The level 1b data are calibrated to level 1c using ESA’s
SciaL1Cprogram, v2.2.9, using all calibration options (i.e., memory effect, dark current, stray light, pixel-to-pixel gain, etalon, and polarisation corrections, and wavelength and ra-diometric calibrations). From the calibrated radiance I and solar irradiance E observations, a reflectance Robsis calcu-lated which is defined as:
Robs=
π I µ0E
. (1)
µ0is the cosine of the solar zenith angle.
Each SCIAMACHY state is divided in four “substates”, labelled “East”, “East-Center”, “West-Center”, and “West”, to yield four reflectance measurements per state. The di-mensions of a substate are 240 km in the scan direction and 450 km in the flight direction of the satellite. Within each substate suitable ground pixels are averaged. The substates are introduced to limit data volume and computing time, and to average the very small signal for λ<290 nm, while keeping the possibility to study a possible viewing angle dependence and to be able to handle ground albedo variation. Four sub-states still allow a reasonably homogeneous ground albedo to be assigned to a scene and keep the possibility of investi-gating an eventual scan angle dependence.
2.2 Simulation and data selection criteria
The reflectance observed by SCIAMACHY is compared to the reflectance spectrum calculated with a radiative transfer model (RTM). The RTM we use is LidortA (van Oss and Spurr, 2002). This is a fast code based on the discrete ordi-nates algorithm (Chandrasekhar, 1950). In retrieval applica-tions it has the enormous advantage of calculating the deriva-tives of the reflectance with respect to the input parameters analytically. We used this feature for determining the sensi-tivity of our method to some of the input parameters in an-other study (Tilstra et al., 2004). LidortA is a scalar model; the error made by ignoring the polarisation in the TOA (top-of-atmosphere) reflectance is corrected using a precalculated look-up table. The RTM is run on the ECMWF pressure grid of 60 layers up to 65 km.
G. van Soest et al.: Validation of SCIAMACHY reflectance in the UV 2173
We calculate the relative difference dR between the re-flectance derived from data measured by SCIAMACHY and the reflectance Rsimmodelled by our RTM:
dR=
Robs
Rsim
−1 . (2)
The wavelength range covered is 250–400 nm for most of the data studied, part of the comparison was only done for 270– 340 nm for reasons of computational cost. We only apply this method in the UV because this spectral range can be mod-elled well with relatively coarse guesses for the atmospheric state and ground albedo.
The sensitivity of the simulation to input parameters, as well as an end-to-end error estimate of the use of RTM sim-ulations as a validation method, are the subjects of another paper (Tilstra et al., 2005). For a full discussion we refer to that work. Its main conclusion is that the standard devia-tion of the error in the simuladevia-tion due to input parameters is approximately 3% over the wavelength range 250–400 nm, and up to 8% around 305 nm where the sensitivity to the ozone profile and column is largest. The sensitivity study of Tilstra et al. (2005) does not include clouds. Our cloud fil-tering procedure adds an offset between 0% and 2% to their error estimate for λ>310 nm, which is largest for the longer wavelengths in the study. In general, the error in the sim-ulation is caused almost exclusively by errors in ozone for
λ<300 nm, while for λ>330 nm, only errors in surface and lower-atmosphere parameters, such as clouds, aerosol, and ground albedo, contribute. In the intermediate wavelength range, all input parameters add significantly to the simula-tion error.
The wavelength grid for the RTM run has a spacing of 1 nm. SCIAMACHY data are convolved with a Gaussian synthetic slit function of 1 nm width before interpolating to the RTM grid. The ozone absorption cross section used in the RTM calculations was also convolved with this function. Since the contribution of inelastic scattering is small, and the atmospheric scattering cross sections are essentially constant over the 1 nm wavelength bins, this is an adequate approxi-mation.
Based on the sensitivities of the RTM reflectance to input parameters, we defined a few criteria to decide upon accep-tance or rejection of a ground pixel. These are listed below:
– Clouds: We only include (nearly) cloud-free pixels. The
radiance from clouded pixels depends too strongly on the assumed value of the cloud albedo to be useful in a study like this.
The cloud mask is based on cloud fractions from the cloud retrieval scheme FRESCO (Koelemeijer et al., 2001), available from the TEMIS project web-site1. FRESCO is a very stable, reliable cloud retrieval 1Tropospheric Emission Monitoring Internet Service, http://www.temis.nl/
scheme that has been validated against several inde-pendent data sets. The main drawback is that it over-estimates cloud fractions over areas with large ground albedo in the O2-A band, leading to rejection of e.g. states over desert.
We require the state to have a maximum of 20% cloud coverage; if the average cloud fraction in a state is larger it is entirely rejected. From the states with a cloud frac-tion less than 20%, only pixels with a cloud fracfrac-tion smaller than 5% are included in the average over the substate. In this paper, the term “cloud free” means that a scene fulfils this criterion.
The error introduced by treating a pixel with a 5% cloud fraction as “cloud free” can be estimated by studying the correlation between dRand cloud fraction. We find that the maximum error incurred is 5% of the reflectance for λ≈380 nm, assuming 5% cloud coverage of the sub-state. For λ<300 nm there is no sensitivity to clouds. In the set of accepted substates, we have 2% cloud cover-age on avercover-age. It gives rise to a positive error of about 0.02 in dR, smaller for shorter wavelengths. The ef-fect can be compensated in principle by adjusting the ground albedo, but our study of the albedo sensitivity of the TOA radiance (Tilstra et al., 2005) demonstrates that this is not straightforward, as for most common surface types the sensitivity is wavelength dependent.
– Ground albedo: Ground albedos for individual cloud
free ground pixels are obtained from the GOME LER (Lambertian Equivalent Reflectance) database (Koele-meijer et al., 2003) by spatial and temporal interpola-tion. Subsequently the albedos of accepted ground pix-els in each substate are averaged. For each state, only one RTM run is performed; the atmospheric and sur-face parameters are identical for the 4 substates. For this reason, the ground albedo of a state has to be ho-mogeneous. Substates with a ground albedo that differs from the average albedo of the state by more than 20% are excluded from the comparison.
– Solar zenith angle: Only nadir SCIAMACHY data with
small to moderate solar zenith angles are included. The cloud and ozone data, that are inputs for the RTM, of-ten suffer from reduced accuracy for large solar zenith angles. This diminishes their value as a reference. To prevent any influence on our study, we only include data with solar zenith angles smaller than 75◦, corresponding
to SCIAMACHY state IDs 4–7.
– Missing input: (Sub)states for which any of the input
data are missing are rejected.
Other inputs needed for the RTM run are temperature, pressure, and ozone profiles. The temperature and geopo-tential height profiles are taken from ECMWF operational analyses. For the ozone profiles we use either the TOMS v8
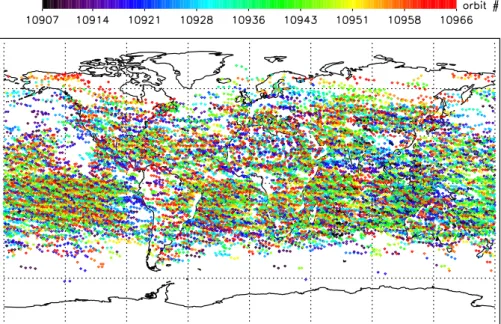
Fig. 1. Spatial distribution of all substates between April–June 2004 included in the study, using TOMS climatological ozone profiles for
state selection. The colour codes the orbit number.
ozone profile climatology2 (McPeters et al., 2003), or pro-files derived from collocated SCIAMACHY limb measure-ments in the Chappuis band (Rozanov et al., 2004; Brinksma et al., 2004). The TOMS climatology is parameterised in month, latitude, and ozone column. For the ozone column density we take an interpolated value from the assimilated TOSOMI data set (Eskes et al., 2004), available from the TEMIS website, and retrieved by a method that is not sen-sitive to absolute radiometric calibration. The ozone profiles are interpolated to ECMWF pressure levels, using ECMWF temperature and geopotential height profiles. We assume that no aerosol is present; a significant contribution to TOA radi-ance due to aerosol only occurs in desert areas and would give rise to an error in dRsmaller than 2–3% in those regions for λ>300 nm (Tilstra et al., 2005). Desert areas are often (erroneously) flagged clouded by FRESCO and thus rejected. The data included in the validation has a spatial coverage that is shown in Fig. 1. This figure represents all selected data from April till June 2004, using the TOMS climatology for ozone profiles. The coverage in the case of collocation with limb-retrieved ozone profiles is smaller as these are not always available.
Ideally, the relative difference between observation and simulation dR=0, though in practice we expect some scatter, caused by inaccuracies of the RTM input. Biases are either caused by the calibration of the measurement, or by system-atic deviations of the input data. The probability of the latter has been minimised by the selection of the spectral range of
2available from the TOMS Version 8 website, http://toms.gsfc.nasa.gov/version8/version8 update.html
the study, where the sensitivity to most input parameters is small and by a very strict cloud mask. The only ingredient of the simulation that is difficult to filter is the ozone profile. A deviation in the ozone profile, however, gives a clear spectral signature and can thus be discriminated.
3 Results and discussion
In this section we will primarily discuss data from 1 April till 18 June 2004, using the TOMS climatology as an ozone pro-file source. Data from 1 July till 31 August 2004, using the TOMS climatology have also been studied, but for a smaller wavelength range. There is no difference between the two periods in 2004, before and after decontamination of the in-strument.
3.1 Spectral analysis
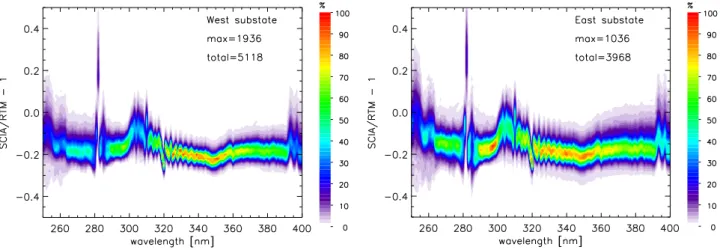
Figure 2 shows a spectrum of histograms of relative differ-ences between reflectances derived from measured SCIA-MACHY data and calculated with the RTM. For each wave-length in the calculated spectrum, a histogram of relative dif-ferences is made. The bin size of the histograms is 0.02. In Fig. 2 all data in accepted West (top) and East (bottom) sub-states from 1 April till 18 June 2004 are used (orbits 10 907– 12 036). Ozone profiles come from the TOMS climatology. The spectrum has been normalised to the absolute maximum count (100% in the colour scale). The analysis of means and standard deviations was performed by fitting a Gaussian curve to the histogram for each wavelength.
G. van Soest et al.: Validation of SCIAMACHY reflectance in the UV 2175
Fig. 2. Spectra of histograms of the relative difference between measured and calculated reflectances, normalised to the maximum value.
(top) For West substates; (bottom) for East substates. In total, 3968 valid East substates are included, and 5118 valid West substates. The peak near 282 nm is a Fraunhofer line which has not been masked out in our analysis. The feature near 305 nm is due to the ozone profile used as input for the RTM.
A few observations can be made about Fig. 2. First, the relative difference over most of the spectral range is between
−0.15 and −0.20. This confirms previous findings in studies of the radiometric calibration of SCIAMACHY, compared to MERIS (Acarreta and Stammes, 2005) and GOME (Latter et al., 2003). The result is also consistent with a study compar-ing SCIAMACHY solar irradiance with theoretical reference spectra (No¨el, 2004). The centre of the histograms for East substates is at a dR-value that is 0.01 higher than for West, in the range 310–400 nm (because the analysis is done by fit-ting, features of the ensemble that are smaller than the bin size can be discerned). This difference is smaller than the accuracy of the simulation applied to any one scene, but the standard deviation of the mean of an ensemble of scenes is smaller by
√
N. Since a difference between East and West substates persists in the average over thousands of scenes, it must be a real, systematic feature.
Second, there is a remaining feature between 300–310 nm which we attribute to a systematic inaccuracy of the ozone profile. We used the TOMS v8 Ozone Profile Climatology in these calculations, which has been developed for use with the TOMS instrument. Possible limitations in other appli-cations have not yet been studied, to our knowledge. The feature in the spectrum would be broader (300–320 nm) if caused by a systematic deviation of the ozone column val-ues used. In addition, validation of the TOSOMI algorithm has shown that the ozone column densities it yields under-estimate the ozone column by approximately 2% compared to groundbased, rather than an overestimate which would be necessary to produce a smaller simulated reflectance.
Third, the spread in East substates for λ>320 nm is larger than in West substates by about 0.02. The standard devia-tion of dR in West substates is between 0.025 and 0.05, in East substates between 0.04 and 0.07. We do not have a full
explanation for this observation. The number of accepted substates is substantially smaller for East than for West. The larger rejection rate for East substates is probably due to sun glint geometries over ocean, which are detected as clouded by FRESCO. A residual effect of higher radiance caused by sun glint may persist in the comparison between observed and simulated reflectance, leading to a positive bias (1% in Fig. 2) and smaller accuracy for East substates. In addi-tion, the difference may be caused partly by shortcomings of the polarisation correction applied by the calibration util-ity, since East scenes are much more strongly polarised than West. However, the sensitivity of the instrument to polarisa-tion between 320 and 340 nm is very small so there we expect no effect. Also, the polarisation sensitivity exhibits a spectral structure around 350 nm, which we do not see in Fig. 2.
Fourth, an odd–even stagger is present, particularly for 300 nm<λ<340 nm. This is probably an effect due to the undersampling of the ratio dR and differences between the wavelength calibrations of the SCIAMACHY data and the ozone absorption cross sections we used. After we became aware of possible problems due to undersampling, we inves-tigated the error incurred on a small set of spectra and found it to be less than 1% r.m.s. The effects of undersampling are only manifest on wavelength scales close to the grid spac-ing, and hence do not affect our conclusions which are about larger spectral ranges. However, in future applications of this method, it is advisable to decrease the sampling interval of the simulation to 0.5 nm at most, and interpolate these data to compute dR.
Finally, the spread for λ<290 nm becomes larger for smaller wavelengths. This is due to the small signal in this wavelength range, and hence the extreme sensitivity to cali-bration accuracy.
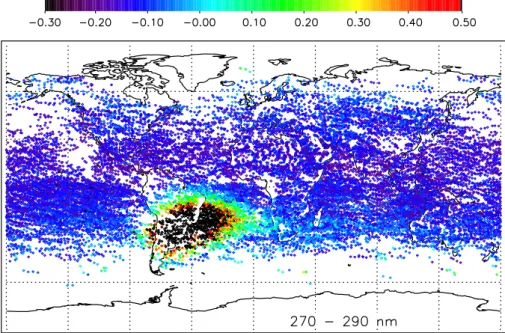
Fig. 3. Map of the relative difference between observed and simulated reflectance, dR, averaged between 270 and 290 nm. The South Atlantic Anomaly is clearly visible.
The width of the dR-histograms shown in Fig. 2 (West) agrees well with the accuracy of the comparison predicted by the sensitivity studies presented by Tilstra et al. (2005). In the same study we found that for wavelengths larger than 400 nm the ground albedo has a large impact on the TOA ra-diance. The increasing spread in the relative difference dRfor
λ>320 nm is caused by the increasing sensitivity to ground albedo. Since the knowledge of surface albedo is limited, we do not apply this method to longer wavelengths.
We note that by this method, small scale spectral struc-ture cannot be detected reliably. For this purpose, a careful comparison of individual spectra is a better strategy. How-ever, it is possible to find anomalies of approximately 3–4 nm wide, provided the sensitivity to any of the input parameters does not exhibit any spectral structure at the wavelength un-der consiun-deration.
One useful application of the results presented in Fig. 2 is the correction of the instrument’s radiometric calibration with a polynomial fit based on the relative difference between observed and simulated reflectance. The advantages of deter-mining a correction based on in-flight measurements are that it is based on the actual state of the instrument in operation, and it can easily be updated in a consistent manner to com-pensate for degradation effects.
3.2 Geographical analysis
The particular value of the technique we present in this paper is the potential to study spatial or temporal anomalies, which would not be found if a single state or a single orbit were studied. To demonstrate this, we made maps of the relative
difference ¯dR(λ0), spectrally averaged in a 20 nm wide win-dow around λ0, given in nm. Figure 3 is a map of ¯dR(280) (i.e. the mean dRbetween 270 and 290 nm), covering part of channel 1 of the instrument.
Figure 3 shows that dR(280) is very constant over the globe, with values ranging between −0.20 and −0.10, apart from the South Atlantic Anomaly (SAA), the large black spot over South America and the Southern Atlantic. There is no significant other geographical dependence. The magnitude of the increased noise in the SAA, caused by cosmic radia-tion, is large compared to the real detector signal, and thus appears as a large positive difference Robs−Rsim. Our analy-sis clearly indicates the exact extent of the SAA, and pro-vides a reliable data set that can be used to mask out the phenomenon. The current mask used in data processing is a rectangular box in (lon,lat) coordinates, extending from (120◦W,–60◦S) to (50◦E, 10◦N). It covers all of Southern America, the Southern Atlantic, Central and Southern Africa and a large part of the Eastern Pacific (Slijkhuis, 2001). The masked region is so large that nearly half of the orbits pass through the SAA. Since calibration measurements that are flagged as being affected by the SAA are not used, an over-sized mask leads to a waste of calibration data.
The scenes affected by the SAA have not been masked out in the analysis of Sect. 3.1. About one in 25 substates in-cluded in the analysis is in the SAA region, and these have a large, positive dR. Their contribution to Fig. 2 is a very sparse cloud of points with λ<300 nm and positive dR. Its density is so low that it can not be seen in Fig. 2. The ef-fect of scenes in the SAA on the discussion in Sect. 3.1 is very small, because the Gaussian fits to the histograms are
G. van Soest et al.: Validation of SCIAMACHY reflectance in the UV 2177
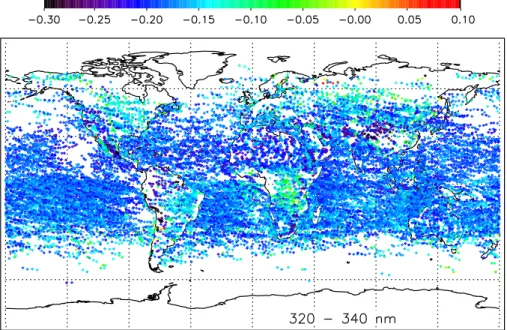
Fig. 4. Map of the relative difference between observed and simulated reflectance, dR, averaged between 320 and 340 nm.
hardly affected by a sparse set of points in the far wing of the distribution.
In a similar manner as described for Fig. 3, we made a map of ¯dR(330), displayed in Fig. 4. For this wavelength range, 320–340 nm in channel 2 of SCIAMACHY, dRis again con-stant over the globe, with values scattered between −0.15 and −0.20. Note that the colour scales for Figs. 3 and 4 dif-fer. Only at higher northern latitudes, notably in Canada and Siberia, and in central Africa, ¯dR(330) appears to be higher than for the rest of the world. We do not have an explanation for this observation. A possible cause for the higher observed reflectance in Africa could be an increased aerosol load due to biomass burning in this season, which we neglect. Case study: Effect of erroneous dark current in 2003 The analysis of the data from 1 September–15 December 2003 was done with ozone profiles derived from SCIA-MACHY limb measurements, in the wavelength range 270– 340 nm. This data set is more sparse because limb data are not available for all days, and because of a stricter setting (a maximum allowed difference of 10%) of the filter for ground albedo inhomogeneity. The data show the same behaviour as discussed above for the channel 2 wavelength range 320– 340 nm, shown in Fig. 4. The relative difference between the reflectance observed by SCIAMACHY and that simu-lated by the RTM is homogeneous over the studied part of the globe, with values of ¯dR(330) around −0.15. On average, the relative difference in this data set is 0.03 less negative than the analysis of the 2004 data based on TOSOMI total ozone and TOMS climatology profiles. Whether this difference is caused by annual or seasonal effects in SCIAMACHY data,
or by a difference in the ozone profiles used for the input of the simulation, cannot be decided strictly on the basis of these data. Ozone profile validation results (Brinksma et al., 2004), and the absence of observed seasonal effects in SCIA-MACHY, however, suggest that the limb ozone profile is the most likely cause of the observed difference.
For the wavelength range in channel 1, the conclusion is different. A map of ¯dR(280) is shown in Fig. 5. Again, the SAA is clearly visible as a compact region of large observed radiance. However, there is another large region where the difference between SCIAMACHY and RTM reflectance is markedly higher than for the rest of the world, namely over the Central and Western Pacific, Australia, Eastern Asia, and the Indian Ocean. This area coincides with the region from which orbits are processed specifically by one of two Envisat data processing facilities, namely the ESRIN station. Four orbits daily are processed at ESRIN, the remaining ten are processed at Kiruna.
Investigation of the processor initialisation files showed that the ESRIN facility used an erroneous dark current file. The relative error in the tabulated parameter was negligible, but owing to the very small signal for wavelengths smaller than 300 nm, the resulting error in the reflectance is 40%. In other channels of SCIAMACHY, the calibrated detector sig-nal is much larger and small errors in the dark current have a much smaller effect, that may often remain unnoticed.
As a result of a general processor reconfiguration, the faulty dark current file was replaced in March 2004. It is advised not to use SCIAMACHY channel 1 data processed by the ESRIN facility prior to this date. A difference be-tween Kiruna and ESRIN orbits was also found in SO2 re-trievals from channel 2 (A. Richter, personal communication,
Fig. 5. As Fig. 3, for September–December 2003. The geographical area, from which the orbits processed at the ESRIN facility originate, is
marked with blue lines. The SCIAMACHY data show a 40% offset in the reflectance in this region.
2004), probably caused by the same error. Investigation of TOSOMI ozone (retrieved from channel 2) and Observation minus Forecast data from the TOSOMI ozone assimilation showed no feature associated with the anomalies in level 1 data.
The average reflectance difference ¯dR(280) of orbits pro-cessed at Kiruna is scattered between −0.10 and +0.10. This higher average value compared to the 2004 data of Fig. 3 may be caused by the pointing inaccuracy of the Envisat platform, affecting the limb profiles (Brinksma et al., 2004). Pointing accuracy was improved in December 2003. The wrong alti-tude of the ozone maximum influences the integrated strato-spheric ozone column density and hence the simulated spec-trum.
3.3 Temporal analysis
A critical issue for long term instrument performance is degradation of optical components or sensors. Also, the cal-ibration of the instrument may, for whatever reason, show slow drifts or seasonal variations that cannot be discovered by investigating a single state or orbit. Our validation system is a valuable tool for monitoring changes on long time scales. An example is given in Fig. 6. It displays the average ¯dR over the entire wavelength range (250–400 nm), as a function of orbit number. Values >0 are in the SAA region and hence cannot be trusted. But the rest of the data present a clear picture. The instrument and its calibration are stable over the investigated period, except for two episodes (approx. or-bits 11 220–11 280 and oror-bits 11 950–12 036) where the re-flectance as derived from SCIAMACHY measurements is a
significant 3% lower than normal. After the first episode, the spread in the data starts to increase, until the end of the in-vestigated period. The most probable explanation of these sudden changes of instrument behaviour is an operation or data processing change, though the documentation available to the authors does not mention any exceptions.
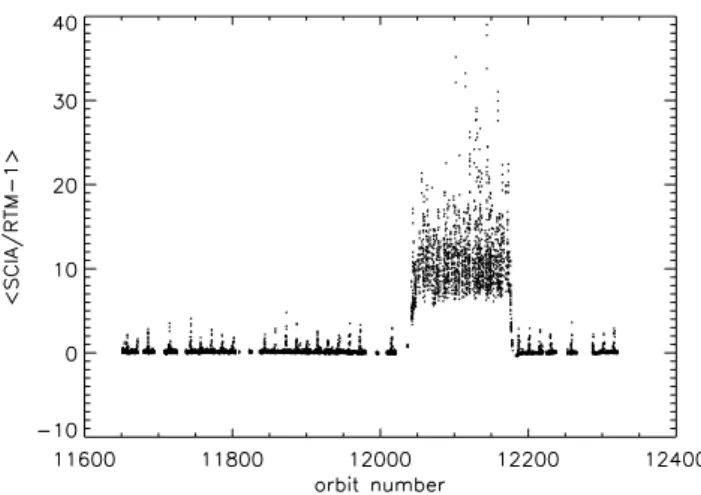
Case study: Decontamination in channel 1
With time, an ice layer forms on the infrared detectors of SCIAMACHY, because they act as a cold trap. This ice causes transmission loss and scattering problems. To alle-viate this situation, SCIAMACHY is periodically heated to a temperature of 280 K to remove the ice layer. This heating is called decontamination. In these periods, data from the IR channels cannot be used, while the UV-Vis channels are supposedly not affected.
We performed our study for a period which included a decontamination episode. A non-nominal decontamination took place between orbits 12 031 and 12 208. In channel 2 the effect of the heating is not significant, although the av-erage reflectance observed by SCIAMACHY is about 1% lower than just before and after decontamination. But in channel 1 the effect of decontamination is huge, in fact, much larger than the effect of the SAA. The higher temperature in-creases the dark current by a relatively small amount, which is, however, about 10 times the calibrated signal for pixels in the wavelength range 270–290 nm. This change in the dark current is not adequately accounted for. An example is given in Fig. 7.
G. van Soest et al.: Validation of SCIAMACHY reflectance in the UV 2179
Fig. 6. Time series from 1 April–18 June 2004 of the average
dif-ference between observed and simulated reflectance for the entire wavelength range 250–400 nm. Note the small, but striking, anoma-lies around orbit numbers 11 250 and 12 000.
3.4 Application to other instruments
The validation of satellite-measured reflectance spectra by comparison with RTM simulations is not limited to SCIA-MACHY. Other instruments for which this method may be successfully applied are OMI (Ozone Monitoring Instru-ment) and the GOME-2 series. In principle, it would also be suitable for GOME, but the stringent selection criteria for clouds and ground albedo homogeneity, given GOME’s large ground pixel size, will lead to a high data rejection rate.
OMI (Stammes et al., 1999; Levelt et al., 2002) is ideally suited to be tested with the validation technique described in this paper. Most of the instrument’s spectral range (270– 500 nm) can be simulated reliably. The small footprint en-sures that many pixels are cloud free, and provide a good pos-sibility to group pixels with a homogeneous ground albedo. Cloud retrieval from the O2–O2-band at 477 nm (Acarreta et al., 2004) can provide exactly collocated information for cloud masking. The range of viewing angles of OMI is very large, 114◦, so it is important to be able to check viewing angle dependence. OMI has the advantage that it is not sen-sitive to polarisation. Our fast RTM provides the possibility to evaluate the large amount of data generated by the instru-ment.
GOME-2 is very similar to SCIAMACHY’s UV-Vis chan-nels in nadir mode. The comparison of GOME-2 reflectance with an RTM can be conducted in exactly the same manner as described here for SCIAMACHY.
4 Summary and conclusions
In this paper, we have presented a flexible and versatile method for validation of reflectance measured by remote sensing spectrometers in the UV. It was applied to
SCIA-Fig. 7. Time series of ¯dR(280) showing the effect of decontamina-tion, between orbits 12 031 and 12 208 (18–30 June 2004), on chan-nel 1. dRrises to a value around 10 (1000%)! The usual assumption is that the UV-Vis channels of SCIAMACHY are not affected by de-contaminations. The periodic small peaks rising to about 2 during the rest of the period are caused by states in the SAA.
MACHY level-1 data from the operational near-real-time data stream, that is often used by research groups as a ba-sis for scientific retrievals. We have shown an analyba-sis of data from late 2003 and mid 2004, demonstrating the power of the method.
The findings are consistent with earlier results, but sup-plements them in a number of ways. The spread in our his-togram analysis of Fig. 2 validates the study of the reliabil-ity of the comparison between observed and simulated re-flectance for single states (Tilstra et al., 2004, 2005). The ex-tent of the SAA was shown to be much smaller than the mask that is currently used in data processing. Figure 3 can be used as a basis for a more accurate mask. The potential of our method for discovering inhomogeneities in the data process-ing or instrument performance were shown by the examples of the effect of decontamination on the reflectance in channel 1 (Fig. 7), and the large consequence of a small error in the dark current parameters used by the data processor (Fig. 5). We also found two short episodes where the reflectance (av-erage 250–400 nm) derived from the SCIAMACHY observa-tions is approximately 3% lower than normal.
A general conclusion that we draw from all these examples is that observations for λ<300 nm should be handled with care. The calibrated signal in this spectral range is orders of magnitude smaller than the corrections that are applied to the raw measurements. As a result, the level 1c data that are used as input for retrievals are extremely sensitive to calibra-tion inaccuracies. The errors introduced can easily amount to 100%. If these data are to be used for retrievals, an averaging procedure should be applied, as well as quality control, e.g. by comparing with an RTM.
Acknowledgements. The work performed for this publication is
(partly) financed by the Netherlands Agency for Aerospace Pro-grammes (NIVR). Operational data processing and distribution are being performed by ESA and DLR-DFD within the Envisat ground segment.
We thank H. Eskes of KNMI for help with assessing the impact of reflectance anomalies on ozone retrieval. Ch. von Savigny of IFE/IUP at the University of Bremen is much acknowledged for making the limb ozone profile data set available to us. We are grateful to G. Lichtenberg at SRON and the SCIAMACHY Calibration Tiger Team for illuminating the calibration algorithms, and for stimulating discussion.
Edited by: U. Platt
References
Acarreta, J. R. and Stammes, P.: Calibration comparison between SCIAMACHY and MERIS on board Envisat, IEEE Geosci. Re-mote Sens. Lett., doi:10.1109/LGRS.2004.838348, 2005. Acarreta J. R., de Haan, J. F., and Stammes, P.: Cloud pressure
re-trieval using the O2–O2absorption band at 477 nm, J. Geophys. Res., 109, D05204, doi:10.1029/2003JD003915, 2004.
Bovensmann, H., Burrows, J. P., Buchwitz, M., Frerick, J., No¨el, S., Rozanov, V. V., Chance, K. V., and Goede, A. P. H.: SCIA-MACHY: Mission objectives and measurement modes, J. Atmos. Sci., 56, 127–150, 1999.
Brinksma, E. J., Piters, A. J. M., Boyd, L. S., Parrish, A., Bracher, A., von Savigny, C., Bramstedt, K., Schmoltner, A.-M., Taha, G., Hilsenrath, E., Blumenstock, T., Kopp, G., Mikuteit, S., Fix, A., Meijer, Y. J., Swart, D. P. J., Bodeker, G. E., McDermid, I. S., and Leblanc, T.: SCIAMACHY ozone profile validation, Pro-ceedings of the Second Workshop on the Atmospheric Chemistry Validation of Envisat (ACVE-2), ESA-ESRIN, Frascati, Italy, 3– 7 May 2004, ESA SP-562, 2004.
Burrows, J. P., Weber, M., Buchwitz, M., Rozanov, V. V., Ladst¨atter-Weißenmayer, A., Richter, A., de Beek, R., Hoogen, R., Bramstedt, K., Eichmann, K.-U., Eisinger, M., and Perner, D.: The Global Ozone Monitoring Experiment (GOME): Mis-sion concept and first scientific results, J. Atmos. Sci., 56, 151– 175, 1999.
Chandrasekhar, S.: Radiative Transfer, Dover, New York, 1950. Eskes, H. J., van der A, R. J., Brinksma, E. J., Veefkind, J. P., de
Haan, J. F., and Valks, P. J. M.: Retrieval and assimilation of Sciamachy ozone columns, Proceedings of the XX Quadrennial Ozone Symposium (vol. I), Kos, Greece, 1–8 June 2004, 33–34, Athens, Greece, 2004.
Koelemeijer, R. B. A., de Haan, J. F., and Stammes, P.: A database of spectral surface reflectivity in the range 335–772 nm de-rived from 5.5 years of GOME observations, J. Geophys. Res., 108(D2), 4070, doi:10.1029/2002JD002429, 2003.
Koelemeijer, R. B. A., Stammes, P., Hovenier, J. W., and de Haan, J. F.: A fast method for retrieval of cloud parameters using oxy-gen A band measurements from the Global Ozone Monitoring Experiment, J. Geophys. Res., 106, 3475–3490, 2001.
Latter, B. G., Siddans, R., and Kerridge, B. J.: Intercomparison of reflectances observed by SCIAMACHY, GOME, AATSR and ATSR-2, Geophys. Res. Abstr., 5, 11 451, 2003.
Levelt, P. F., Veefkind, J. P., Voors, R. H. M., and de Vries, J.: OMI algorithm theoretical basis document: OMI instrument, level 0– 1b processor, calibration & operations, ATBD-OMI-01, vol. I, NASA, 2002.
McPeters, R. D., Logan, J. A., and Labow, G. J.: Ozone climatolog-ical profiles for version 8 TOMS and SBUV retrievals, Eos Trans. AGU, 84(46), Fall Meet. Suppl., Abstract A21D-0998, 2003. No¨el, S.: Determination of correction factors for
SCIA-MACHY radiances and irradiances, Tech. Note IFE-SCIA-SN-20040514 IrrRadCorrection, Univ. of Bremen, Bremen, Ger-many, 2004.
Platt, U.: Differential Optical Absorption Spectroscopy (DOAS), in: Air monitoring by Spectroscopic Techniques, edited by: Sigrist, M. W., Chemical Analysis, 127, 27–76, New York, 1994. Rozanov, A., von Savigny, C., Bovensmann, H., Bracher, A., and Burrows, J. P.: Description of the scia-arc SCIAMACHY scientific O3 and NO2 profile data set, http://www.iup.physik.uni-bremen.de/∼sciaproc/STROZONE/
DOCU/Scia data doc.pdf, Univ. of Bremen, Bremen, Germany, 2004.
Santer, R., Martiny, N., and Smolskaia, I.: Vicarious calibration of MERIS over dark waters in the near infrared, accepted for publi-cation in Proceedings of the Envisat Symposium, 6–10 Septem-ber 2004, Salzburg, Austria, 2A2-106, 2005.
Slijkhuis, S.: Envisat-1 SCIAMACHY Level 0 to 1c Processing Algorithm Theoretical Basis Document, ENV-ATB-DLR-SCIA-0041, Issue 2, Deutsches Zentrum f¨ur Luft- und Raumfahrt e.V., Oberpfaffenhofen, Germany, 2001.
Stammes, P., Levelt, P. F., de Vries, J., Visser, H., Kruizinga, B., Smorenburg, C., Leppelmeier, G., and Hilsenrath, E.: Scientific requirements and optical design of the Ozone Monitoring Instru-ment on EOS-CHEM, Proceedings of SPIE Conference on Earth Observing Systems IV, July 1999, Denver, Colorado, USA; SPIE Vol. 3750, 221–232, 1999.
Tilstra, L. G., Acarreta, J. R., Krijger, J. M., and Stammes, P.: Ver-ification of SCIAMACHY’s polarisation correction over the Sa-hara desert, Proceedings of Envisat Validation Workshop, Fras-cati, Italy, 9–13 December 2002, ESA SP-531, 2003.
Tilstra, L. G., van Soest, G., de Graaf, M., Acarreta, J. R., and Stammes, P.: Reflectance comparison between SCIAMACHY and a radiative transfer code in the UV, Proceedings of the Sec-ond Workshop on the Atmospheric Chemistry Validation of En-visat (ACVE-2), ESA-ESRIN, Frascati, Italy, 3–7 May 2004, ESA SP-562, 2004.
Tilstra, L. G., van Soest, G., and Stammes, P.: Method for in-flight satellite calibration in the ultraviolet using radiative transfer cal-culations, with application to SCIAMACHY, J. Geophys. Res. accepted, doi:10.1029/2005JD005853, 2005.
van Oss, R. F. and Spurr, R. J. D.: Fast and accurate 4 and 6 stream linearized discrete ordinate radiative transfer models for ozone profile retrieval, J. Quan. Spec., 75, 177–220, 2002.