HAL Id: hal-01933122
https://hal.archives-ouvertes.fr/hal-01933122
Submitted on 23 Nov 2018
HAL is a multi-disciplinary open access
archive for the deposit and dissemination of
sci-entific research documents, whether they are
pub-lished or not. The documents may come from
teaching and research institutions in France or
abroad, or from public or private research centers.
L’archive ouverte pluridisciplinaire HAL, est
destinée au dépôt et à la diffusion de documents
scientifiques de niveau recherche, publiés ou non,
émanant des établissements d’enseignement et de
recherche français ou étrangers, des laboratoires
publics ou privés.
Experimental Investigation of Linear Energy Deposition
Using Femtosecond Laser Filamentation in a M=3
Supersonic Flow
Paul-Quentin Elias, Nicolas Severac, Jean-Marc Luyssen, Jean-Pierre Tobeli,
François Lambert, Reynald Bur, Aurélien Houard, Yves-Bernard André,
Sylvain Albert, André Mysyrowicz, et al.
To cite this version:
Paul-Quentin Elias, Nicolas Severac, Jean-Marc Luyssen, Jean-Pierre Tobeli, François Lambert, et al..
Experimental Investigation of Linear Energy Deposition Using Femtosecond Laser Filamentation in a
M=3 Supersonic Flow. AIAA Propulsion and Energy 2018, Jul 2018, CINCINNATI, United States.
�hal-01933122�
Experimental Investigation of Linear Energy Deposition
Using Femtosecond Laser Filamentation in a M=3
Supersonic Flow
Paul-Quentin Elias
DPHY, ONERA, Université Paris Saclay, F-91123 Palaiseau, France
Nicolas Severac, Jean-Marc Luyssen, Jean-Pierre Tobeli, François Lambert, Reynald Bur
DAAA, ONERA, Université Paris Saclay, F-92190 Meudon, France
Aurélien Houard, Yves-Bernard André, Sylvain Albert, André Mysyrowicz
Laboratoire d'Optique Appliquée – ENSTA ParisTech - Ecole Polytechnique, Palaiseau, F-91761, France
and Ivan Doudet
Phasics, Espace technologique, Route de l'Orme des Merisiers, F-91190 Saint-Aubin, France
The goal of this study is to demonstrate experimentally the “Laser Spike” concept in a supersonic flow. The “Laser Spike” uses a thin filament of plasma created by a femtosecond laser. This plasma filament formed by the TeraWatt laser pulse acts as a linear energy deposition upstream of the shock wave created by a blunt body. It has been found that the laser energy deposition induces a significant transient reduction of the drag. This reduction has been quantified using a drag balance. These experiments have been simulated numerically by modeling the plasma filament as a source term in the energy equation. It is shown that the plasma filament created by the ultra-short laser pulse forms a low-density heated core that interacts with the detached bow shock. This interaction produces an inflating recirculating bubble and leads to a transient reduction of the drag. These findings demonstrate the interest of ultrashort laser for flow control. Drag reduction, flow control and trajectory control are among the possible applications of the “laser spike” concept. Sonic boom alleviation could also be improved with this device.
I.
Introduction
FF-body energy deposition in supersonic flows has been considered for many years, both experimentally and numerically, as a way to reduce the drag, alleviate the sonic boom or provide a steering mechanism. These considerations are particularly interesting for the development of more efficient supersonic and hypersonic vehicles system, since they may translate in longer cruising range, quieter operation and agile steering capabilities, respectively.
Among the different methods to deposit the energy, microwave-induced breakdown [1]–[5] and laser-induced breakdown [6]–[11] have been extensively investigated as these processes enable a volume energy deposition through the focusing of electromagnetic energy. This latter method has been investigated in wind tunnel experiments, both in single pulse mode [12], [13] or in repetitive mode [10], [14], on blunt body at supersonic speed. In both cases, significant modifications of the flowfield near detached shock wave were observed, coupled to a decrease of the drag. In these experiments, the energy deposition is localized in a volume close to the focal point of the laser. The deposition produces a spot of heated gas that subsequently interacts with the flowfield. Because of this localized nature, the interaction is transient and quasi-steady effects are sought using high repetition rate.
Recently, as a way to improve the interaction time and reduce the repetition frequency, it has been suggested to use elongated and linear energy deposition [15]–[18]. This idea is guided by the recent progress of femtosecond lasers, which are known to create thin ionized channels [12][13][19]. These channels can be used to guide an electric discharge and there is currently an ongoing research effort to couple more energy to this ionized channel using various mechanisms (more powerful nanosecond lasers [21], pulsed discharges or microwave excitation [22]). This
concept has been dubbed the “Laser Spike”, as it aims at perturbing and deflecting the upstream flow in a fashion that recalls aerospikes. Assuming an elongated or filamentary energy deposition in front of a supersonic body, numerical simulations have consistently shown a significant drag reduction. However, the actual method to obtain this elongated energy deposition has not been demonstrated experimentally, nor tested in a wind tunnel.
A recent experimental work [23] has shown that significant gas heating can be obtained with femtosecond pulses only, provided that the pulse energy is large enough (energy range between 5 mJ and 250 mJ, pulse duration 50-200 fs). Temperature rise of several hundred Kelvin in air have been measured in a filamentary volume of length between 5 and 10 cm; in addition, the conversion efficiency of the pulse energy to heat can reach up to 60%. The linear energy deposition is in the range 0.1-4 mJ/cm, which is consistent with the requirements derived through parametric numerical simulations [18]. In addition, this avoids the use of a secondary power source. This key result has opened the way to an experimental demonstration of linear energy deposition in a supersonic flow.
The goal of this paper is to report on recent experiments aimed at demonstrating the « Laser Spike » concept. These experiments have been performed in Onera’s R1Ch wind-tunnel, using the ENSTAMobile laser chain to produce ultrashort laser pulses in the TeraWatt range.
The first part of the paper will describe the experimental setup used for the experiments. The second part of the paper will present the results of this experimental investigations. First, the energy deposition in quiescent air will be described. Second, the effect of the femtosecond laser energy deposition in the M=3 airflow will be presented. Schlieren characterization will show the details of the interaction and flow modifications. The drag and pressure measurements will also be presented and discussed. Finally, the experimental results will be compared to numerical simulations of the laser energy deposition.
II.
Experimental setup
A. Wind-tunnel
The tests are performed in Onera’s R1Ch blow-down wind tunnel. This facility is an open-jet wind-tunnel and uses a M=3 axisymmetric nozzle with an exit section 310 mm in diameter. The maximum stagnation conditions are 15 bar and 380 K for the pressure and temperature, respectively, yielding a maximum mass flow rate of 60 kg/s. When operating at low stagnation pressure (~3-5 bar) the test chamber is pumped down to facilitate the priming of the nozzle. The supersonic jet is collected and slowed down in a supersonic diffuser and collected in a 500 m3 vacuum sphere.
For this project, the useful testing time varies between 15 s to 25 s, depending on the flow conditions. The range of stagnation pressure used in the experiments is: 2.5<Pi (bar)<8.5, for a stagnation temperature of ~305 K.
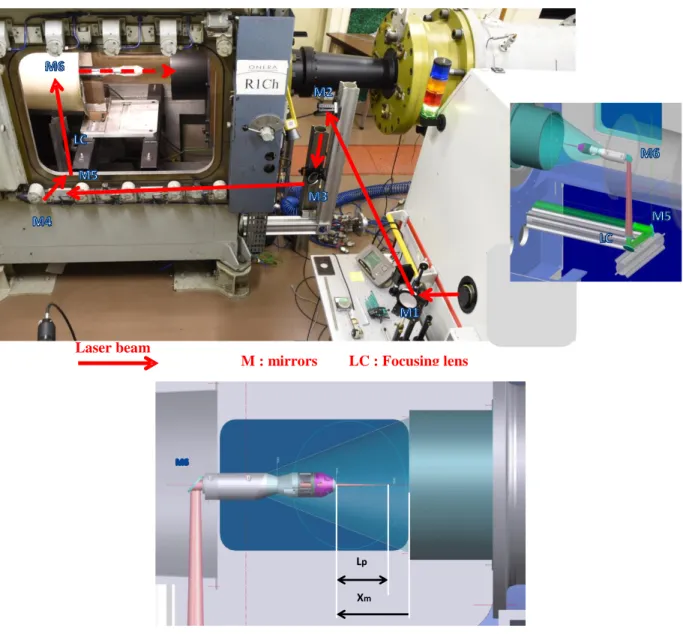
The terawatt laser is placed next to the wind-tunnel test section. The laser beam is guided using 3 inches mirror in the test chamber. After the focusing lens, the beam is guided inside the test model holding sting and emerges from a diaphragm at the tip of the model.
B. Test model
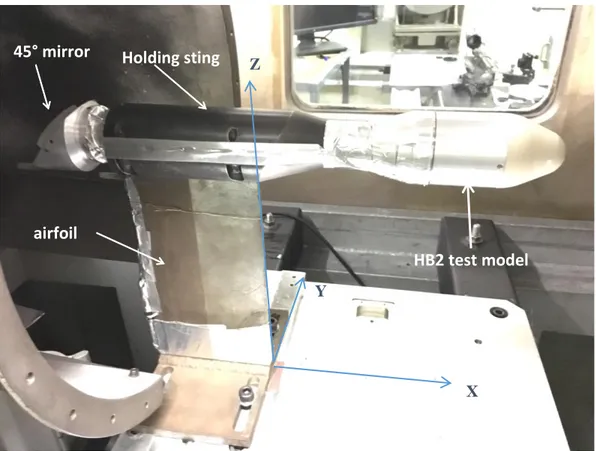
The test model is a generic blunted body (HB2 shape[24]) which is a blunted cone (50° apex angle) with a base section of 60-mm in diameter (Figure 2). The nose of the model is hemispheric (radius 18 mm). As discussed above, the model is hollowed to provide an optical path for the laser beam. The tip of the model has a 3-mm diaphragm that provides the exit path for the focusing beam, as shown in Figure 3.
C. Laser system
The EnstaMobile system is a research TW laser which can deliver laser pulses with a duration as low as 50 fs. Its center wavelength is 800 nm and its maximum pulse energy measured at the tip of the test model is 150 mJ. The laser operates with a repetition frequency of 10 Hz. The laser master clock at 10 Hz defines the time reference for the synchronization of all the diagnostics used in the study. A fast photodiode is used to time the laser pulse.
The ultra-short laser pulse is focused with a lens and forms a plasma filament near the focal point of the lens [19], [25]. The location of the filament core in front of the model can be displaced by moving the focusing lens L
D. Drag balance
The drag balance is composed of two parts :
a weighted plate that holds the test model
The resulting drag force acting on the weighted plate is measured using three piezoelectric Kistler force sensors (type 9134B) mounted at 120° around the model axis. These sensors measure the axial component of the drag. The overall sensitivity of the balance is 50 N/V.
Figure 1 - Detail of the experimental setup. The top picture shows the R1Ch facility test section and the exit port of the Enstamobile laser. The laser beam path is shown in red. The detail of the injection in the test model is shown in the two detailed CAD views
Laser beam
M : mirrors LC : Focusing lens
Lp
Figure 2 - View of the test model mounted in the R1Ch test section. The coordinate axis in the experiments are shown in blue. The model is located 160 mm downstream of the nozzle exit section.
Figure 3 - Detail of the 3-mm diaphragm at the model nose tip. The dimensions of the diaphragm are shown on the left. The picture on the right shows the nose of the model.
E. Diagnostics
In addition to the internal drag balance, the model is fitted with two high-bandwidth pressures gauges (PCB 132A31). Their quoted bandwith is 500 kHz.
The flow topology is characterized using a pulsed Schlieren system in a Z-configuration [26]. A pulsed laser diode (Cavitar Smart, central wavelength 688 nm) is used as the point light source (using an emission slit). A narrow
Holding sting
airfoil
HB2 test model
45° mirror
X
Z
Y
12,9mm 3mm 3mmFAUX Hublot Alu FH3C PVA 2017
Pressure sensors Z
bandpass optical filter centered on the laser wavelength is used on the detection side to filter out any stray light emitted by the ultra-short laser pulse, consisting mainly in a broadband emission. The nanosecond laser emits variable-length laser pulses. For this study, 100-ns long pulses are used. This duration is short enough to collect nearly instantaneous snapshots of the flow. The laser pulses are synchronized on the Enstamobile master clock, but with a controlled time delay. Owing the very good repeatability of the laser-flow interaction (see below), it is possible to probe different instants of the phenomena by gradually changing the delay.
III.
Results
A. Energy deposition in quiescent air
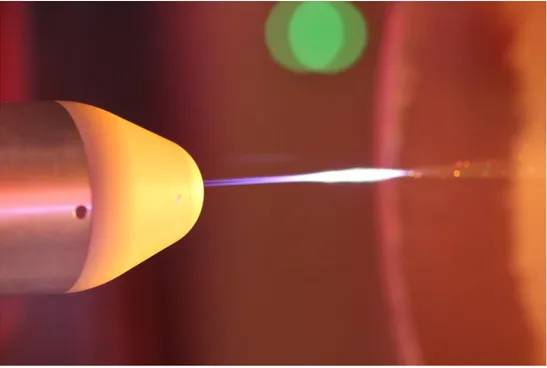
First, the effect of the laser pulses in quiescent air is investigated. This has already been investigated in a laboratory setup [23] using a Mach-Zender interferometer, in particular to measure the number density variations in the gas. Here, the goal is to check the location of the laser-induced quasi-linear energy deposition in front of the test model. The cumulated emission of several tens of laser pulses is shown in Figure 4.
Figure 4 – Long-exposure (4 s) image showing the cumulated emission of 40 laser pulses (50 fs, ~ 150 mJ/ pulse) in quiescent air.
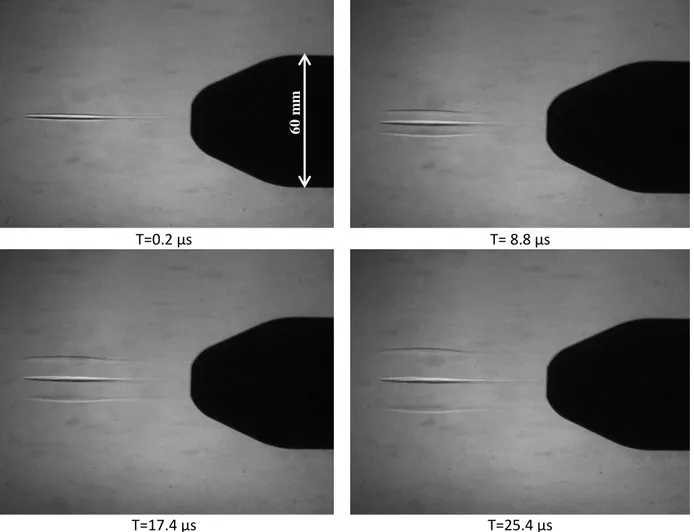
The Schlieren images in Figure 5 show that the laser-induced plasma filament initially forms a central heated core (length ~60 mm). The plasma filament formed by the laser heats a column of gas. Compared to the characteristic timescale of the flow, this heating is nearly instantaneous. This causes a significant pressure rise in the heated core. The high-pressure relaxes in a quasi-cylindrical blast wave that expands radially (T= 8.8 µs and later). The heated channel relaxation is then driven by thermal conduction and natural convection, but with a much longer timescale (~ a few ms). The maximum diameter of the heated core is 5 mm, which is consistent with previous findings in a laboratory experiment [23].
T=0.2 µs
T= 8.8 µs
T=17.4 µs
T=25.4 µs
Figure 5 -Schlieren picture of the filamentary energy deposition upstream of the blunt body in quiescent air (ambient temperature, atmospheric pressure)
B. Energy deposition in a supersonic flow
When the test model is in the supersonic airflow, the activation of the ultra-short laser pulses induces a significant perturbation of the flow.
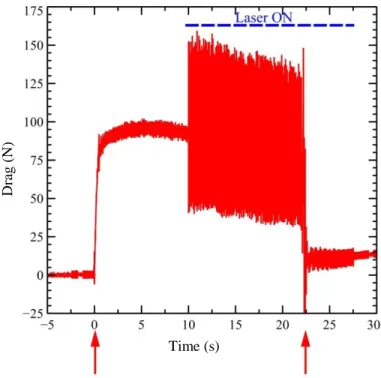
First, the drag balance signal shows that the laser-induced energy deposition cause significant fluctuations in the drag, as shown in Figure 6. The time evolution of the balance signal is typical of the results obtained for a variety of experimental conditions. First, one notices a slight increase of the drag, between 100 µs and 170 µs after the laser pulse. Then, the drag signal decreases sharply and then evolves roughly as a damped oscillator for 1-2 milliseconds. This behavior is entirely correlated to the laser activation, as shown in Figure 7.
6
0
m
The interaction of the heated channel created by the ultra-short laser pulse with the supersonic airflow is investigated for the test run 1632, typical of the results obtained in this study. The flow conditions for this run are given in Table 1. The laser operating conditions are given in Table 2.
Table 1- Test run 1632 flow conditions.
Mach number
3,0
Stagnation Pressure (Pa)
3,61 × 10
5Stagnation Temperature (K)
309
Freestream pressure (Pa)
9 826
Freestream temperature (K)
110
Freestream gas density (kg. m
−3)
0,31
Unit Reynolds number (m
-1)
2,56 × 10
7Freestream flow velocity (m.s
-1)
631
Table 2 Laser operation parameters, test run 1632.
Pulse energy ( laser output port) (mJ)
170 ± 10
Focal length of focusing lens (mm)
1500
Approximate length of the energy depostion (mm)
55 ± 2
Distance of the heated channel center to the nosetip (mm)
25 ± 2
The laser pulse is generated every 100 ms (10 Hz repetition rate). During the whole test run, the signals from the drag balance and pressure sensors are recorded using a fast data acquisition system (2.5 Msamples / s). The Schlieren setup is used to recover the time evolution of the interaction. By changing progressively the time delay between the femtosecond pulse and the nanosecond laser pulse used to probe the flow, it is possible to recover the
Time (s) Dr ag co ef ficie n t C x ( 1 ) Dr ag ( N)
Figure 7 – Sample drag signal (test run 1632). The time axis is referenced to the laser pulse activation (dashed red line).
Time (s)
Dr
ag
(N
)
Figure 6 – Drag signal versus time (Test run 1628). The test starts at t=0. The laser is off for t=0 to t=10 s. It is turned on (operating at 10 Hz) at t=10s until t=27 s. For each subsequent laser pulse, the drag signal exhibits an oscillating behavior similar to the one in Figure 7.
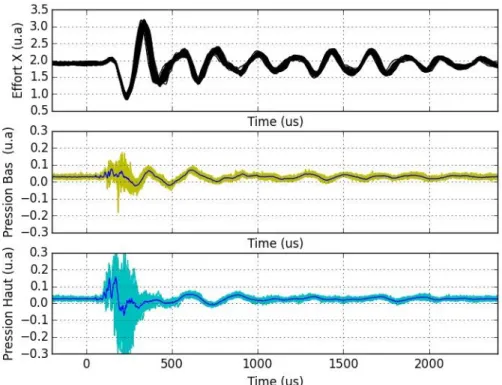
time evolution of the interaction with a good temporal resolution. This is possible because of the very good shot-to-shop repeatability of the phenomenon, as shown in Figure 8. The drag signal is very repeatable. The dispersion is greater for the unsteady pressure probes. This is caused by the turbulent pressure fluctuation during the interaction. The repeatability is further checked by set a fixed delay for the Schlieren laser pulse and checking that the flow features remains nearly unchanged.
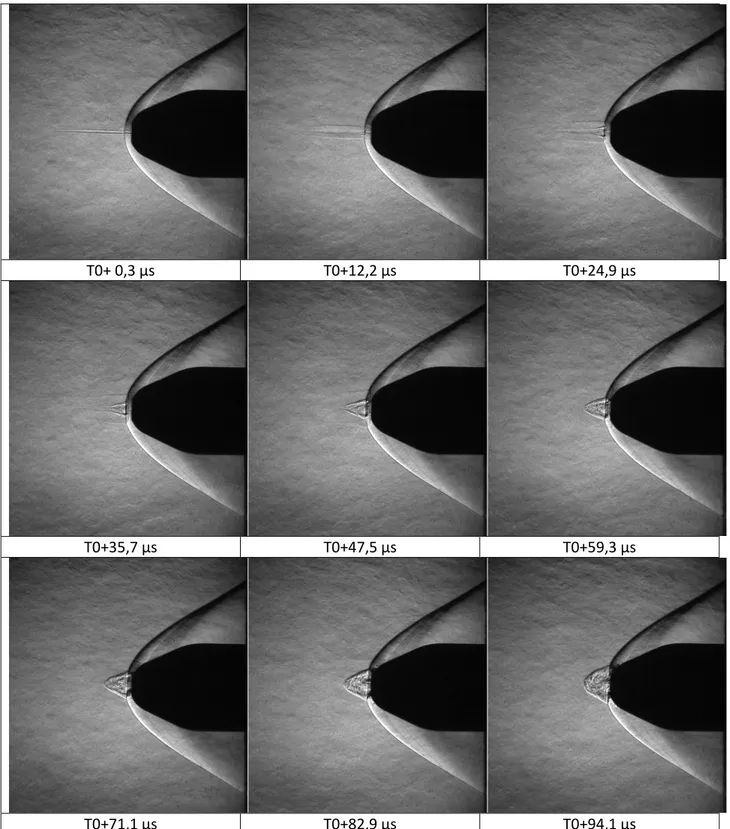
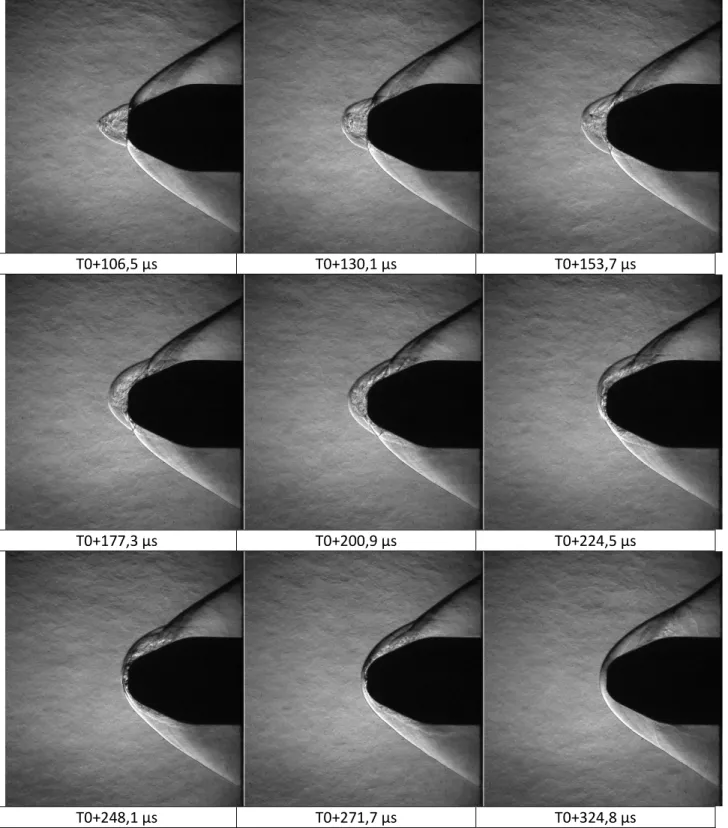
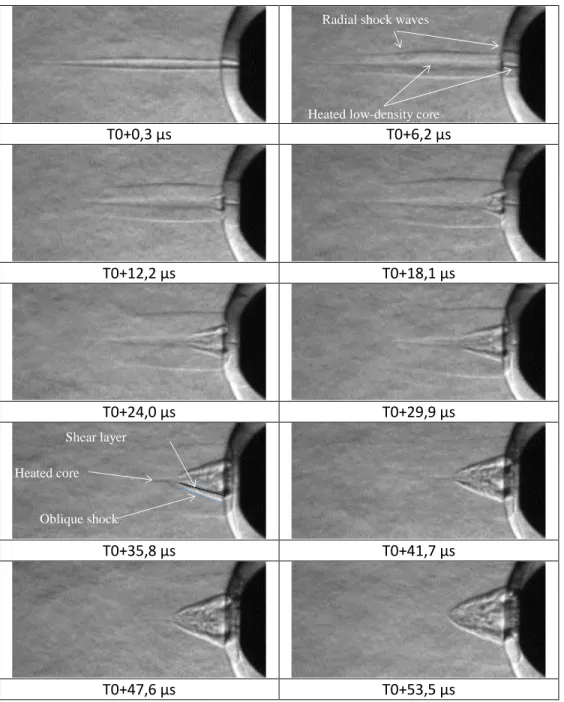
Figure 9 and Figure 10 present the different phases of the interaction. First the formation of the heated channel and the cylindrical blast wave is observed (T0+0.3 µs to T0+8.9µs), as in the tests in quiescent air (Figure 5). These features are also revealed in the zoomed viewed in Figure 11. The heated core is convected downstream and interacts with the detached bow shock. Because of the high temperature in the heated core, the flow becomes locally subsonic and enables the formation of a recirculating bubble expanding upstream from T0+4.6 µs to T0+35.7 µs in Figure 9 and Figure 11. Then the recirculating bubble expands radially between T0+60.5 µs and T0+112.1 µs (Figure 9 et Figure 10), and is convected downstream by the flow. One should note that, during this phase, the recirculating flow is probably turbulent. In addition, during the convection downstream of the bubble, the flow becomes unstable and no longer axisymmetric. The flow recovers its initial configuration approximately 250 µs after the laser energy deposition.
Figure 8- Drag (top), lower pressure (middle) and upper pressure (bottom) signals versus time for 30 laser pulses. The time scale reference is the given by the fast photodiode measuring the ultra-short laser pulse. For the pressure signals, the blue curve is the mean of the 30 sampled signals.
T0+ 0,3 µs
T0+12,2 µs
T0+24,9 µs
T0+35,7 µs
T0+47,5 µs
T0+59,3 µs
T0+71,1 µs
T0+82,9 µs
T0+94,1 µs
T0+106,5 µs
T0+130,1 µs
T0+153,7 µs
T0+177,3 µs
T0+200,9 µs
T0+224,5 µs
T0+248,1 µs
T0+271,7 µs
T0+324,8 µs
T0+0,3 µs
T0+6,2 µs
T0+12,2 µs
T0+18,1 µs
T0+24,0 µs
T0+29,9 µs
T0+35,8 µs
T0+41,7 µs
T0+47,6 µs
T0+53,5 µs
Figure 11- Detailed view of the interaction zone between the heated channel and the bow shock.
Heated low-density core Radial shock waves
Oblique shock Shear layer Heated core
IV.
Simulation
The previous works on line energy deposition were only theoretical due to the lack of experimental data. The observations reported above a first set of data points needed to perform a representative simulation.
A. Simulation details
The numerical simulation of the laser energy deposition is done for the conditions of the test run 1632 whose conditions are given in Table 1. The ONERA compressible flow solver CEDRE[27]is used for this purpose. Since most of the interaction shows a cylindrical symmetry, 2D axisymmetric simulation are considered.
Despite the high Reynolds number of the flow, the flow is supposed to be laminar. The mesh is refined near the wall and at the location of the energy deposition such as the first cell thickness corresponds to a dimensionless wall distance 𝑦+∼ 2 − 4.
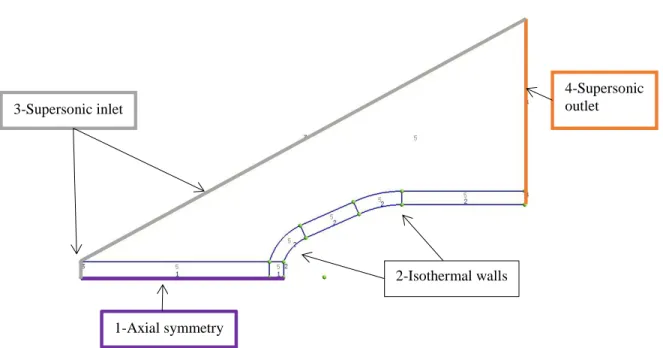
Figure 12 shows the computational domain used for this simulation. The mesh near the wall and at the location of the energy deposition has refined structured patches to improve the spatial resolution. The flow solver is second order accurate in space and time, using an implicit Runge-Kutta time integration. The eulerian fluxes are computed using a hybrid HLLC scheme [28].
Figure 12 - Domaine de calcul. Les zones de maillage quadrangulaires sont discrétisées à l’aide d’un maillage structuré.
The laser energy deposition is modeled as a source term in the energy transport equation. The source is modulated in space and time :
𝜎(𝑥, 𝑟, 𝑡) = 𝜎
0𝐻
𝑇(𝑡)𝑓(𝑟)𝑔(𝑥)
(1)
Here, 𝜎0 is the source term amplitude in W.m-3, 𝑓(𝑟) is the radial modulation, 𝑔(𝑥) is the axial modulation and 𝐻𝑇(𝑡) is a gate function of duration T. Note that the actual duration of the laser energy deposition is around T~ 100-200 fs, while for the simulation the energy deposition duration it T=50 ns. This difference is needed to avoid unpractical timesteps for the simulation. For the given level of energy, we check that the simulated temperature rise
3-Supersonic inlet
4-Supersonic outlet
1-Axial symmetry
and pressure rise in the heated channel is independant of T as long as 𝑇 ≪ 𝜏𝐹𝑙𝑜𝑤, where 𝜏𝐹𝑙𝑜𝑤 is a characteristic time of the flow (~ 1 µs).
The amount of energy 𝐸0 deposited in the flow is given by a spatial and temporal integration of the source term:
𝐸
0= 𝜎
0𝑇 ∫ 2𝜋𝑟𝑓(𝑟)𝑑𝑟
∞ 0∫ 𝑔(𝑥)𝑑𝑥
∞ −∞(2)
For this study, the spatial modulations are Gaussian functions, parametrized by their full width at half maximum (FWHM) : 𝑓(𝑟) = exp (−(𝐹𝑊𝐻𝑀𝑟2 𝑟)24 𝑙𝑛(2)) 𝑔(𝑥) = exp (− 𝑥2 (𝐹𝑊𝐻𝑀𝑥)24 𝑙𝑛(2)) ∫ 2𝜋𝑟𝑓(𝑟)𝑑𝑟 0∞ =4 ln(2)𝜋 𝐹𝑊𝐻𝑀𝑟2 ∫ 𝑔(𝑥)𝑑𝑥−∞ ∞ = √𝜋2√ln(2) 𝐹𝑊𝐻𝑀𝑥 With these assumptions the source term amplitude is :
𝜎
0=
𝐸
0𝑇𝑉
(3)
In the above expression, 𝑉 = (4ln (2)𝜋 )
3 2𝐹𝑊𝐻𝑀
𝑟2𝐹𝑊𝐻𝑀𝑥 is the characteristic volume of the energy deposition.
B. Parametric analysis
A parametric analysis is performed by changing the energy 𝐸0, the width and the length of the energy deposition. For each case a comparison is made with the experimental results, as shown in Figure 13. The computed drag is also compared with the drag signal measured experimentally (not shown here). The best agreement is obtained for two sets of parameters, giving a range of deposited energy between 10 mJ and 15 mJ and a full width at half maximum of 20 mm along the axis, and 0.6 mm along the radius.
C. Analysis of the interaction
The good agreement obtained between the simulations and experiments is used to obtain a deeper understanding of the laser-flow interaction. The following figures show the evolution several field quantities during the interaction. The low-density heated core formed by the laser energy deposition appears clearly in Figure 14. The heated core interacts with the bow shock and form a detached recirculating bubble that extends upstream along the path of the convected heated core, as shown in Figure 15. This upstream propagation ceases when there is no more heated gas to feed the bubble. At this instant the drag force reach its maximum (approximately 10% increase). The recirculating bubble extends radially (Figure 17) and is subsequently convected downstream by the incoming flow. The pressure on the model nose decreases significantly (Figure 18), which leads to a 50% drop in the total drag on the body. Finally, the flow recovers its initial configuration ((Figure 19). The pressure on the model stagnation point recovers its initial value, and so does the drag.
V.
Conclusion
In this study, the significant effect of femtosecond filaments on a supersonic flow has been experimentally demonstrated. It has been found that the low-energy laser spike (~10 mJ deposited) induces a significant transient reduction of the drag. This reduction has been quantified. Finally, these experimental findings have been simulated numerically. It is shown that the plasma filament created by the ultra-short laser pulse forms a low-density heated core that interacts with the detach bow shock. This interaction produces an inflating recirculating bubble and leads to a transient reduction of the drag.
The observations reported here demonstrate the potential interest of ultra-short laser for flow control applications. Further work will have to address the effect of repetitive laser pulses to obtain a quasi-steady effect on the flow.
Acknowledgments
This study has been partly funded by the DGA (“Délégation Générale à l’Armement”) through the ANR ASTRID project ANR-00008-015-001. PQ Elias acknowledges the support of Y. Doutreleau during the course of this project.
References
[1] Y. F. Kolesnichenko et al., “Basics in Beamed MW Energy Deposition for Flow / Flight Control,” in 42nd Aerospace
Sciencs Exhibit and Meeting, 2004, no. January, pp. 2004–669.
[2] V. A. Lashkov et al., “Gas Dynamic Effect of Microwave Discharge on Supersonic Cone-shaped bodies,” in 42nd
Aerospace Sciencs Exhibit and Meeting, 2004, pp. 2004–671.
[3] D. D. Knight, O. a Azarova, and Y. F. Kolesnichenko, “On Details of Flow Control via Characteristics and Location of Microwave Filament During Its Interaction with Supersonic Blunt Body,” in 47th AIAA Aerospace Science Meeting, 2009, pp. 2009–847.
[4] K. Kourtzanidis, J. P. Boeuf, and F. Rogier, “Three dimensional simulations of pattern formation during high-pressure, freely localized microwave breakdown in air,” Phys. Plasmas, vol. 21, no. 12, 2014.
[5] K. Kourtzanidis, F. Rogier, and J. P. Boeuf, “Gas heating effects on the formation and propagation of a microwave streamer in air,” J. Appl. Phys., vol. 118, no. 10, 2015.
[6] H. Yan, R. Adelgren, and M. Boguszko, “Laser energy deposition in quiescent air,” AIAA J., vol. 41, no. 10, pp. 1988– 1995, 2003.
[7] H. Yan, “Control of Edney IV Interaction by Energy Pulse,” AIAA J., vol. 43, no. January, pp. 9–12, 2006.
[8] D. Knight, G. Elliott, G. Candler, and A. Zheltovodov, “Localized Flow Control in High Speed flows using laser energy deposition,” CCD 2003-25, 2003.
[9] T. Sakai, Y. Sekiya, M. Rosli, A. Matsuda, and A. Sasoh, “Unsteady Interaction of Blunt Bodies With Laser Induced Plasma in A Supersonic Flow,” in 39th Plasmadynamics and Lasers Conference, 2008, no. AIAA 2008-3794.
[10] A. Sasoh, Y. Sekiya, T. Sakai, J.-H. Kim, and A. Matsuda, “Supersonic Drag Reduction with Repetitive Laser Pulses Through a Blunt Body,” AIAA J., vol. 48, no. 12, pp. 2811–2817, Dec. 2010.
[11] S. Ghosh and K. Mahesh, “Numerical simulation of the fluid dynamic effects of laser energy deposition in air,” J. Fluid
Mech., vol. 605, pp. 329–354, May 2008.
[12] R. G. Adelgren, H. Yan, G. S. Elliott, D. D. Knight, T. J. Beutner, and a. a. Zheltovodov, “Control of Edney IV Interaction by Pulsed Laser Energy Deposition,” AIAA J., vol. 43, no. 2, pp. 256–269, 2005.
[13] L. Yang, E. Erdem, and K. Kontis, “Single Pulse Laser Energy Deposition in Quiescent Air and Hypersonic Flows,” in
18th AIAA/2AF International Space Planes and Hypersonic Systems and Technologies Conference, 2012, no.
September, pp. 1–18.
[14] H. S. Pham, T. Shoda, T. Tamba, A. Iwakawa, and A. Sasoh, “Impacts of Laser Energy Deposition on Flow Instability over Double-Cone Model,” AIAA J., vol. 55, no. 9, pp. 2992–3000, 2017.
[15] K. Kremeyer, K. Sebastian, and C.-W. Shu, “Computational Study of Shock Mitigation and Drag Reduction by Pulsed Energy Lines,” AIAA J., vol. 44, no. 8, pp. 1720–1731, 2006.
[16] K. Anderson and D. D. Knight, “Interaction of heated filaments with a blunt cylinder in supersonic flow,” Shock Waves, vol. 21, no. 2, pp. 149–161, Feb. 2011.
[17] M. Golbabaei-Asl and D. D. Knight, “Numerical characterization of high-temperature filament interaction with blunt cylinder at Mach 3,” Shock Waves, vol. 24, no. 2, pp. 123–138, Aug. 2013.
[18] P. Elias, “Numerical Simulations on the Effect and Efficiency of Long Linear Energy Deposition Ahead of a Supersonic Blunt Body : Toward a Laser Spike,” Aerosp. Lab J., no. 10, pp. 1–11, 2015.
[19] A. Couairon and A. Mysyrowicz, “Femtosecond filamentation in air,” Prog. Ultrafast Intense Laser Sci., vol. 84, pp. 235–258, 2006.
[20] A. Couairon and A. Mysyrowicz, “Femtosecond filamentation in transparent media,” Phys. Rep., vol. 441, no. 2–4, pp. 47–189, 2007.
[21] B. Zhou et al., “Revival of femtosecond laser plasma filaments in air by a nanosecond laser,” Opt. Express, vol. 17, no. 14, pp. 11450–11456, 2009.
[22] J. B. Michael, a. Dogariu, M. N. Shneider, and R. B. Miles, “Subcritical microwave coupling to femtosecond and picosecond laser ionization for localized, multipoint ignition of methane/air mixtures,” J. Appl. Phys., vol. 108, no. 9, p. 93308, 2010.
[23] G. Point, E. Thouin, A. Mysyrowicz, and A. Houard, “Energy deposition from focused terawatt laser pulses in air undergoing multifilamentation,” Opt. Express, vol. 24, no. 6, p. 6271, 2016.
[24] R. Cérésuela, “Mesure d’efforts et de pression sur la maquette balistique étalon HB2,” 1964.
[25] M. Durand et al., “Kilometer range filamentation,” Opt. Express, vol. 21, no. 22, p. 26836, Nov. 2013.
[26] G. S. Settles, Schlieren and Shadowgraph Techniques: Visualizing Phenomena in Transparent Media. Springer, 2001. [27] A. Refloch, B. Courbet, A. Murrone, P. Villedieu, and C. Laurent, “CEDRE software,” Aerosp. Lab J., no. 2, pp. 1–10,
[28] E. F. Toro, M. Spruce, and W. Speares, “Restoration of the contact surface in the HLL-Riemann solver,” Shock Waves, vol. 4, no. 1, pp. 25–34, 1994.
Figure 13- Comparaison between the experiments and. The blue lines mark the positions of the flow structures on the experiments. The columns correspond to three different times.
Run 12 Run 19 T=12,2 µs T=65,2 µs T=82,9 µs Run 04
Figure 14- Density (upper left), temperature (upper right), Mach (lower left) and pressure fields at t=6 µs.
Figure 16- Density (upper left), temperature (upper right), Mach (lower left) and pressure fields at t=65 µs.
Figure 18 - Density (upper left), temperature (upper right), Mach (lower left) and pressure fields at t=149 µs.