HAL Id: hal-01529609
https://hal.archives-ouvertes.fr/hal-01529609
Submitted on 2 Jun 2017
HAL is a multi-disciplinary open access
archive for the deposit and dissemination of
sci-entific research documents, whether they are
pub-lished or not. The documents may come from
teaching and research institutions in France or
abroad, or from public or private research centers.
L’archive ouverte pluridisciplinaire HAL, est
destinée au dépôt et à la diffusion de documents
scientifiques de niveau recherche, publiés ou non,
émanant des établissements d’enseignement et de
recherche français ou étrangers, des laboratoires
publics ou privés.
Using the 3-point bending method to study failure
initiation in epoxide-aluminum joints
Jean-Baptiste Sauvage, Maëlenn Aufray, Jean-Pierre Jeandrau, Pierre
Chalandon, Dominique Poquillon, Michel Nardin
To cite this version:
Jean-Baptiste Sauvage, Maëlenn Aufray, Jean-Pierre Jeandrau, Pierre Chalandon, Dominique
Poquillon, et al..
Using the 3-point bending method to study failure initiation in
epoxide-aluminum joints. International Journal of Adhesion and Adhesives, Elsevier, 2017, 75, pp.181-189.
�10.1016/j.ijadhadh.2017.03.011�. �hal-01529609�
Open Archive TOULOUSE Archive Ouverte (OATAO)
OATAO is an open access repository that collects the work of Toulouse researchers and
makes it freely available over the web where possible.
This is an author-deposited version published in :
http://oatao.univ-toulouse.fr/
Eprints ID : 17849
To link to this article : DOI:10.1016/j.ijadhadh.2017.03.011
URL :
http://dx.doi.org/10.1016/j.ijadhadh.2017.03.011
To cite this version : Sauvage, Jean-Baptiste and Aufray, Maëlenn and
Jeandrau, Jean-Pierre and Chalandon, Pierre and Poquillon,
Dominique and Nardin, Michel Using the 3-point bending method to
study failure initiation in epoxide-aluminum joints. (2017)
International Journal of Adhesion and Adhesives, vol. 75. pp. 181-189.
ISSN 0143-7496
Any correspondence concerning this service should be sent to the repository
administrator:
[email protected]
Using the 3-point bending method to study failure initiation in
epoxide-aluminum joints
Jean-Baptiste Sauvage
a,b, Maëlenn Aufray
a,⁎, Jean-Pierre Jeandrau
c, Pierre Chalandon
c,
Dominique Poquillon
a, Michel Nardin
baCIRIMAT, Université de Toulouse, 4 allée Émile Monso, 31 030 Toulouse, France
bIS2M (CNRS-UMR7361), Université de Haute Alsace, 15 rue Jean Starcky, 68 057 Mulhouse, France cCETIM, 7, rue de la Presse, 42 952 Saint-Étienne, France
Keywords: A. Epoxides
B. Aluminum and alloys C. Destructive testing D. Interfaces 3-point bending test
A B S T R A C T
The increasing use of adhesives in industry has boosted the search for tests which allow the adherence level to be defined. These tests, depending on the type of load, examine different stresses, failure modes and mixed modes. Furthermore, these tests can be focused either on initiation or propagation of adhesive failure. The subject of this study is the initiation of adhesive failure. The initiation of failure can be determined with the 3-point bending test. Trials of 3-point bending tests were conducted on an aluminum 2024 substrate, with two different thicknesses, in order to understand the impact of the adherend thickness. The aluminum substrate received different types of surface pre-treatment: acetone cleaning, hydrochloric acid etching or aminopropyltriethox-ysilane coating. Two adhesives were used: thefirst one was a mixture of epoxy pre-polymer DGEBA and DETA amine, whereas the second was a commercially formulated adhesive, ELECOLIT 6604. The initiation of adhesive failure was obtained by 3-point bending test and verified with SEM analysis. The failure loads measured enabled the effect of surface treatment on adhesive failure to be revealed: the results indicate that the surface treatment with silane is the most efficient in comparison to hydrochloric acid etching and of course to the simple acetone degreasing. It was assumed that the scatter of the results obtained for each series is due to the variation of the “intrinsic” adherence between the adhesive and the substrate. Furthermore, it was noted that the failure loads for different substrate thicknesses cannot be compared due to the effect of the thickness: it was therefore not possible to simply compare results obtained for different thicknesses of the same substrate for a given substrate-adhesive system. The energy approach proposed in this study makes it possible. The energy requested to initiate the adhesive failure for a given system can then be known, whatever the initial geometry of the 3-point bending test is. However, it was also shown that the thickness of the substrate must be correctly chosen. A thick substrate increases the dispersion and a thin substrate may induce local unwelcome plastic strain. In conclusion, this study allows to define an energy criteria for adhesives failure initiation.
1. Introduction
Bonding is an assembly method widely used in nautical and aeronautical industries, as well as in car manufacturing and construc-tion [1–5]. However, the adhesion between an adhesive and the substrate is yet to be fully understood: this lack of understanding continues to be a major obstacle to the use of adhesive bonding technology in critical systems.
On the one hand, the industry is determined to be able to replace mechanical assemblies with adhesive-bonded ones in order to lighten the structures and on the other hand mixed assemblies (screwed/ adhesive-bonded) have been developed and studied[6]. Whatever the
chosen (bonded or mixed structures) is, a wide range of tests has been developed in view of providing tools for measuring the adherence of adhesives. Each test has several objectives: to overcome the short-comings of others (parasite stress, edge effects), to introduce new load types (single mode or mixed modes), to test thin films or complete bonded structures, etc.[7–9], with the view of obtaining a criterion which allows the adhesion to be defined. This determination can be carried out in two ways: by initiating an adhesive failure or by propagating adhesive failure. However, failure initiation has not been studied much since both its nature (adhesive or cohesive) and its location remain difficult to determine[10].
In an adhesively bonded joint, three major modes of failure exist: a
⁎Corresponding author.
E-mail address:[email protected](M. Aufray).
cohesive failure within the adhesive layer, which corresponds to the ultimate strength of the adhesive itself and an adhesive failure when the adherence between the adhesive and the substrate is weaker than the cohesive strength of the adhesive. The third one is a cohesive failure within the substrate itself and it is very unusual when the substrate is metallic.
The objective of this work is to characterise the adherence between the adhesive and the substrate surface, when it is weaker than the cohesion of the adhesive itself, leading to an adhesive failure. Most of tests found in literature are based on fracture mechanics or crack propagation in the mode I, II and III, for both adhesive and cohesive failure characterisation. Our objective is to evaluate a test procedure which enables us to determine and localise the initiation of the adhesive failure.
In industry, the tests which are widely used to characterise adherence are the butt joint (pull-off) and the single lap shear (ISO 6 922:1987 and ISO 4 587:2003 respectively) as well as their variations. The results of these tests are used to compare bonded specimens when exposed to tensile and shear stress. However, the single lap shear test exhibits a complex, three-dimensional state of stress distribution which is difficult to model[11–13]. Similar observations were made with the butt joint. Furthermore, the location of the failure initiation is difficult to establish in the two tests [5,10]. The ARCAN test was initially designed for composites, in view of obtaining uniformflat stresses, free of three-dimensional parasite stress[14]. The test was then adapted to structural bonded assemblies in order to study their behaviour when exposed to uniaxial and multiaxial stresses [15,16]. But, as with the previous tests, it does not allow the location of the failure initiation.
The present study is dedicated to the initiation of adhesive failure in order to determine the adherence of epoxy-based adhesives on alumi-num substrates. Consequently, the 3-point bending test was selected because it systematically relies on initiation of adhesive failure initia-tion[17]. The 3-point bending test was developed by Roche et al.[18]
in the 90s and has been standardised[19]. Nevertheless, this test is still dependent on the thickness of the substrate used. Here, aluminum 2024 is used for the purposes of the test (frequently used in aeronautics) in two different thicknesses, with two types of adhesive: the first one is a mixture of pre-polymers, DGEBA (bisphenol A diglycidyl ether) and DETA amine (diethylenetriamine), whereas the second is a formulated polyepoxide, ELECOLIT 6604. Acetone, hydrochloric acid and amino-propyltriethoxysilane were used to pre-treat the substrates. Acid attack can be used to create a new layer of oxide on the aluminum substrate surface[20], whereas silane grafting can be used to create covalent interfacial links to promote the adhesion[21,22].
The objective of this work is to grade systems (adherend/adhesive/ surface treatment) based on results obtained with the 3-point bending test[3]as well as to assess the effects of substrate thickness with this
test. The purpose is to be able to compare the intrinsic adherence of systems, whatever the thicknesses of components are, and also to get a better understanding of the mechanics of this test.
2. Materials and methods 2.1. Materials
The metallic substrate used is laminated aluminum 2024 T3 (bulk composition: Al: 93.5% Cu: 4.5% Mg: 1.5% Mn: 0.5%), 1.6 mm thick, supplied by GOODFELLOW, and 1 mm thick, supplied by KAISER Aluminum. The standard recommendation for 2024 alloy substrates is 1.5 mm.
Two polyepoxide adhesives were used in the study. Thefirst one is a bisphenol A diglycidyl ether pre-polymer (DGEBA) referred to as DER332, supplied by DOW chemical, used with diethylenetriamine (DETA) as a hardener, supplied by SIGMA-ALDRICH. The mix of epoxy monomer and amine is made in stoichiometric proportions, calculated based on the functionalities of DETA amine (f=5) and DGEBA epoxy
(f=2). The second one is a single-part epoxy, formulated for industry, referred to as ELECOLIT 6604 (supplied by PANACOL, Germany).
Pure Acetone, hydrochloric acid in a 37% concentration and 3-aminopropyltriethoxysilane (> 99% pure), supplied by SIGMA-ALDRICH, were also used to clean and treat the surface, as described in the following section.
2.2. Samples and preparation
The samples used are dimensioned and manufactured in accordance with ISO 14 679-1997[19], as seen inFig. 1.
They consist of an aluminum plate, with a cube of adhesive on the plate. Aluminum plates are cut using a punch, ensuring that the produced cuttings are of equal dimensions, 50×10 mm ± 0.10 mm, as mentioned in the standard. Three surface treatments were studied for aluminum in order to vary the degree of adhesion:
1. Degreasing: aluminum plates were immersed in an ultrasound acetone bath for 5 minutes then dried in ambient air.
2. Hydrochloric acid (HCl) stripping: aluminum plates which were submitted to degreasing, as described, are then immersed in 3.7% concentrated hydrochloric acid solution for 5 minutes. The plates are then rinsed with de-ionized water and dried in ambient air. 3. Treatment with 3-aminopropyltriethoxysilane (silane): the plates
submitted to the two treatments already described are finally immersed in a 1% silane water solution for 24 h. The plates are then rinsed with de-ionized water and dried at 60 °C.
These treatments were selected based on their quality: acetone degreasing was applied to clean the surface, removing a part of the surface organic pollution, whereas the stripping with hydrochloric acid attacked the oxide surface, creating a new passivation layer[20]and eliminating surface pollution. Finally, silane treatments, which are known for their adhesion promoting qualities, were used to establish genuine covalent bridging between the substrate surface, constituting a hydroxyl group, and the polyepoxides[21,22].
Application of the DGEBA-DETA mix or ELECOLIT is carried out using a 0.5 ml syringe, in conformity with the volume details provided inFig. 1. During the application, particular attention was given to avoid any bubbles in the polymer cube, especially at the substrate/polymer interface. This key point was verified by checking the failure facies after each 3-point bending test. For that purpose, an initial interface wetting with a small amount of the chosen adhesive was carried out before adding the remainder of the 0.5 ml. The parallelepiped form of the adhesive is obtained using a silicone mould designed for this purpose. The parallelepiped shape of adhesive will be simply referred to as “adhesive cube”, or “epoxy block” in the following work. The mould is pressed onto the aluminum plates by clamping two aluminum plates together in accordance with the ISO 14 679-1997 standard (Fig. 2 [19]). The standard recommends the following error in the cube size: L × l × h = (25 ± 0.05) mm × (5 ± 0.05) mm × (4 ± 0.l) mm.
The DGEBA/DETA (two-part) mix is produced manually at room temperature for 5 minutes until homogeneity is achieved, and applied immediately to produce adhesive cubes. The single-component
oxide ELECOLIT is kept at a temperature of approximately 3 °C: in such a state, ELECOLIT is highly viscous and cannot be used to produce adhesive cubes. Consequently, its temperature needs to be raised to 80 °C to reduce viscosity in order to produce adhesive cubes. The curing cycle of polyepoxides is illustrated in Fig. 3. The cooling rate is low enough to avoid any thermal stress. Residual stresses exist. They are considered to be the same for all the studied surface treatments. The formed thermosets have onset glass transition temperature of 115 °C and 136 °C for the ELECOLIT and DGEBA/DETA respectively. Their measured Young's moduli are 1.8 GPa and 3 GPa respectively. It should be noted that the curing cycle of the DGEBA/DETA polyepoxide begins with 3 h at room temperature, allowing for the creation of a reprodu-cible interphase[23,24], with its own glass transition temperature and Young's modulus. This interphase has its own adherence (which is our measured adherence). However, as the volume of this interphase is far smaller than 10% of the volume of the polymer cube, the modification of its mechanical properties (Young's modulus) won’t be taken into account in the calculations of Section 3. Series of 12 samples were realized whereas the standard recommendation is at least 6 samples.
2.3. Instrumentation
Mechanical testing was conducted using an INSTRON tensile machine (model 3367, INSTRON SA, Buc, France, Fig. 4) equipped with a 3-point bending system and a 500 N load sensor, with an error margin of ± 0.1 N. The distance between supporting pins is 35 mm and the speed of test is 0.5 mm/min: when displacement is enforced, the response in force is measured. The standard prescribes a distance of 33 mm between supporting pins; however, this machine has a large
bending radius (seeFig. 4(b)), which makes it impossible to carry out tests with this distance between supporting pins. Force/displacement curves are recorded using the BLUEHILL software (from INSTRON).
However, as the measured distances were very small (lower than 500 µm), the machine displacement does not completely match the actual accurate displacement of the samples, due to the stiffness of the machine, and load cell bending. In order to measure the actual displacement, an optical monitoring system was set up: it consists of a CANON EOS 7D® camera fitted with a macro lens MP-E 65 mm (Fig. 4(a)). A white speck was placed on a black background on the side of the samples, creating a monitoring point that allows any displace-ment during the testing to be recorded (Fig. 4(c)). A single shot was taken once every three seconds, starting from the beginning of the test. Photographs were then processed with the IMAGEJ software (public domain, Java-based image processing program). Finally, the displace-ment of samples on the photos was correlated with the testing force, creating the force/displacement curves. The error margin for displace-ment measuredisplace-ment using the optical system was estimated to be ± 3 µ m from theFig. 4(c). The standard recommended an error of 1 µm which seems to be impossible to achieve. The error in correlation between the data measured and force was estimated to be 0.3 N, due to possible delay between the start of the tensile test and the beginning of the series of images taken by the camera.
Theflexure measured with the optical system is correlated with the load measured using the machine software (Fig. 5). The measurement error is not indicated on theFig. 5, since it is smaller than the size of a single unit ( ± 0.4 N and ± 3 µm, which cannot be represented on the
Fig. 5), on both the load and the deflection scale. The correctness of the
deflection measurements made using images analyse was checked through the linearity of the resulting curve (r2=0.98).
The Scanning Electron Microscope analyses (SEM) were carried out on a TESCAN device (model: VEGA 3, TESCAN, Czech Republic)
Fig. 2. Preparation of the samples, in accordance with ISO Standard 14679– 1997[19]. 1: Fastening (20 bolts), 2: Fastening plate, 3: Silicone spacer, 4: Adhesive cube (epoxy block), 5: Substrates (Aluminum alloy), 6: Lower plate.
Fig. 3. Curing cycle, solid line: Elecolit; dotted line: DGEBA/DETA.
Fig. 4. Experimental device (a), with a tested sample (b) and the speckle on the edge of the substrate (c).
equipped with BRÜCKER energy-dispersive spectrometry (EDS, model: Xflash detector 410-M, BRÜCKER, Germany). The heater has a 25 kV heating capacity and the samples were not metallized.
Infra-red Spectroscopy (FTIR) Micro-IR maps were made using an FTIR Imaging Spotlight 400 (from PERKIN ELMERTM, Courtaboeuf, France) for the microscope and a FrontierTM spectrometer (from
PERKIN ELMERTM, Courtaboeuf, France.) Imaging mode was used
and the resolution was 6.25 mm pixel size. Infra-red spectra were recorded in the 4000–7800 cm−1range using a Dual mode Detector
that is near infra-red with 16 scans. 3. Results and discussions
3.1. Post-mortem analysis of the samples
According to the ISO standard, the trend of the testing curve should have the following profile:
•
An increase in the load.•
A drop in the load, indicating adherence failure.•
A return of the load to the curve, indicating only the substrate. Return behaviour may vary, depending on the failure propagation. Thefirst step is a linear increase up to point A (failure initiation). The failure propagation is very fast and after the complete de-adhesion (point C), the deflection obtained for a given load is the same than those obtained with the substrate alone. The slope of thefirst part of the curve will be discussed inSection 3.2.Thefirst part of the experiment consisted of verifying the consis-tence of this profile with the samples.Fig. 6shows the curves for one sample and the substrate alone. The increase in load is applied until adherence failure is reached in point A (Fig. 6), and then a failure propagation to zone B. Let us note that all the samples presented in this work show this kind of load/deflection curve.
On the deflection curve, the drop in load which allows a return to the curve of solely the substrate coincides with the moment when the adhesive cube is coming off. This drop in load corresponds to the force necessary to obtain an adhesive failure and the deformation of the adhesive cube. The linearity of the sample curve (solid line on the
Fig. 6) indicates that the elastic yield of the sample is not reached (i.e. both substrate and polymer cube remain elastic). This point was verified by measuring the two parts after crack propagation, as they come back to their original shape. Furthermore, the immediate return to the substrate curve (i.e. points A and C have the same deflection value) indicates that the failure propagation occurs immediately after the initiation. The propagation could be adhesive, cohesive or mixed, depending on the adhesive and its adhesive strength. In this work, it was always adhesive and it is an important characteristic of these
3-point bending tests: adhesive initiation failure was observed on all samples. For the initiation and propagation of the failure on samples with acetone surface treatment, either way the failure is strictly adhesive and it is not possible to distinguish initiation and propagation. For the other surface treatments, all the samples show a circle without adhesive (see the example onFig. 7).
This circle is always at one end of the block of adhesive. All the circles were measured (when possible, i.e. for HCl and silane surface treatment): their average size was about 0.6 ± 0.2 mm2.
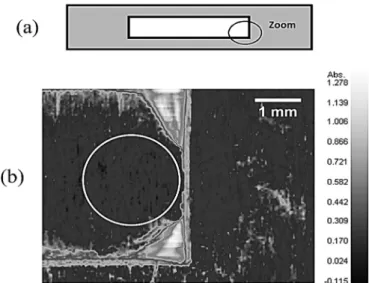
The initiation area was examined with a transformed Fourier infra-red microscope, on a DGEBA/DETA adhesive, silane treatment and substrate thickness 1 mm (Fig. 8). For simplicity, only the total infra-red absorbance map is represented. The substrate covered by the silane treatment area was recorded as background. According to the scale on the right side of theFig. 8(b), the total absorbance is equal to zero when the area is similar to the background area (i.e. without any adhesive layer). In other words, the dark areas represent the substrate with silane treatment. The light area represents the adhesive. It shows clearly that the failure initiation is adhesive (absence of adhesive on the surface of the substrate). The spectra didn’t show any adhesive on the initiation surface (represented by the white circle).
Analysis of the adhesive failure initiation has been made also with SEM and EDS on the same sample and was compared with the substrate
Fig. 6. Characteristic curve of the test: sample (thickness 1.6 mm with DGEBA/DETA) and substrate (aluminum 2024).
Fig. 7. Localization (b) of failure initiation adhesive on the sample (a) with DGEBA/DETA adhesive and substrate thickness 1.6 mm.
Fig. 8. Infra-red map of total absorbance (range 4000–7800 cm-1) (b) of adhesive failure
initiation (circle white) on the sample (a) with DGEBA/DETA adhesive, silane treatment and substrate thickness 1 mm.
area containing no adhesive. InFig. 9, the adhesive failure initiation is surrounded by a white dotted circle. On the left, the picture shows the sample with the back-scattered electrons (BSE) and, on the right, with the secondary electrons (SE). On those pictures, no adhesive can be detected: the observations of the surface in this circular area was similar to the ones achieved on the substrate, where no polymer had been glued. Furthermore, an EDS mapping of the adhesive failure initiation area was realized: the Fig. 11 and the Fig. 10 show the distribution of aluminum and carbon elements on the surface, respec-tively.
On the Fig. 11, the adhesive failure initiation doesn’t show the presence of the any residue of adhesive but only aluminum (same intensity of aluminum peak than outside the area where was the former epoxy blocks). Moreover, the adhesive failure initiation area doesn’t show the element Carbon compared to the adhesive (on the corners of the block), which contains a lot of carbon. The tests do not show adhesive residues but only the substrate signal, as already observed by Bouchet and Roche[17,25].
All these observations indicate that the information obtained with the normalized 3-point bending test identify adhesive failure initiation rather than its propagation, as mentioned in standard ISO 14679-1997
and verified by Bouchet et al. [26]. Nevertheless, this area is only discernible through contrast, where adherence is relatively high: in the opposite case, the entire failure propagation tends to be adhesive and not discernible at initiation (as previously described in this paper for samples with acetone surface treatment).
3.2. Failure loads results
The results of the study of the test 3-point for different substrate thicknesses are presented in this paragraph.Fig. 12shows the average of the failure loads measured during the 3-point bending tests, on substrates 1 mm thick, with different types of surface treatments and adhesives.
The DGEBA/DETA polyepoxide system showed that different sur-face treatments lead to an increase in the failure load (Fig. 12), from degreasing to HCl etching and then chemical surface modification with silane. This result was expected: the acetone degreasing does not increase the adherence but only prevent the formation in the joint of weak boundary layers. The HCl chemical etching lead to the formation of a new passivation layer[20], increasing the mechanical anchoring. Finally, the silane leads to the formation of chemical bonds[21,22]. The ELECOLIT polyepoxide showed that different surface treatments
Fig. 9. SEM pictures (b) of the adhesive failure initiation of the sample (a). Left SEM pictures with the back-scattered electrons and right with the secondary electrons.
also lead to an increase in the failure load. The same grading of efficiency of different surface treatments as to the involving DEGBA/ DETA polyepoxides can be applied to this system. On the other hand, the DGEBA/DETA system showed lower failure loads than ELECOLIT. It was not possible to conclude here whether the ELECOLIT has a better “intrinsic” adherence on this substrate or not, as it also depends on its Young modulus (and the necessary force to deform the polymer cube). Furthermore, in both systems, the use of silane considerably improves the adherence, which is expected for this type of surface treatment.
Fig. 13shows the average of the failure loads measured in 3-point bending tests for substrates 1.6 mm thick, with different types of surface treatments and adhesives. The observations are the same as with 1 mm thick substrates: the surface treatment with silane is the most efficient, compared with hydrochloric acid etching, and of course with the simple acetone degreasing. The failure loads required for different substrate thicknesses cannot be compared directly: the failure loads for a 1.6 mm thick substrate were higher than for 1 mm, as a part of the failure load is needed to deform the aluminum substrate. Thus, this finding would mean that adherence of an adhesive on a given substrate depends on its thickness, in this test. This key question will be discussed inSection 3.3.
In order to better understand the dispersion in the tests indicated in
Figs. 12 and 13for 1 and 1.6 mm substrate thicknesses, the failure loads (point A, Fig. 6) were plotted against failure deflection for different samples in each series,Figs. 14 and 15 for a thickness of 1 mm, and
Figs. 16 and 17for a thickness of 1.6 mm. On thesefigures, the results obtained with the three types of surface treatment used were plotted on the same curve. It should be recalled that all failure facies were checked and were adhesive ones.
A linear progression of the failure load/flexure couple can be noted inFigs. 14–17: moving along the right, indicated by points of surface treatment, adherence (via failure load) rises linearly with the failure deflection. This was anticipated, since it has already been mentioned that the failure initiation occurs in the area of elastic deformation of the
samples (Fig. 6). Surface treatment with acetone is always indicated on the far left (the weakest adherence), whereas silane surface treatment is on the right part of the curve, indicating the best adherence level obtained with the tests. This was also expected, since silane surface treatment is known to promote adhesion for epoxies.
In order to understand the linear relationship between the load and the deflection on the curve obtained during the bending tests, bending beam equations have been used on both aluminum substrate and epoxy
Fig. 12. Failure load for the polyepoxy system DGEBA/DETA and Elecolit for the 1 mm thick Aluminum substrate.
Fig. 13. Failure load for the polyepoxy system DGEBA/DETA and Elecolit for the 1.6 mm thick Aluminum substrate.
Fig. 14. Distribution of the couple strength/deflection for the polyepoxy DGEBA/DETA for the 1 mm thick substrate.
Fig. 15. Distribution of the couple strength/deflection for the polyepoxy Elecolit for the 1 mm thick substrate.
Fig. 16. Distribution of the couple strength/deflection for the polyepoxy DGEBA/DETA for the 1.6 mm thick substrate.
cube.
Eq.(1)is the equation for a simple beam loaded during a 3-point bending test, where the load F(N) is applied at the centre, d is the deflection, L the distance between supporting pins (mm), E the Young modulus (MPa) and I the second moment of area (mm4). The equation
of the second moment of area is such that I=(bh3)/12 where b is the base (mm) and h the height (mm).
d FL E I = 48. . 3 (1) In the case of the 3-point bending tests of this work, two sets of E, I and L are needed for on sample: one for the substrate and one for the epoxy cube. Each of them does not vary when the same adhesive is used for the same substrate thickness.
Consequently, Eq.(1)can be formulated in the following way (Eq.
(2)):
d = FK (2)
Where K represents a constant ratio (K=L3/48EI). Thus the load and
the deflection are linked and progress in a linear manner: they can be defined as an inalienable couple, which was experimentally proven in
Figs. 14–17.
The dispersion around the linear relations between the load and the deflection can be explained by the variations in adherence or in the shape of the samples. The dispersion along the linear relations between the load and the deflection is due only to the variations of “intrinsic” adherence. These variations are due to the substrate surface hetero-geneity (chemical composition, initial state of “cleanness”…), poor reproducibility of the treatment itself, the application of the adhesive and,finally, to the adhesive itself. In addition, the dispersions arising from the linear relation between the load and the deflection are due to other geometrical factors. These variations can be due to:
•
The silicone mould deforming the adhesive cube.•
Different adhesive cube heights due to a different quantity of adhesive being placed in the mould: a variation of ± 0.3 mm was measured.Finally, dispersions can also be due to measurement errors in the tests, although these measurements were made with a precision of 3 µm for the deflection and 0.3 N for the load.
On the one hand, the variations in the shape of the samples will greatly affect the slope, indicating the rigidity of the sample, particu-larly the height h, which increases the second moment of area to the third power. On the other hand, thefillet between the epoxy cube and the substrate was studied on all samples and measured with a radius of 150 µm ( ± 20 µm). Thus thefillet does not seem to have any influence
on the dispersion of the results.
Finally, by comparingFigs. 15 and 17, it can be noticed that the difference in failure loads for different surface treatments is less visible when the thickness of the substrate is higher. Thus the thickness of the substrate must be correctly chosen: a thick substrate increases the dispersion and a thin substrate may reach locally plastic yield. 3.3. Energy approach
An energy-based approach can also be considered when analysing the results of these tests [18,26]. This work is focused on the experimental results and on the simplified energy approach proposed. The Euler–Bernoulli beam theory is used for this approach as its simplicity makes it an important tool in mechanical engineering. However this theory has, on the one hand, limitations for beams made of a single material (homogeneous beam) and, on the other hand, is not suitable for multi-component beams. For homogeneous beam, it neglects shear stress and it is valid only for infinitesimal strains and small rotations. In this study, the maximum deflection remains very small (250 micrometres for most of the tests when the distance between the two supports is 35 mm). The validity of these assumptions were verified using finite element (FE) calculations. Failure propagation energy is negligible in the presented system because it occurs instanta-neously (Fig. 6andFig. 18). The total is the area under the test curve, calledWtot(calculated using the Eq.(3)) and can be split in three parts:
•
The elastic deformation energy stored in the aluminum substrate due to bending W( al);•
The elastic deformation energy stored in the adhesive block due to bending(Wepoxy);•
The initiation failure energy(Wadh).Fig. 18shows the principle of the energy approach: the total energy (Wtot) and the elastic deformation energy stored in the aluminum due to flexion (Wal) can be easily calculated using the Eq.(3), using the failure force. For this value of the force, the elastic energy of the bended substrate is calculated as well as its deflection (see Fig. 18). The classical beam theory (Eq.(4)) gives the necessary force to bend the epoxy block with the same angle of curvature leading to the value of the elastic deformation energy stored into the adhesive block due toflexion (Wepoxy).
Let us note that the Eq.(3)was corrected, leading to the Eq.(5)in order to take into account the smaller size (width:a) of the epoxy block compared to the distance between supporting pins (L).
W = 1F d 2· · (3) F E I d L = 48· · · epoxy 3 (4)
Fig. 17. Distribution of the couple strength/deflection for the polyepoxy elecolit for the 1.6 mm thick substrate.
Fig. 18. Energy stored into the specimen, split in three parts (elastic deformation stored in the aluminum and in the adhesive block, and the initiation failure energy).
W F d a L = 1 2· · · epoxy epoxy (5) Finally, The initiation failure energy(Wadh)is deduced from the total
energy and the elastic deformation energy stored in the aluminum and epoxy block. Fig. 19shows the energy of adhesion obtained for the DGEBA/DETA adhesive system with three surface treatments and two thicknesses of the substrate. The adherence energy varies with the nature of the surface treatment but is the same for each treatment whatever the substrate thickness.Fig. 20shows the energy of adhesion obtained for the ELECOLIT adhesive system with three surface treat-ments and two thicknesses of the substrate and the same conclusion can be observed: the adherence energy varies with the nature of the surface treatment but is the same for each treatment whatever the substrate thickness is.
The scatter of results seems important as it reaches 20% in some series. Moreover, let us note that the measured initiation energies range between 0.5 and 7 mJ, depending on the surface treatment, which are very low values, difficult to measure. This dispersion, especially with a 1 mm substrate thick, is larger with DGEBA/DETA adhesive than with ELECOLIT.
In order to understand the dispersions, the previous equations and the slopes of the load/deflection curves (Figs. 14–17) were used to calculate the contribution of each element to the total energy.
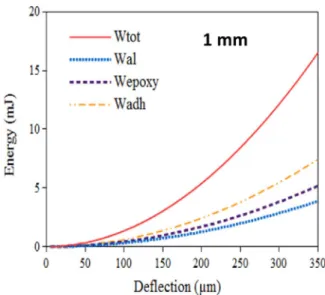
The Figs. 21 and 22 show the energy repartition for 1 mm and 1.6 mm thick substrates, respectively. First of all, it can be seen that a small increase of deflection leads to a big increase of the total energy. The thicker is the substrate, the more sensible is the total energy to a small variation of deflection. It is now possible to explain the dispersion of either failure load or total energy with such a graph. In addition, it can be seen that the part of the energy dedicated to adhesion failure is
the dominant contribution for 1 mm thick substrates whereas it is nearly the smaller part (with the elastic deformation stored in the adhesive block) for 1.6 mm thick substrates. As a conclusion, a thin substrate (but thick enough to stay in its elastic domain) leads to more accurate results for two reasons: small variations in deflection less affect both the total energy and the failure load, and the initiation failure energy (Wadh) is the major part of total energy.
This work was focused on the experimental results and on the simplified energy approach proposed. The Euler–Bernoulli beam theory was used for this approach and its validity under the presented experimental conditions was verified using finite element (FE) calcula-tions. Finite element calculations were performed with Cast3mfinite element code [http://wwwcast3m.cea.fr]. Because of the geometry with two planes of symmetry, the simulation was carried out only on a quarter of the sample meshed with 8 node cubic elements. Both materials were described by an isotropic elastic mechanical behavior with the following data for aluminum substrate: Young's modulus 68 GPa, poisson's ratio 0.33; for DGEBA/DETA: Young's modulus 3 GPa, Poisson's ratio 0.35; for Elecolit: Young's modulus 1.8 GPa, Poisson's ratio 0.35.
Since the theory used in the proposed analytical energy approach is not suited to heterogeneous beams, we depart from its classical use. So, we have compared the values obtained, i.e. the elastic energy values stored in each beam (aluminum and adhesive) with the values calculated byfinite elements. This comparison was achieved for a load corresponding to the average failure load of a given system. We used
Fig. 19. Failure initiation energy (Wadh) with DGEBA/DETA adhesive for the 1.6 mm and
the 1 mm thick substrates.
Fig. 20. Failure initiation energy (Wadh) with ELECOLIT adhesive for the 1.6 mm and the
1 mm thick substrates.
Fig. 21. Distribution of the energy components for 1 mm thick substrates.
the ENER operator of the FE Code that calculates the tensorial product of a stressfield and a strain field. The result is a scalar field standing for energy density. Then, using the operator INTG, we performed the integration of this energy density in the aluminum substrate and in the adhesive block. Significant differences are noted. For example, for the 1.6 mm substrate bent until a 270 µm deflection is reached, by analytical calculation the elastic deformation energy stored in the aluminum substrate is 9.3 mJ, and the elastic deformation energy stored in the DGEBA/DETA adhesive block due to bending is 3.3 mJ. The values obtained using FE simulations are respectively 10.2 mJ and 5.1 mJ. One the one hand, shear stress is more pronounced in the adhesive block and can explain why the Euler–Bernoulli beam theory leads to an underestimate value; on the other hand, the deformation of the constituents of the heterogeneous beam is slightly different of the one of two separated homogeneous beams. In the case described above, as in the other cases calculated, the total energy Wtot is always
underestimated by the simplified analytical approach when compared to a 3D FE simulation. In the case described above, this underestimation was shown to reach 20%. As this value is representative of those found in the other simulations, it indeed does show the limits of the simplified energetic analytical approach proposed. However, one should keep in mind its simplicity compared to the 3D FE calculations.
4. Conclusions
The main advantage of the 3-point bending test is that it ensures initiation of adhesive failure at the adhesive/substrate interface, as it was clearly demonstrated by MEB and micro-infra-red analyses. On the one hand, the initiation of adhesive failure was verified on different systems, with various surface treatments and adhesive formulas. On the other hand, the load in the 3-point bending test depends on the thickness of the substrate. It was therefore not possible to simply compare different thicknesses of the same substrate for a given substrate-adhesive combination, but a new energetic approach led to a separation of the three component of failure energy. It was then possible to compare the adhesive initiation failure energy of systems having various substrate thicknesses.
Analysis of the results of failure load values presented in this study has shown that they are widely dispersed, which can be explained by the differences in adhesive adhesion to the substrate (variation along the straight line) as well as by the difference in the shape of the adhesive cube (variations around the straight line). It was shown that the heights of the polymer cubes are the key parameters in the results dispersion, after adherence.
The study has furthermore shown that, the thinner the substrate, the more accurate the results of the test. The dispersion along the linear relation between force andflexure allows us to distinguish more clearly between different types of surface treatment on thinner substrates. References
[1] Loureiro AL, da Silva LFM, Sato C, Figueiredo MAV. Comparison of the mechanical
behaviour between stiff and flexible adhesive joints for the automotive industry. J Adhes 2010;86(7):765–87.
[2] Valarinho L, Correia JR, Branco FA. Experimental study on theflexural behaviour of multi-span transparent glass–GFRP composite beams. Constr Build Mater 2013;49:1041–53.
[3] Golaz B, Michaud V, Lavanchy S, Månson J-AE. Design and durability of titanium adhesive joints for marine applications. Int J Adhes Adhes 2013;45:150–7. [4] Vietri U, Guadagno L, Raimondo M, Vertuccio L, Lafdi K. Nanofilled epoxy adhesive
for structural aeronautic materials. Compos Part B 2014;61:73–83.
[5] Li Y, Krahn J, Menon C. Bioinspired dry adhesive materials and their application in robotics: a review. J Bionic Eng 2016;13(2):181–99.
[6] Hoang-Toc C-T, Paroissien E. Simulation of single-lap bonded and hybrid (bolted/ bonded) joints withflexible adhesive. Int J Adhes Adhes 2010;30(3):117–29. [7] Sekulic A, Curnier A. Experimentation on adhesion of epoxy. Int J Adhes Adhes
2010;30(2):89–104.
[8] Ben Salem N, Budzik M, Jumel J, Shanahan M, Lavelle F. Investigation of the crack front process zone in the Double Cantilever Beam test with backface strain monitoring technique. Eng Fract Mech 2013;98:272–83.
[9] Jin H, Miller G, Griffin A, Stradley D, Roach D, Sottos N, et al. Fracture behavior of a self-healing, toughened epoxy adhesive. Int J Adhes Adhes 2013;44:157–65. [10] Lee M, Wang C, Yeo E. Effects of adherend thickness and taper on adhesive bond
strength measured by portable pull-off tests. Int J Adhes Adhes 2013;44:259–68. [11] Hu G. Mixed mode fracture analysis of adhesive lap joints. Compos Eng
1995;5(8):1043–50.
[12] da Silva LFM, Rodrigues TNSS, Figueiredo MAV, de Moura MFSF, Chousal JAG. Effect of adhesive type and thickness on the lap shear strength. J Adhes 2006;82(11):1091–115.
[13] WeiBgraeber P, Becker W. Finite Fracture Mechanics model for mixed mode fracture in adhesive joints. Int J Solids Struct 2013;50(14–15):2383–94. [14] Arcan M, Ashin Z, Voloshin A. A method to produce uniform plane-stress states with
applications tofiber-reinforced materials. Exp Mech 1978;18(4):141–6. [15] Bresson G, Jumel J, Shanahan M, Serin P. Strength of adhesively bonded joints
under mixed axial and shear loading. Int J Adhes Adhes 2012;35:27–35. [16] Créac’hcadec R, Cognard J, Jamin G, Jousset P. Experimental analysis of the
mechanical behaviour of a thickflexible adhesive under tensile/compression-shear loads. Int J Adhes Adhes 2014;48:258–67.
[17] Bouchet J, Roche A, Jacquelin E. Determination of residual stresses in coated metallic substrates. J Adhes Sci Technol 2001;15(3):321–43.
[18] Roche A, Behme A, Solomon J. A three-pointflexure test configuration for improved sensitivity to metal/adhesive interfacial phenomena. Int J Adhes Adhes 1982;2(4):249–54.
[19] ISO 14679. Adhesives– measurement of adhesion characteristics by a three-point bending method. Geneva, Switzerland: International Organization for
Standardization; 1997.
[20] Oh H-J, Lee J-H, Ahn H-J, Jeong Y, Park N-J, Kim S-S, et al. Etching characteristics of high-purity aluminum in hydrochloric acid solutions. Mater Sci Eng A Struct Mater 2007;449–451:348–51.
[21] Aakkula J, Saarela O. Silane basedfield level surface treatment methods for aluminium, titanium and steel bonding. Int J Adhes Adhes 2014;48:268–79. [22] Ramezanzadeh B, Raeisi E, Mahdavian M. Studying various mixtures of
3-aminopropyltriethoxysilane (APS) and tetraethylorthosilicate (TEOS) silanes on the corrosion resistance of mild steel and adhesion properties of epoxy coating. Int J Adhes Adhes 2015;63:166–76.
[23] Bentadjine S, Petiaud R, Roche A, Massardier V. Organo-metallic complex characterization formed when liquid epoxy-diamine mixtures are applied onto metallic substrates. Polymer 2001;42(14):6271–82.
[24] Aufray M, Roche A. Residual stresses and practical adhesion: effect of organo-metallic complex formation and crystallization. J Adhes Sci Technol 2006;20(16):1889–903.
[25] Roche A, Dole P, Bouzziri M. Measurement of the practical adhesion of paint coatings to metallic sheets by the pull-off and three-point flexure tests. J Adhes Sci Technol 1994;8(6):587–609.
[26] Bouchet J, Roche A, Jacquelin E. The role of the polymer/metal interphase and its residual stresses in the critical strain energy release rate (Gc) determined using a three-pointflexure test. J Adhes Sci Technol 2001;15(3):345–69.