Characterization of Non-Equilibrium Condensation
of Supercritical Carbon Dioxide in a de Laval Nozzle
The MIT Faculty has made this article openly available.
Please share
how this access benefits you. Your story matters.
Citation
Lettieri, Claudio, Derek Paxson, Zoltan Spakovszky, and Peter
Bryanston-Cross. “Characterization of Non-Equilibrium
Condensation of Supercritical Carbon Dioxide in a de Laval Nozzle.”
Volume 9: Oil and Gas Applications; Supercritical CO2 Power Cycles;
Wind Energy (June 26, 2017).
As Published
http://dx.doi.org/10.1115/GT2017-64641
Publisher
ASME International
Version
Final published version
Citable link
http://hdl.handle.net/1721.1/116087
Terms of Use
Article is made available in accordance with the publisher's
policy and may be subject to US copyright law. Please refer to the
publisher's site for terms of use.
CHARACTERIZATION OF NON-EQUILIBRIUM CONDENSATION OF
SUPERCRITICAL CARBON DIOXIDE IN A DE LAVAL NOZZLE
Claudio Lettieri
Delft University of Technology Delft, The Netherlands
Derek Paxson
Massachusetts Institute of Technology Cambridge, MA, USA
Zoltan Spakovszky
Massachusetts Institute of Technology Cambridge, MA, USA
Peter Bryanston-Cross
Warwick University Coventry, UK
ABSTRACT
On a ten-year timescale, Carbon Capture and Storage could significantly reduce carbon dioxide (CO2) emissions. One of
the major limitations of this technology is the energy penalty for the compression of CO2 to supercritical conditions, which
can require up to 15% of the plant’s gross power output. To reduce the power requirements supercritical carbon dioxide compressors must operate at reduced temperatures and near saturation where phase change effects are important. Non-equilibrium condensation can occur in the high-speed flow at the leading edge of the compressor, causing performance and stability issues. The characterization of the fluid at these conditions is vital to enable advanced compressor designs at enhanced efficiency levels but the analysis is challenging due to the lack of data on the metastable fluid properties.
In this paper we assess the metastable behavior and nucleation characteristics of high-pressure subcooled carbon dioxide during the expansion in a Laval nozzle. The assessment is conducted with numerical calculations, supported and corroborated by experimental measurements. The Wilson line is determined via optical measurements in the range of 41 and 82 bar and near the critical point. The state of the metastable fluid is fully characterized through pressure and density measurements, with the latter obtained in a first of its kind laser interferometry set up. In a systematic analysis the inlet conditions of the nozzle are moved close to the critical point to allow for large gradients in fluid properties and reduced margin to condensation. The results of calculations using a direct extrapolation of the Span and Wagner equation of state model are compared with the experimental measurements. The analysis suggests that the direct extrapolation using the Span and Wagner model yields results within 2% of the experimental
data, with improved accuracy at conditions away from the critical point. The results are applied in a pre-production supercritical carbon dioxide compressor and are used to define inlet conditions at reduced temperature but free of condensation. Full-scale compressor experiments demonstrate that the new inlet conditions can reduce the shaft power input by 16%.
Nomenclature
a k Speed of sound [m/s] Boltzmann constant [1.38x10⁻²³ m2kg s-2K-1] g Specific Gibbs free energy [m2 s-2]J Condensation rate [m-3 s-1] m Molar mass [kg/mol]
Mu Machine Mach number Mu=U2/a [-] p Pressure [Pa] r Radius [m] Re Reynolds number [-] S Entropy [J/kg K-1] T Temperature [K] u,U Velocity [m/s] x Axial coordinate [m]
Proceedings of ASME Turbo Expo 2017: Turbomachinery Technical Conference and Exposition GT2017 June 26-30, 2017, Charlotte, NC, USA
GT2017-64641
Greek symbols
ρ Density [kg/m3] σ Surface tension [kg/s2]Subscripts/superscripts
0 Inlet value 2 Discharge value c Critical value g Gas l Liquidr Reduced value (normalized by critical value) v Vapor
INTRODUCTION
To enable economically viable large-scale Carbon Capture and Storage, advanced fluid machinery compatible with supercritical fluids and operating at improved efficiency levels are necessary. The high pressures and multiphase flow in these compressors yield major fluid machinery design challenges, which are the focus of the present paper.
The carbon dioxide (CO2) is compressed to supercritical
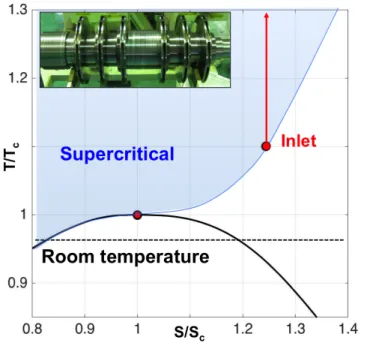
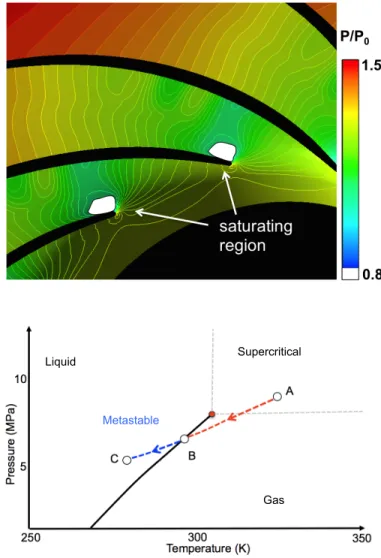
conditions in multi-stage centrifugal machines such as the one illustrated in Figure 1, where the compressor block inlet conditions are marked by the red dot on the temperature entropy (T-S) diagram. To reduce power requirements these compressors need to be operated at reduced temperatures and near saturation where phase change effects are important. The overspeed near the leading edge of the compressor can cause the local static pressure and temperature to drop below saturation, as indicated in Figure 2 (top) where the saturating region is marked in white. The fluid at supercritical conditions (point A) expands isentropically reaching saturation (point B). Condensation in high-speed fluids does not occur instantaneously when saturation is reached. Saturated fluid subjected to an isentropic expansion becomes supersaturated before condensation begins; during rapid cooling the fluid enters metastable state and behaves like a gas until the Wilson line, which is the point of highest supercooling, is reached and nucleation begins in the bulk flow [2] (point C). Figure 2 (bottom) illustrates the process on a pressure-temperature diagram. Condensation is often associated with increased losses and erosion of the compressor blades, so that to avoid nucleation it is common practice in industry to operate the machine at temperatures higher than ambient, as schematically indicated in Figure 1. This increases the power requirements of the machine. The characterization of the condensation process could enable the selection of improved compressor operating conditions, reducing the power required for carbon capture and storage. However, such characterization requires the knowledge of the fluid at metastable conditions. Multiphase flow analysis
of supercritical CO2compressors is challenging due to the lack
of experimental data on the metastable state.
Figure 1: Temperature-entropy diagram illustrating
compression of CO2 for Carbon Capture and Sequestration.
Centrifugal compressors. The state of the fluid at the inlet of the last block is supercritical and close to saturation. (Figure courtesy of Mitsubishi Heavy Industries).
Phase change in turbomachinery has received significant attention due to its relevance for steam turbines and pumps for propulsion and power generation applications. A significant amount of condensation is found in low-pressure turbine stages, leading to additional losses and condensation shocks. Vapor bubble formation, so called cavitation, has been studied extensively in the past due to its deleterious effects on the performance and stability of pumps. The formation of vapor bubbles, also called cavities, contributes to blockage, which can lead to a drop in head rise coefficient and instability such as cavitation surge. In compressors phase change is uncommon and information on the impact of condensation on compressor performance and stability are scarce in the literature. More specifically, there is a lack of experimental data for compressors operating with supercritical fluids at high pressure. Wright et al. [3] reported potential condensation at the inlet of a compressor for a supercritical carbon dioxide power cycle system. Although the state of the fluid was in the two-phase region the authors did not report any performance issue. Pecknic et al. [4] conducted numerical calculations of the flow in the same compressor and reported pressure and temperature below the saturation level at the leading edge of the machine, but did not assess the impact on compressor efficiency or stability. The work by Gyarmathy [2] indicates three sources of losses associated with phase change in turbomachinery: kinematic relaxation loss due to increased friction and shear in
the second phase, breaking loss due to the liquid droplets impinging on rotating surfaces, and thermodynamic wetness loss due to release of latent heat of condensation. In steam turbines the latter usually accounts for about 45% of the overall loss due to phase change.
As fluid property measurements in rotating machines are challenging, converging-diverging nozzles are often the method of choice for the characterization of states in multiphase flows. Gyarmathy [2], Schnerr [5], Ryzhov [6], Guha [7], Duff [8], Nakagawa et al. [9], and Bier et al. [17-18] investigated the rapid expansion of several fluids in nozzles, including CO2.
Expansion rates of 1oC/µs are common in turbomachinery
applications and can be reproduced in converging-diverging nozzles. The work by Schnerr [5] looked at the high speed condensation of steam with subcooling as much as 40 K and nucleation rates of ~1022-1025 m-3s-1. Gyarmathy [2], Bier et
al. [17-18] and Duff [8] determined the onset of condensation with static pressure measurements. Yazdani at al. [13] conducted multiphase CO2 calculations in converging diverging
nozzles. The study validated the numerical methodology with the experimental data by Nakagawa et al. [8], assessing the phase change of CO2 in the supersonic regime only. The
metastable CO2 properties have not been characterized before
and the definition of a suitable EOS model remains a long-standing challenge. Bier et al. [17-18] determined the Wilson line for CO2 up to pressures as high as 90% of the critical
pressure and for two different nozzle expansion rates. The Wilson line was defined as the point where the difference between the measured pressure and the pressure calculated with an isentropic one-dimensional model differed significantly. More specifically the temperature at the Wilson line was calculated using the Equation of State (EOS) model by Bender [19] using the measured pressure and assuming isentropic flow. This procedure relied on the accuracy of the EOS in characterizing the metastable fluid properties, which was not known a priori. The EOS model by Bender [19] was developed originally for oxygen, nitrogen and argon mixtures and might be inaccurate for metastable carbon dioxide near the critical point. Furthermore, the accuracy of the condensation point depends on the resolution of the pressure measurements along the nozzle wall and related pressure jump due to the latent heat of condensation. While the former is fixed and depends on the experimental procedure, the latter is reduced as the fluid state approaches the critical point. Finally, the isentropic assumption might fail in the proximity of the critical point due to the increased heat capacity of the fluid and improved heat transfer, making the nozzle non-adiabatic. It is conjectured that optical measurements might be needed to accurately assess the location of the Wilson line. Furthermore, optical measurements could help determining an additional fluid property.
Based on the above the following research questions are addressed. (i) How well do state of art EOS models characterize metastable state? (ii) What is the subcooling at the Wilson line? (iii) Can optical measurements be used to fully characterize the condensation onset in high-speed carbon dioxide flow? (iv) how close to the two-phase region can supercritical CO2
compressors operate so as to minimize power requirements while avoiding condensation?
0
Metastable
Liquid Supercritical
Gas
Figure 2: Isocontours of normalized pressure (top) from
numerical calculations and corresponding fluid state in a pressure/temperature diagram (bottom). The isentropic expansion near the compressor leading edge takes the CO2 from
supercritical state into the metastable region where non-equilibrium condensation might occur.
The National Institute for Standards and Technology (NIST) Reference Fluid Thermodynamic and Transport Properties Database (REFPROP) [10] uses the Span and Wagner model to calculate equilibrium properties as well as metastable vapor and liquid properties. However the metastable properties have no experimental foundation as they are based on equilibrium measurements. In this paper we verify the REFPROP extrapolation into the metastable region using interferometric measurements of density, coupled with pressure measurements along the nozzle. Interferometry is preferred over Schlieren and
background oriented Schlieren and can provide quantitative density measurements, which are relatively insensitive to noise and vibrations. To the authors knowledge this is the first time that density measurements of CO2 in the metastable region and
near the critical point are reported. Lamanna et al. [11] used laser interferometry to measure the density of water vapor through condensation shocks in the diverging section of a converging-diverging nozzle. Standard interferometric experiments were carried out at low density and pressures using nitrogen as a carrier gas for condensing water droplets. Density and condensation shock location measurements were conducted by Duff [8] using Schlieren visualization in subcritical CO2.
While the working pressures of 10 bar were significantly higher than those in Lamanna et al. [11], the supercritical CO2
experiments discussed here are at pressures yet one order of magnitude greater than in any other work using interferometry techniques. This imposes a significant challenge because the large density changes near the critical point require high resolution in the optical measurements. Knowledge of metastable properties and condensation onset enable reduced inlet temperatures in supercritical CO2 compressor and can
minimize power requirements while avoiding condensation. Shaft power reductions as large as 15 to 20% are estimated, making large scale CCS economically viable.
SCOPE OF PAPER
This paper experimentally and numerically characterizes the condensation of carbon dioxide during rapid expansion in a
converging-diverging nozzle. More specifically the objectives are to: (i) determine the accuracy of state of art equation of state (EOS) models in the metastable fluid region, (ii) assess the amount of subcooling during fast adiabatic expansions of saturated carbon dioxide before nucleation establishes phase equilibrium (Wilson line), and (iii) define guidelines for operation of a supercritical CO2 compressor without
condensation.
A laboratory-scale blowdown test rig with an instrumented converging-diverging nozzle is used as a surrogate for the flow conditions around the leading edge of a typical supercritical CO2 compressor blade. Optical access to the nozzle test section
is provided through high-pressure rated fused silica windows and the onset of condensation is assessed with high-speed optical measurements at different inlet flow conditions. Non-equilibrium condensation is observed and the Wilson line is determined. The metastable CO2 properties are determined
through simultaneous pressure and density measurements. Numerical calculations are conducted to assess the applicability and limitations of direct extrapolation of the NIST Span and Wagner equation of state model into the metastable region. Density measurements using the interferometer are compared with results from the calculations to assess the validity of these approaches at operating points near the critical point. Agreement within 0.1% of the predicted values of pressure and density in the converging part of the nozzle and the metastable region suggest that the Span and Wagner EOS model can
adequately model metastable fluid properties. However, this agreement deteriorates at high pressure and near the critical point where up to 2% discrepancy is observed. The Wilson line is characterized for temperatures in the range of 263 to 295 K and pressures in the range of 26 to 65 bar approaching the critical point. The definition of the Wilson line allows to determine compressor inlet conditions for operation without condensation. These inlet conditions are used for a full-scale supercritical carbon dioxide compressor, leading to a reduction of the power requirements of 16%, while showing no sign of performance degradation due to condensation.
TECHNICAL APPROACH
Numerical Methodology
The commercial solver ANSYS CFX 17.1 is used for the calculations of the two-phase flow in the nozzle. A detailed description of the numerical methodology can be found in [12]. The computational approach is based on a finite-volume method using an implicit, compressible formulation with a second order spatial discretization. Due to Reynolds numbers of order 107, Reynolds Averaged Navier-Stokes (RANS) calculations are performed and the governing equations are closed through the two-equation k-ω shear stress transport (SST) turbulence model by Menter [20]. Careful grid refinements were needed to capture the boundary layer at high Reynolds number, and for all calculations the y+ is close to 1, except in regions with large overspeed, such as near the leading edge of the compressor, where it can reach values as high as 15-20. This is within the limits of validity of the turbulence model as specified by the Ansys CFX solver guide. The NIST Span and Wagner (SW) Equation of State (EOS) model, defined by Reference Fluid Thermodynamic and Transport Properties Database (REFPROP) [10], is incorporated in the CFD solver in the form of lookup tables [12], also called real gas properties tables (RGP). The implementation has been tested and validated through a systematic refinement of the tables and compared with experimental data in a converging diverging nozzle. The analysis indicated that in the pressure range between 67 and 95 bar and temperature range of 250 to 325 K there was no appreciable difference in derived thermo-physical properties if the table entries were resolved within 0.1 K in temperature and 0.1bar in pressure.
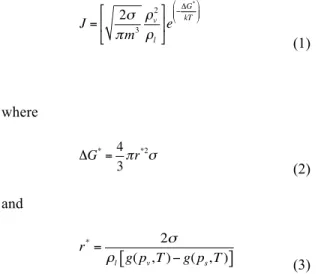
Two-phase calculations are conducted using a user-defined model for droplet nucleation in CFX. The flow solver uses a two-phase, one-fluid formulation where the dispersed phase is treated through extra equations for the transport of the liquid droplet mass fraction and diameter. The onset of nucleation is defined through classical nucleation theory under the assumptions of non-equilibrium, homogeneous condensation. The nucleation rate is defined by:
J = 2σ π m3 ρv 2 ρl ! " # $ % &e −ΔG * kT ) * ++ , -.. (1) where ΔG* =4 3πr *2 σ (2) and r* = 2σ ρl
[
g( pv, T ) − g( ps, T )]
(3)σ is the surface tension, r is the droplet radius, ρ is the density, m is the molar mass, k is the Boltzmann constant, T is the temperature, g is the Gibbs free energy, and the subscripts v, l and s refer to the vapor, liquid and subcooled phases respectively. The surface tension is defined by a second order polynomial from the NIST REFPROP values. To model non-equilibrium condensation, the Gibbs free energy is computed from metastable properties based on the built-in REFPROP formulation, which simply extends the SW EOS past saturation. This is illustrated in Figure 3 using enthalpy as an example. Experimental Blowdown Test Rig, Instrumentation and Measurements
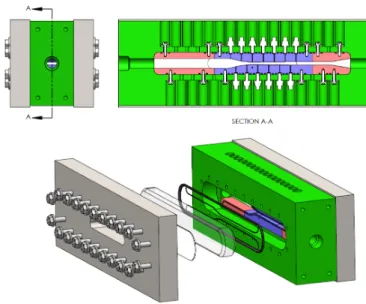
The experimental test apparatus consists of a blowdown test rig. A high-pressure charge tank is connected to a fast acting valve, which directs the flow into a nozzle test section. A simplified schematic of the blowdown test rig is given in Figure 4 and more detailed information can be found in Paxson [21]. Liquid CO2 is pumped from a storage dewar into a
high-pressure heated charge tank, where it is brought to the desired stagnation conditions. The nozzle test section is instrumented with pressure transducers and yields optical access through two fused silica (quartz) high-pressure rated windows. A rectangular cross section is chosen to achieve two-dimensional flow conditions and to simplify the optical flow analysis. This arrangement is illustrated in Figure 5. Three-dimensional CFD computations of the nozzle geometry confirmed the two-dimensionality of the flow, showing a maximum spanwise boundary layer thickness of approximately 3% of the channel height at typical operating conditions as shown in Figure 6. This is further corroborated by the experimental interferometric measurements, which show the boundary layer through a slight deflection of the fringe pattern, as also shown in Figure 6. The experimentally observed thickness of the boundary layer is in agreement with that of the calculations. The numerical calculations indicate 0.3% change in total pressure due to the boundary layer in the spanwise direction, suggesting that the
boundary layer has negligible effect on the interferometric measurements and hence the measured density. The exposure time for the images was 1/8000 seconds. If there had been a significant boundary layer turbulence in the flow it would have resulted in a loss in correlation of the images. This was not observed. If any boundary layer effect would have been observed the laser could have been triggered to provide a shorter exposure time. This procedure proved unnecessary.
The CO2 is then collected in a dump tank. The charge tank
stagnation conditions can be set up to 236 bar and 400K. The typical duration of a blowdown test is 1 second, and the total conditions change at up to 3% per second over a nominally 1 second blowdown. The through flow time is 10-4 seconds, with a minimum of 10000 flowthroungh times per test. The reduced frequency associated with each test is much less than unity, indicating that unsteady effects are small and the flow is quasi-steady.
Figure 3: Temperature-pressure diagram illustrating NIST
REFPROP table extrapolation for enthalpy. Top: equilibrium Span and Wagner EOS Bottom: extrapolated metastable Span and Wagner EOS.
The testing of several nozzles with different expansion rates is facilitated by divorcing the structural requirements of the test-section from the nozzle geometry. A stainless steel structure (shown in green in Figure 5) retains the windows, and provides structural integrity in the high pressure environment. The nozzle inserts are made of aluminum and bolted into the main body. This allows investigating different nozzle geometries and varying the location and resolution of the pressure measurements. The throat height is selected to minimize the mass flow rate and maximize the blowdown time without a significant change in stagnation conditions of the charge tank. The test section arrangement accommodates 33 pressure transducer ports. In the present study 13 pressure transducers were used and the analysis is focused on only one nozzle geometry. The nozzle length is 0.155 m and the throat area is 20 mm2. The outlet to throat and the inlet to throat area
ratios are 1.3 and 4.1 respectively. The charge tank volume is 400 liters.
Figure 4: Schematic of blowdown test facility.
Shearing interferometry shown in Figure 7 is used to measure the density gradient of the supercritical CO2 in the De Laval
nozzle. Large density gradients associated with the isentropic expansion of the fluid near the critical point lead to new challenges in image analysis. Standard interferometry techniques determine density based on the refractive index of the medium through interference of two laser beams. The spacing between interference fringes decreases with the density gradient, and would require up to 200 pixels per mm in the case of supercritical CO2. A high resolution CCD camera of ~100
MP would therefore be needed to capture the raw images of the region of interest. In the present work we directly measure density gradient instead of absolute density using a shearing interferometer. This enables the use of a standard high-resolution CCD camera (16MP). The shearing interferometer technique is also vibration tolerant and yields more robust measurements with respect to optical defects than a conventional Mach-Zehnder interferometer [15].
Figure 5: Schematic of blowdown test facility.
Figure 6: Computed normalized total pressure distribution at
throat of nozzle test section (bottom) showing thin boundary layer thickness and nearly one-dimensional flow. Contour lines indicate 0.3% change in spanwise total pressure. Experimental interferometric measurements (top) confirm thin boundary layer.
Interferometry is typically used for the aerodynamic analysis of ideal gases in external flows applications and the densities seen in the present experiment are two orders of magnitude larger than what is reported in the external flow literature [13]. This introduces new challenges in image analysis, since the interference fringes become narrowly spaced, requiring approximately 200 pixels per mm of view field. This necessitates a very high resolution CCD camera (~100 MP) to capture the raw images of the region of interest in the test section. The idea in the present paper is to measure density gradient instead of absolute density using a shearing interferometer so as to allow for a standard high-resolution CCD camera (16MP). Furthermore, a shearing interferometer is much more vibration tolerant and more robust with respect to optical defects than a conventional Mach-Zehnder Interferometer [13]. In a standard Mach-Zehnder interferometer, the phase-shifted beam that passes through the test section is compared with a coherent reference beam [11]. Because there are two separate beams the system is susceptible to vibration and precise control of the path length of the reference beam is necessary. A shearing interferometer, as used in this experiment, is a common path interferometer where a single beam is divided into two overlapping beams after passing through the test section. The beams are then combined with a spatial displacement, creating interference fringes. The fringe pattern is a measurement of the density change between the two paths and can be numerically integrated to calculate the absolute density of the gas.
The interferometer that was designed and built for the CO2 test rig is shown below in Figure 8. A 50mW
diode laser with a wavelength of 671nm and coherence length greater than 1m is expanded and collimated through a microscope objective and a standard camera lens respectively. The beam passes through the test section and experiences a phase lag as well as an angular deflection caused by density
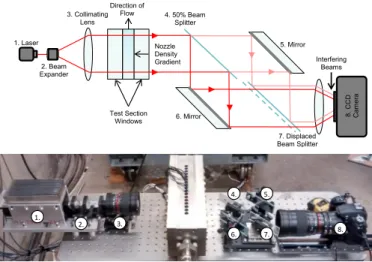
Figure 8: Schematic and image of the shearing interferometer used on the MIT CO2 test rig
4. 50% Beam Splitter 1. Laser 2. Beam Expander 3. Collimating Lens Test Section Windows Interfering Beams Direction of Flow 6. Mirror 5. Mirror 7. Displaced Beam Splitter 8. CCD Ca m er a Nozzle Density Gradient 1. 2. 3. 4. 5. 6. 7. 8.
Figure 7: Shearing interferometer setup.
A shearing interferometer is a common path interferometer where a single beam is split into two overlapping beams after passing through the test section. A 50 mW diode laser with a wavelength of 671 nm and coherence larger than 1m (1) passes through a beam expander (2) and a collimating lens (3). The generated beam passes through the nozzle test section, experiencing a phase lag as well as an angular deflection caused by density changes within the fluid. A system of beam splitters and mirrors (4-7) divide the beam in two identical beams, which are then combined with spatial displacement. By changing the position of one of the beam splitters, the spatial shift between the beams can be adjusted.
The interference between the beams creates a fringe pattern, which is a measurement of the change in refractive index and, through the Lorentz-Lorentz equation, relates to the fluid density gradient. In particular the fringe pattern is focused onto the CCD chip of a digital camera. The so-called carrier fringe pattern is created by applying a rotation about the vertical axis to one of the mirrors. During an experimental run the amount of spatial displacement between the two beams compares the different optical paths through the flow as a phase shift, which adds or subtracts to the carrier fringe pattern. This spatial shift or the change in phase enables the shearing interferometer to perform a Fourier based phase unwrapping approach and extract refractive index data [22]. The software also has the capability to process images of greater than 45Mbytes contagiously, providing a global instantaneous, quantitative density mapping of the high pressure gas flow [23]. This ultimately allows to quantitatively measure the density gradient within the flow. To determine the actual density, the density gradient is integrated from the known value at the nozzle inlet. The latter is determined under the assumption of adiabatic, isentropic flow by using conservation of mass and energy. The state of the fluid in the tank is defined by direct density,
temperature and pressure measurements. Starting with the tank measurements the density at nozzle inlet is calculated iteratively combining the pressure measurements along the nozzle and using continuity and isentropic flow relations. Ahead of each run the density in the tank is measured via load cells, determining the CO2 mass and knowing the tank volume.
This measurement is further refined via total pressure and temperature measurements in the tank using a pressure transducer, several thermocouples, and the Span and Wagner equation of state model. With three available thermodynamic properties, and only two needed to define the state of the fluid a sensitivity analysis was conducted to determine the measurement error in the tank total conditions. The temperature is measured with KqXL-116U-12 sensors, which yield 0.25K uncertainty. Pressure is measured with PX409-2.5KGV pressure sensors with 0.1 bar uncertainty. The mass of CO2 is
measured using LC501-2K load cells with 1.2 kg uncertainty. At conditions directly above the critical point (T=309.77K, p=87.7 bar and r=605 kg/m3) the estimated errors are 1% in
pressure determination if 𝜌-T are used, 0.12% in temperature measurement if 𝜌-p are used and 2.2% in density measurements if T-p are used. This analysis is extended at all conditions for the tests shown in this paper. Above and below a reduced entropy of 1.16, 𝜌-p and T-p respectively yield the lowest uncertainty in calculated entropy, while 𝜌-T produced higher uncertainty than one of the other pairs at all points. The corresponding error in calculating entropy of the tank is estimated to be within 0.3%, yielding an uncertainty of the entropy at the inlet of the nozzle of 1.3%. Further details of the interferometry technique, uncertainty measurements and set up can be found in Paxson et al. [16] and Paxson [21].
ASSESSMENT OF WILSON LINE AND METASTABLE FLUID PROPERTIES
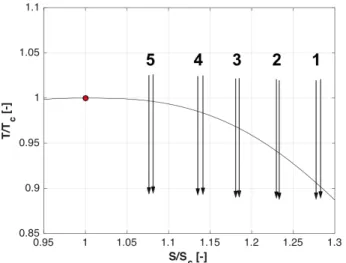
The ‘Wilson line’ is a property of the condensing vapor and strongly depends on the rate at which the expansion occurs. Higher expansion rates lead to a larger penetration into the metastable region, ultimately shifting the Wilson line towards regions of higher subcooling. De Laval nozzles are a convenient means for studying these processes, because the time rate of the expansion and nucleation process can be varied by using nozzles of different lengths while keeping the pressure ratio the same. Similarly, the geometric expansion rate can be held constant while the inlet total pressure is moved closer to the critical point. This leads to deeper excursions into the metastable region and allows determining the location of the Wilson line. In the present paper we will focus on the latter, while ongoing and future work will consider different nozzle geometries. As such the temperature at the inlet of the nozzle is held constant at 315K and the total pressure in the charge tank is varied systematically between 57 and 86 bar. Figure 8 illustrates the inlet conditions in the nozzle in a temperature-entropy (T-S) diagram and Table 1 summarizes the corresponding pressures for each test case. The temperature and
entropy are normalized by the critical conditions. Each test is conducted twice to ensure repeatability.
Figure 8: Temperature-entropy diagram illustrating the set of
tests used to determine the Wilson line.
High-speed footage of the nozzle test section shows the onset of condensation as white fog, as illustrated in Figure 9. As the pressure is increased at constant temperature the margin to condensation is reduced, moving the onset of nucleation closer to the throat and into the converging section of the nozzle. Density measurements are conducted through interferometry until the point of condensation, as indicated in Figure 10 where the fringe pattern is visible up to the condensation front. Pressure measurements reveal a bump in static pressure corresponding to the onset of nucleation. In Figure 11 the pressure measurements are compared with a one-dimensional isentropic analysis for run 4 as an example. The black, horizontal, dashed line marks the saturation pressure at which the fluid becomes metastable. The blue dashed line marks the location of condensation onset. The pressure rise is shifted upstream as the pressure at the inlet is increased (not shown here), consistent with the flow visualizations. Coupled pressure and density measurements are used to determine the exact conditions at which nucleation occurs and determine the location of the Wilson line. The pressure is linearly interpolated between two pressure transducers where condensation is encountered, and the value is weighted based on the location defined by optical visualization. To verify the interferometry set up the density measurements are compared with first principles modeling based on an isentropic expansion using the Span and Wagner model and numerical calculations. The methodology is also assessed for single-phase flow by running the nozzle at increased entropy and away from the saturation line in Paxson [21].
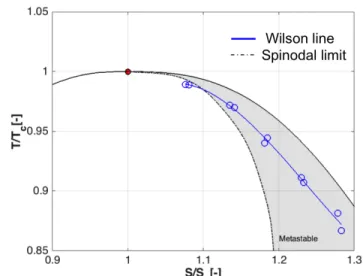
The experimentally determined Wilson line is shown in a T-S diagram in Figure 12. The spinodal decomposition limit from the Span and Wagner Equation of State (S-W EOS) model
defined by the NIST REFPROP is also reported. The Wilson line crosses the spinodal limit at high pressure and near the critical point. This might indicate that the spinodal limit based on the S-W EOS is inaccurate due to challenges associated with the definition of the thermodynamic properties of CO2 near the
critical point. Further experiments must be conducted at high pressures to confirm this conjecture and for the moment the data at the highest pressure is omitted in Figure 13 where the Wilson line measurements are compared with the values measured by Bier et al. [17-18].
Case T[K] P[bar] S[J/KgK] T/Tc P/Pc S/Sc 1 310 59 1830 1.02 0.8 1.28 2 310 67 1766 1.02 0.9 1.23 3 310 74 1695 1.02 1.0 1.18 4 311 80 1634 1.025 1.1 1.13 5 312 84 1548 1.027 1.2 1.08
Table 1 Run conditions.
Figure 9: Condensation fog in the nozzle test section for test
runs summarized in Table 1.
Figure 10: Fringe pattern visible up to the condensation point
Figure 11: Pressure measurements for Case 4. Experimental
measurements are compared with an isentropic expansion to identify the pressure rise due to condensation onset. The nozzle throat is located at x/L=0.
Figure 12: Temperature-entropy diagram illustrating Wilson
line measurements. The spinodal limit is determined using the NIST formulation of the Span and Wagner Equation of State model.
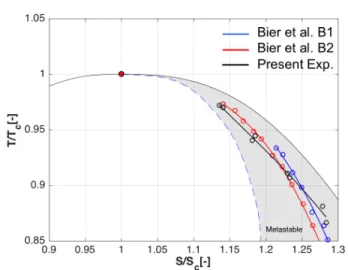
The experiments by Bier et al. refer to two nozzles with expansion rates
!p = −wdp / pdx
of 2x10⁴ s-1 and 8x10⁴s-1 , denoted as B1 and B2 respectively. The nozzle in the present study yields an average expansion rate in the converging section of 7.4x10⁴s-1. The expansion rate changes in thediverging section, however, the present analysis focuses on the converging section because the flow at the leading edge of the compressor is subsonic and does not exceed Mach 1. While the nozzle expansion rate is close to that of geometry B2 in Bier et al. the comparison indicates discrepancies between the
Wilsonline measurements of up to 20%. This is likely due to inaccuracies in determining the thermodynamic state at condensation onset by Bier et al. The authors used interpolated pressure measurements under the assumptions of isentropic flow and the EOS model by Bender’s [20]. The coupling of density and pressure measurements together with the Span and Wagner EOS model used here yield a more accurate estimation of the thermodynamic state at the condensation onset. The subcooling levels normalized by the critical temperature recorded for each condensation point are reported in Figure 14 and show a near linear trend with reduced entropy Sr =S/Sc.
Numerical calculations were conducted next to verify the accuracy of the extrapolation of the Span and Wagner metastable properties relative to experimental data. The computed density in the converging nozzle section is shown in Figures 15-16 for runs 2 and 3 and are compared with the measured values as well as with values obtained through isentropic one-dimensional analysis using the Span and Wagner EOS model. The results for Case 2 are shown in Figure 15 while Figure 16 refers to Case 3, as indicated in Table 1. The present analysis is limited to the converging part of the nozzle because the Mach numbers in the compressor of interest are in the subsonic/transonic regime. Centrifugal compressors used for CCS have usually machine Mach numbers Mu=U2/a
ranging from 0.4 to 0.8, where U2 is the tip speed and a is the
speed of sound. The highest relative Mach in the machine is often found at the leading edge, where the fluid isentropically expands and might reach sonic conditions. The grey shaded area indicates the metastable region for which pressure and temperature are below the saturation values, while the blue shaded ones indicates the experimental uncertainty in the measurements. The calculations show agreement within 0.2% in the converging section and in the equilibrium region. The agreement is maintained in the metastable region at pressures above reduced entropies of Sr= 1.2 as shown for Case 2 in
Figure 15. The results validate the extrapolation of the Span and Wagner EOS model at reduced pressure, while showing discrepancies as large as 2% at reduced entropies below 1.2.
Figure 13: Temperature-entropy diagram illustrating comparison of the Wilson line measurements with the work by Bier et al. [17-18].
Figure 14: Measured subcooling normalized by the critical
temperature versus reduced entropy.
Current and future work aims to improve the accuracy of the EOS extrapolation using the experimental data. Further analysis will be conducted using table extrapolation via cubic spline methods and by assessing the effect of different nozzle expansion rates on the Wilson line and on the condensation onset. One example is to use the entropy, pressure and density from the measurements to determine the thermos-physical fluid properties in the metastable region. The values in-between measurements can be fitted using cubic interpolation in RGP tables, effectively improving the accuracy of the isentropic flow predictions.
Although direct imaging of the experimental test section provides information of the condensation onset the imaging does not provide a quantitative measure of the moist mass fraction and cannot be compared with the computed amount of condensate.
Figure 15: Density in the converging part of the nozzle.
Calculations (red) and results of a one-dimensional isentropic expansion using the Span and Wagner EOS model are compared with experiments (blue) at 67 bar in the charge tank.
Figure 16: Density in the converging part of the nozzle.
Calculations (red) and results of a one-dimensional isentropic expansion using the Span and Wagner EOS model are compared with experiments (blue) at 74 bar in the charge tank.
DEFINITION OF CONDENSATION-FREE COMPRESSOR INLET CONDITIONS
A limit on condensation free compressor inlet total conditions is determined based on the experimentally derived Wilson line shown in Figure 12. For total conditions above this limit an isentropic expansion up to an indicated Mach number at the impeller leading edge will lead to temperatures and pressures above the Wilson line. The condensation limits are drawn for expansions up to leading edge Mach numbers of 0.9, 1 and 1.1 in Figure 17. The speed of sound and the enthalpy for the points along the Wilson line are calculated using extrapolated values
from the Span and Wagner EOS. Assuming Mach number, the velocity can be calculated. One dimensional compressible isentropic analysis, mass conservation and energy conservation are used to calculate the total enthalpy from the velocity and the static enthalpy. With the entropy and the total enthalpy known, the total conditions can be calculated using the equilibrium Span and Wagner EOS.
The condensation limit for a maximum Mach number of 1 is taken as an experimentally derived limit typical for supercritical CO2 compressors. This boundary is used to run
two-phase real gas calculations of the first stage of the last block of a Mitsubishi Heavy Industry pre-production supercritical CO2 compressor with a discharge pressure above
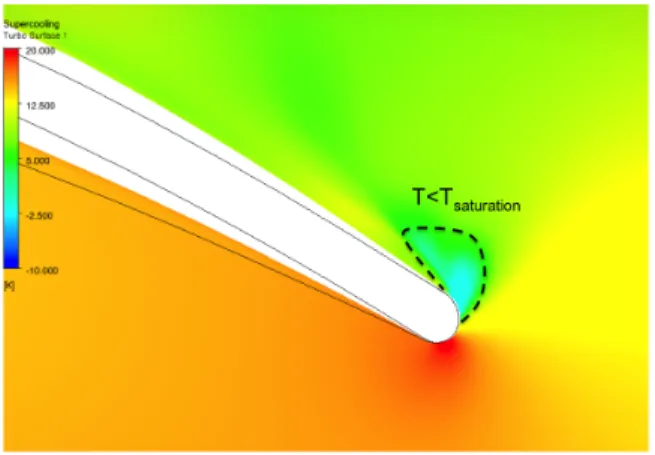
700 bar. The total inlet conditions are set on the experimentally determined condensation limit at 80 bar and 315K. Even though the pressure and temperature near the leading edge drop below the saturation values as shown in Figure 18, the computations indicate no condensation within the bulk flow and the fluid remains entirely in the metastable region. A timescale analysis is derived using the residence time tr of the
fluid in the condensing region and the nucleation time, defined as tn= 1 / JmaxV, where Jmax is the maximum computed
nucleation rate and V is the volume of the condensing region. The timescale analysis suggests that condensation does not occur because of the short residence time of the flow in the condensing region and relatively large nucleation time such that
t
r/ t
n<< 1
. The inlet conditions at 80 bar and 315K were usedin a full-scale supercritical CO2 compressor test with discharge
pressure of over 700 bar. The reduced inlet temperature led to a measured shaft power reduction of 16%. During the compressor tests no signs of instability or performance deterioration were found supporting the conjecture that compressor operation was condensation free.
Figure 17: Experimentally derived condensation limits on
compressor inlet conditions for various maximum leading edge Mach numbers.
Figure 18: Computed region of metastable, condensation free
fluid. The computations suggest condensation cannot occur for compressor inlet conditions above the experimentally determined limit.
CONCLUSIONS
Non-equilibrium condensation of CO2 in a
converging-diverging nozzle was characterized via experiments and computation. Condensation is observed in a range of stagnation pressures at the nozzle inlet between 57 and 86 bar and a stagnation temperature of about 310 K. The Wilson line, determining the non-equilibrium condensation onset, was determined through optical visualization of the condensation onset, density measurements through shearing interferometry and static pressure measurements along the nozzle walls. The analysis is conducted by increasing the inlet pressure and shifting the condensation front upstream in the nozzle and into the converging section. Numerical calculations are conducted using a user defined condensation model based on classical nucleation theory and metastable properties based on direct extrapolation of the NIST REFPROP Span and Wagner EOS model. The main takeaways from the paper are that: (i) direct extrapolation in fluid properties yield results within 0.2% of the experiments validating the methodology away from the critical point (S/Sc>1.2) , (ii) near the critical point (S/Sc<1.2) the
extrapolation yields errors as large as 2%, (iii) the Wilson line is determined based on pressure and density measurements at conditions as high as 0.97 of the critical values, and (iv) the measured condensation onset is used to define an experimentally determined limit for condensation free inlet conditions of supercritical carbon dioxide compressors. Numerical calculations of a supercritical compressor stage are conducted at inlet conditions above the condensation margin and confirm the absence of condensate. A timescale analysis supports the conjecture that condensation does not occur as the residence time of the flow in the condensing region is short relative to the nucleation time.
ACKNOWLEDGMENTS
This research was funded by Mitsubishi Heavy Industries Takasago R&D Center, which is gratefully acknowledged. In particular, the authors would like to thank Dr. Eisaku Ito, and Mr. Akihiro Nakaniwa for their support.
REFERENCES
[1] US EPA. Report on the Environment. Technical report, 2009.
[2] Gyarmathy, G., “Nucleation of steam in high-pressure nozzle experiments”. Journal of Power and Energy 2005 219: 511.
[3] Wright, S., Radel, R., Vemon, M., Rochau, G., Pickard, P. "Operation and analysis of a Supercritical CO2 Brayton Cycle". Technical Report SAND2010-0171, Sandia National Laboratories, September 2010.
[4] Pecnik, R., Colonna, P. "Accurate CFD Analysis of a Radial Compressor Operating with Supercritical CO2". J. Eng. Gas Turbines Power, 134(12), 2012.
[5] Schnerr, G., H., 1995, “Compressible Flows With Given Internal Heat Addition,” Two-Phase Flows With Phase Transition, (VKI Lecture Series 1995-06), von Karman Institute, Rhode-St-Genese, Belgium.
[6] Ryzhov, Y. A., 1989, Nonequilibrium Condensation in High-Speed Gas Flows, Gordon and Breach, New York.
[7] Guha, A., 1994,“Thermal Chocking Due to Nonequilibrium Condensation,” ASME J. Fluids Eng., 116(3), pp. 559–604. [8] Duff, K. M., 1964, “Non-Equilibrium Condensation of
Carbon Dioxide in Supersonic Nozzles,” Master’s thesis, Department of Mechanical Engineering, Massachusetts Institute of Technology, Cambridge, MA.
[9] Nakagawa, M., Berana, M. S., and Kishine, A., 2009, “Supersonic Two-Phase Flow of CO2 Through Converging– Diverging Nozzles for the Ejector Refriger- ation Cycles,” Int. J. Refrig., 32(6), pp. 1195–1202.
[10] Lemmon, E. W., Huber, M. L., and McLinden, M. O., 2010, “NIST Standard Reference Database 23: Reference Fluid Thermodynamic and Transport Properties-REFPROP,” Version 9.0, National Institute of Standards and Technology, Standard Reference Data Program, Gaithers- burg, MD.
[11] Lamanna G., van Poppel, J., and van Dongen M.E.H.. “Experimental Determination of Droplet Size and Density Field in Condensing Flows,” Experiments in Fluids, 32(3), p.381, 2002.
[12] ANSYS Academic Research, 2013, ANSYS Release 14.5, Theory Manual, ANSYS, Inc., Canonsburg, PA.
[13] Yazdani, M., Alahyari, A., and Radcliff, T., 2014, “Numerical Modeling and Validation of Supersonic Two-Phase Flow of CO2 in Converging-Diverging Nozzles,” ASME J. Fluid Eng., 136(1), p. 014503.
[14] McDonald, J. E., 1962, “Homogeneous Nucleation of Vapour Condensation. I. Thermodynamic Aspects,” Am. J. Phys., 30(12), pp. 870–877.
[15] Mercer, C.R., and Raman, G. "Quantitative Interferometry in the Severe Acoustic Environment of Resonant Supersonic Jets", AIAA Journal, Vol. 40, No. 3 (2002), pp. 438-442 [16] Paxson, D., Lettieri, C. Spakovszky, S., Bryaston-Cross, P.
“Experimental Assessment of Thermodynamic Properties for Metastable CO2”, The 5th International Symposium -
Supercritical CO2 Power Cycles March 28-31, 2016, San Antonio, Texas.
[17] Bier, K, Ehler, F. and Niekrawletz, M, “Experimental Investigation and Computer Analysis of Spontaneous Condensation in Stationary Nozzle Flow of CO2-Air
Mixtures”, Adiabatic Waves in Liquid-Vapor Systems, Springer-Verlag (1989), Berlin.
[18] Bier, K, Ehler, F. and Theis, G, “Spontaneous Condensation in Stationary Nozzle Flow of Carnon Dioxide in a Wide Range of Density”, Adiabatic Waves in Liquid-Vapor Systems, Springer-Verlag (1989), Berlin.
[19] Bender, E. “The Calculation of Phase Equilibria from a Thermal Equation of State Applied to the Pure Fluids Argon, Nitrogen, Oxygen and their Mixtures” C.F. MUller-Verlag, Karlsruhe, 1973.
[20] Menter, F. R. "Two-equation eddy-viscosity turbulence models for engineering applications", AIAA Journal, Vol. 32, No. 8 (1994), pp. 1598-1605. http://dx.doi.org/10.2514/3.12149
[21] Paxson, D, “Experimental Characterization of Condensation Behavior for Metastable Carbon Dioxide”, (2016) Master Thesis, Massachusetts Institute of Technology, Cambridge, MA.
[22] Judge, T. and Bryanston-Cross, P., "A Review of Phase Unwrapping Techniques in Fringe Analysis," Optics and Lasers in Engineering, Vol. 21, Issue 3 (1994) pp. 199-239. http://dx.doi.org/10.1016/0143-8166(94)90073-6
[23] Chen, L. “An image-processing software package Crop. SPIE 8769”, International Conference on Optics in Precision Engineering and Nanotechnology (icOPEN2013), 87690U (June 22, 2013); doi:10.1117/12.2021357
APPENDIX
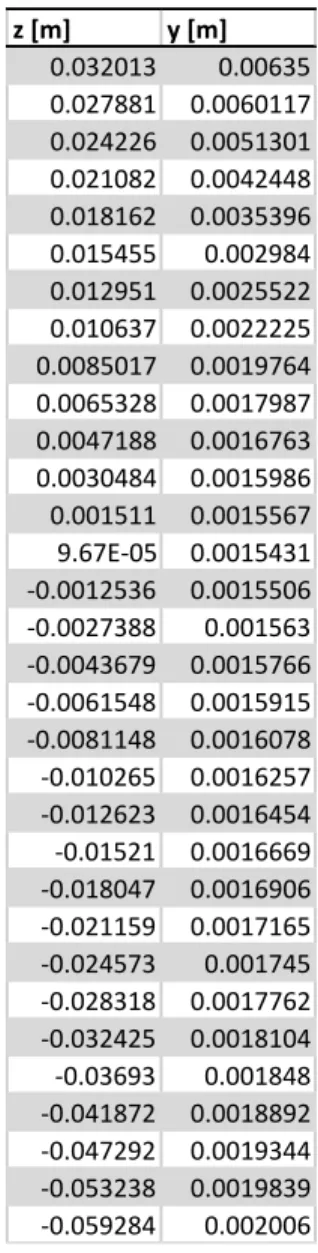
The pressure measurements and density measurements for all test cases are reported in this appendix as a reference for future studies. This section also includes the coordinates of the nozzle test section. Figure 19 shows the measured static pressure in the nozzle for all the test cases. Each run is conducted more than once, to ensure repeatability. The corresponding measured static pressure at the inlet of the nozzle is reported in the legend. Case 1-5 of table 1 correspond to measured inlet static pressures of, 58, 64.4, 72.4,82.7 and 84.8 bar respectively. Figure 20 reports the density measurements for cases 1. Table 2 yields the nozzle wall coordinates.
Figure 19: Measured static pressure for each test case. The
label indicate the corresponding measured nozzle inlet static pressure.
Figure 20: Measured density for test case 1.
Table 2 Nozzle wall coordinates
z [m] y [m] 0.032013 0.00635 0.027881 0.0060117 0.024226 0.0051301 0.021082 0.0042448 0.018162 0.0035396 0.015455 0.002984 0.012951 0.0025522 0.010637 0.0022225 0.0085017 0.0019764 0.0065328 0.0017987 0.0047188 0.0016763 0.0030484 0.0015986 0.001511 0.0015567 9.67E-05 0.0015431 -0.0012536 0.0015506 -0.0027388 0.001563 -0.0043679 0.0015766 -0.0061548 0.0015915 -0.0081148 0.0016078 -0.010265 0.0016257 -0.012623 0.0016454 -0.01521 0.0016669 -0.018047 0.0016906 -0.021159 0.0017165 -0.024573 0.001745 -0.028318 0.0017762 -0.032425 0.0018104 -0.03693 0.001848 -0.041872 0.0018892 -0.047292 0.0019344 -0.053238 0.0019839 -0.059284 0.002006