BUYING MOTIVES IN
WOMEN'S HOSIERY
by
John Baptist Savoca
SUBMITTED IN PARTIAL FULFILLMENT OF THE REQUIREMENTS FOR THE DEGREE OF
BACHELOR OF SCIENCE at the
MASSACHUSETTS INSTITUTE OF TECHNOLOGY (1952)
Signature of Author. ...
Dep tment'of guiness and Engineering Administration
Certified by.
3
Ames StreetCambridge, Massachusetts May 12, 1952
Professor Joseph S. Newell Secretary of the Faculty
Massachusetts Institute of Technology Cambridge 39, Massachusetts
Dear Sir:
In accordance with the requirements for graduation, I herewith submit a thesis entitled "Buying Motives in Women's Hosiery".
A3in~gerely, yours,
TABLE OF CONTENTS
LETTER OF TRANSMITTAL...,***.*..***.*... i
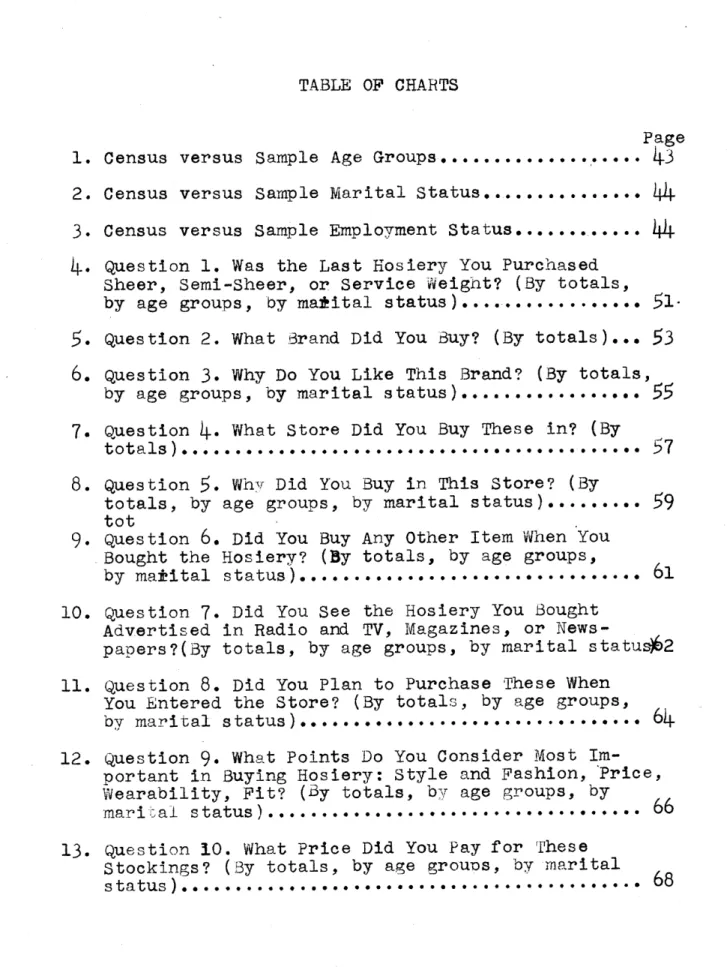
TABLE OF CRARTS...11
INTRODUCTION... 1
SCOPE AND LIMITATIONS...*.*.*... 8
CONCLUSIONS AND RECOMMENDATIONS... 12
PROCEDURE..*. .** . *.* . ** . * .**** ...* *0Cc 25 Informal Investigation & Situation Analysis... 26
Planning the Investigation... 28
Securing the Information... 40
Assembling, Organizing & Classifying Data... L 2 Analysis & Interpretation....*... 46
Preparation of Report...* 47
Follow-up...4...l... 47
FINDINGS... ~ C... ... 48
APPENDIX A: TABULATIONS...*... 81
Part I.... By Totals... 82
Part II...By Age Groups...
99
Part III..By Marital Status...1 2 1 APPENDIX B: COMPARISON OF CENSUS AND SAMPLE DATA...138
APPENDIX C: QESTIONNAIRE...13
1. 2.
3.
5.
6.
7.
8.
9.
Census versus Sample Age Groups... Census versus Sample Marital Status...
Census versus Sample Employment Status... Question 1. Was the Last Hosiery You Purchased Sheer, Semi-Sheer, or Service Weight? (By totals, by age groups, by matital status)...
Question 2. What Brand Did You Buy? (By totals)... Page
43
44
44
51-53
Question 3. Why Do You Like This Brand? (By totals, by age groups, by marital status)...
55
Question 4. What Store Did You Buy These in? (By
t otals)...4,0 . *.00 .0..0 5 7 Question
5.
WhY Did You Buy in This Store? (Bytotals, by age groups, by marital status)...
59
totQuestion
6.
Did You Buy Any Other Item When You Bought the Hosiery? (By totals, by age groups, by maiital sau)...--.6110. Question 7. Did You See the Hosiery You Bought Advertised in Radio and TV, Magazines, or
News-papers?(By totals, by age groups, by marital status)62 11. Question
8.
Did You Plan to Purchase These WhenYou Entered the Store? (By totals, by age groups, by marital status) . ... 64 12. Question
9.
What Points Do You Consider MostIm-portant in Buying Hosiery: Style and Fashion, Price, Wearability, Fit? (By totals, by age groups, by
marital status)...- - 66
13. Question 10. What Price Did You Pay for These
Stockings? (By totals, by age grouos, by marital
s t atus) . . . - - -
68
0 &M
014. Question 11. Would You Have Bought the Hosiery If the Price Had Been 20. Higher? (By totals, by age groups, by marital s-atus)...
69
15. Question 12. Do You Associate Quality in Hosiery with Wearaoility, Price, of Appearance? (By totals,
by age grou-s, b- marital status)... 71
16. Question 13. Did You 3uy These Stockings for a Special Occasion? (By totals, by age groups, by
marital status )...-.-.--- --- ---- - - * * .. . . 73
17. Question 14. Was the Color Chosen for a Snecial Costume? (8y totals, by age groups, by marital
status)...,...~ 74 18. Question 15. Do You Ever Buy: Mesh Stockings,Fancy
Heels, Clocks, 3utterflies, Rhinestone Trims, or Seamless? (3y totals, by age group-s, by marital
status)...,, 76
19. Question 16. Do You Wear Stockings in the Summer-time: Always, Sometimes, Never? (By totals and by age groups)... 78
20. ,uestion 21. 'Vhat Does Gauge and Denier Mean to
INTRODUCTION
-INTRODUCTION
The hosiery industry, at the present time, is faced with the problem of a buyers market for the first time in many years. During World War II there was a very consid-erable shortage of nylon hosiery. The manufacturers did not have much difficulty in selling whatever hosiery they
pro-duced. At the end of the war, there was an excessive demand for nylon hosiery. This resulted in a growth of hosiery manufacturers, thus expanding the field. In 1949 the de-mand of the war years slackened off and the hosiery indus-try found itself overexpanded. However, the commencement of the Korean war brought another upsurge in demand. At the present time the demand has again slackened off.
The consumer once more is in a position to pick and choose. The hosiery manufacturer must have the foresight ard knowledge to produce what the consumer wishes to pur-chase. He must sell his stockings in the most effective ways possible, whether it be through advertising, constmer educa-tion, better manufacturer-retailer-consumer relations, or improving his product in order to make it more attractive, efficient, or economical.
Every year approximately 1,600,000,000 pairs of stock-ings are sold. The hosiery manufacturers have the
capa-1. Aber, C.E., Women's Hosiery--Some Recent Market Trends, p. 2.
city to produce more. They want the women consumers of America to purchase more. In recent years, hosiery has been made sheerer and sheerer. Stocking colors have be-come more varied, and there have been attempts to per-suade women to wear hosiery in shades of red, blue, yel-low ard green to complement various costumes. At present, stockings are being manufactured with various fancy heels, butterflies and other small figures, clocks, ankle brace-lets, sandal feet, rhinestone, aid beaded trims. They are nand painted, initialed, woven in lace and mesh weaves, made with dark seams, or seamless. There are
stockings in short,medium,and long lengths for heavy or normal legs. There are stocking colors which are
especi-ally created to harmonize with costume colors.
The hosiery manufacturer and retailer tell the con-sumer about the attributes of their stockings through ads, window displays, and, at the actual point of sale, through salesgirls and counter displays. They want to know if the attributes which are part of their product are
the ones which will motivate the most sales. They want to know why women buy certain hosiery.
My thesis is an attempt to solve this problem. The scope and purpose of my thesis will be discussed in sepa-rate sections. I would like to mention here the past
perience I have had which has enabled me to successfully complete a thesis involving Market Reaearch. I have spent four years in the Department of Business and Engineering Administration, and I have taken courses in Marketing, Sales Promotion, Economics, and many others. These have helped me in my thesis work.
I would also like to acknowledge those persons who aided me in this work. My appreciation and most sincere
thanks are due many. To Mr. L. Ecker, of the Columbian Purchasing Co., who first interested me in some of the problems of the hosiery field, for his willing and able
indication of the ways to solution of the problem; to Professor T.M. Hill for his interest in my development; to Professor J.S. Cross and Mr. D. Sohon, I express my appreciation not only for their academic assistance out also for their personal encouragement. Finally, to Miss Joyce Maney and Mr. Ted Zembal,to whom I am deeply
grateful for the time they spent helping me to accomplish the many details which are attendant upon thesis writing. Their assistance enaoled me to enlarge the scope of my thesis.
6
PURPOSE
In the introduction to this thesis various attributes of woments stockings were mentioned, including fashion innovations, style factors, elements of fit, and weight. It was also mentioned that thle hosiery manufacturers wanted to know the relative importance to the consumer
of these attributes. In other words the "why" of consumer preferences.
This thesis is an attempt to answer, in part, the reasons why women prefer one stocking over another. It is also intended as an investigation into whether cer-tain characteristics of women, such as age and marital status, showed any trends toward particular preferences. In order to clear up the "why" problem it was felt that the purpose of this thesis should be to uncover what a consumer does, what she would do, and what she thinks about stockings. It was hoped that the thesis study would throw some light on defects in hosiery and reveal con-sumer demands by finding out what is in the mind of the consumer.
A more fundamental reason for this study and thesis work was to give to the author experience in organizing, conducting, and drawing reasonable conelusions from a
marketing research project. It was an opportunity to put into practical use the theoretical knowledge which has been acquired during four years of study.
Finally, it is hoped that this thesis, despite its limItations, will prove valuable to those in the hosiery field, whether manufacturers or retailers. Because the
subject is very broad and deep, it was impossible to of-fer an all-inclusive answer to the problem. The author realized there was little information on buying motives
in women's hosiery, and therefore he decided that his purpose would be to gain broad, general information on
a variety of subjects rather than specific, detailed in-formation on one factor of consumer motivations. Thus,
this thesis will perhaps serve as a starting point for other surveys of a more specialized nature.
9
SCOPE AND LIMITATIONS
The range of activities involved in achieving the purposes of the thesis included: reading background
mate-rial, writing a personal interview questionnaire which would cover a broad range of topics which the author felt were important, tabulating data, and,through inductive reasoning,drawing conclusions. How these activities were accomplished will be found in the section called pro-cedures.
The scooe of this problem was necessarily limited by many factors. An evaluation of the deficiencies of onets work is a difficult task, but the author feels that certain factors should be taken into consideration:
1. The author included only those factors which, after considerable research, he felt were most important. Since the subject is both broad and deep, it was impossible to develop an all-inclu-sive questionnaire, considering the authorts limited background and the time-limits neces-sary for personal interviewing.
2. The authorts experience in marketing research, both practical and theoretical, is limited,~and he had to learn as he went along.
10
and recommendations when a survey is concerned with people's underlying and sometimes unconscious motivations.
4.
This survey covered a female sample from the metro-politan Boston area. Because of conditions in down-town Boston, it was impossible to take a randomsampling. Therefore, the only check of the represent-ative qualities of the sample was the U.S. Bureau of Census.
5.
Age groups were estimated by the interviewer. It is possible that some estimates were slightly in-correct.6.
The interviewer had to rely on the thuthfulness of the respondent. This means he could never be posi-tive he was getting absolutely honest answers to the questions asked.7.
It is possible that the two interviewers evoked different responses from their verbalizations ofthe questions, although the questionnaire was care-fully discussed and practiced before the actual interviewing.
8. The questions were asked over a period of two weeks. This may not have been long enough to insure an even distribution of all those from the
metropoli-tan Boston area who shop downtown.
9.
The questioning was done in broken periods from two to three hours. This could have orevented the author from securing a continuous, representative sample.10. Metropolitan Boston is an industrial New England city with little rural population. It has a higher percentage of service, clerical, and industrial workers than the average city. The survey, there-fore, cannot be applied to the country at large with any degree of safety,
11. Statistical data at best is only a rough approxi-mation of the truth. It is important to remember that the results can only oe as reliable as the underlying data itself.
If the author had the time, facilities,and resources, his thesis could, of course, have been more valuable.
As it stands, the scope of this thesis, while limited, may still be of use to the hosiery industry, and certainly it was of use in developing the authorts ability to plan work ard carry it through in a practical manner.
CONCLUSIONS AND RLCOMMAENDATIONS
CONCLUSIONS AND RECOMMENDATIONS
The following notes are included here to clarify the understanding of this section:
1. Specific percentages can be found in both Ap-pendix A and Findings.
2. Not all results were included in this section;
only the more significant results were included. For more detailed results see Findings.
Conclusions: The majority of women in the study wore sheer stockings. Almost all the women remembered what type they bought. Only a small
percent-age did not. There was hardly any confusion of terms being used. The percentage of women wearing sheer decreased as the age increased. This decrease in the older group's was coun-tered by an increase in semi-sheer and ser-vice weights. About the same percentage of single and married women wore sheer. It would appear that the preference.for sheer, semi-sheer, or service weight depends mainly on the womants age group.
Recommendations: Those in the hosiery business should be aware of the percentages who wear the var-ious weights of stockings. By offering the right amounts of each type of stocking they could utilize fully the demands of all age groups. If the stores which stock hosiery have a clientele of a definite age group or
groups, they could vary their percentage of stock.
Conclusions: The attribute which women demanded most fre-quently and considered the most important
in buying hosiery was wearability. It was the major reason why they liked a particular brand, and it was most often included in their defintion of a quality stocking. As the age increases, the desire for wearabili-ty became more importqnt and also became a more frequent definition of quality. The matital status had little effect on the de-sire for wearability. Wearability, all clas-sifications, was far ahead of any o ther at-tribute. A rather high percentage of women bought mesh stockings for their wearing qualities.
Recommendations: Manufacturers and retailers should find this an important conclusion and become more conscious of the wearability factor. In all their selling activities--advertising, wdow and counter displays, sales talks, in-formative labeling, and pamphlets--they should
stress the wearability of their stockings to a greater degree. The manufacturer could make a greater attempt to increase the wearabili-ty of his product. However, the author realizes, and this questionnaire pointed out the fact
that women desire a sheer stocking which is, at the present time, impossible to produce with any guarantee of wearability. This points
to a definite need for consumer education, so that women will know what weight stockings will give the desired wear and how to care for their stockings in order to get the most wear from them.
Appearance ranks as the second most impor-tant factor which women like in a particular brand. As an attribute of a quality stocking, apearance also ranks quite high, second to wearability. However, woren rank wearability, fit, and price as more important than
appear-ance when they buy hosiery. This seeming con-tradiction can be partially explained by the wording of the question which asked which points the consumer considered most
impor-tant--the words "style and fashion" were used instead of "appearance". This may indicate that women care what the stocking looks like but are not interested in style and fashion features. As could be expected, the younger groups were most interested in appearance.
I'
This interest decreased as the age increased. Those who were single and married gave more weight to appearance than did those who were widowed or divorced. To return to question 1,
the large percentage who interested in sheer indicates that they were interested in appear-ance.
Recommendations: The survey shows that the appearance of the hosiery--a good looking stocking rather than one with fashion features--should be considered important. It appears, at the present, that hosiery manufacturers and
re-tailers are aware of the importance of ap-pearance. In fact, in many ads and counter displays too much importance, perhaps, is placed on appearance.
Conclusions; Few women buy different stockings for a special occasion. A larger percentage chose
the color of their stockings to match a special costume. Neither of the percentages was as high as could be expected. There is no appreciable difference by age and mari-tal status for women who buy for a special occasions There was a noticeable lack of
buy-18
ing colors for a special costume. Such fashion innovations as clocks, butterflies, and
,rhinestone trims attracted a very small per-centage of those interviewed. The fashion factors which have won a greater degree of
acceptance are fancy heels and seamless stockings. The preference for fancy heels declined as the age increased. Those
65
andover bought only in one classification--fan-cy heels.
Recommendations: At the present time, there is a good percentage of women who buy fancy heels and
seamless stockings. There seems to be a po-tential market to which these fashion inno-vations can be stressed. However, more
radi-cal innovations seem to gain little accept-ance. It is difficult to deduce whether this negative attitude is a result of poor promo-tional activities or actual dislike by the consumer. The fact that few women buy stock-ings for special occasions leads the author to recommend that more consumer education about the suitability of various types of hosiery for different occasions is needed.
If the manufacturer and retailer wish to sell more stockings they could perhaps stress color in hosiery as a vital part of fashion and as being essential for a well-dressed ap-pearance.
The largest per cent of women in this survey paid between $1.00 and
$1.24.
An extremely small percentage of women could not remember what they had paid. The author concludes that all women are price-conscious to some degree. A little more than half the women would have bought the same hosiery if the price had been 20% higher. This means that these women con-sider other attributes more important than price and would not object to the point of buying a different stocking if the price were raised. The married women were less willing to the 20% higher price. A fair percentage of women said they considered price as -an im-portant factor in buying hosiery. Price was most imoortantto those widowed or divorced. Women did not list price as an important rea-son when asked why they liked a particular brand. This ,my be because most brands offer Conclusions:a varied price line. Price did not seem to enter into a definition of quality in a high degree. This may be result of thinking of price in terms of saving money rather than
spending it,
Recommendations: Price is a factor which should be con-sidered by hosiery manufacturers. However, price is not a prime factor. In the Boston area, there seems to be greater emphasis on Price cutting and bargains. It may be possible that such a policy is not too ef-fective. Because a pair of stockings never amounts to an overly large expenditure, even in the highest qualities, price may be less important than other factors. Perhaps more manufacturers could produce a stocking in
the .1.00 to $1.24 range.
Conclusions: Fit was considered the second most important attribute in buying hosiery. The desire for a good fit was most important to those single and least important to widowed or divorced. Fit was mentioned in only one question, and there it was an answer suggested by tho in-terviewer. When the answer was voluntary;
there were few references to fit. However, when the respondent was reminded of fit as an attribute her opinion of its importance was raised.
Recommendations: Fit is not often stressed to a great de-gree when marketing hosiery. The consumer needd to be reminded of the imoortance of fit as an attribute of hosiery.
Conclusions: About half the women didn't know what brand they bought. This would seem to indicate a great lack of brand consciousness. National brands ranked next in order to the "don't knows"; store brands were half as large as national brands.
Recommendations: The hosiery industry should intensify its work in trying to get women brand conscious and to educate them that there is a difference between brand stockings.
Conclusions: The majority of women bought their stockings in department stores. The reason they bought their hosiery in any particular store was l largely habit and convenience. This seems to show that women buy mainly out of allegi-ance to a store rather than shopping around for the best values. This relates to their rating of price as a less important factor.
A little more than half of the women shop for hosiery alone. The rest buy other items
at the same time. As the age increase, the percentage who buy other items at the same time increases. Those single shopped more often for hosiery alone. Mostof the res-pondents planned to purchase hosiery before
they entered the store. This would exclude any high percentage of impulse buying among hosiery customers. The percentage of impulse buyers is large enough to be considered, how-ever.
ons: Those in the hosiery industry should be aware that women plan to purchase before they enter a store and selling messages should reach them before this point. Manufacturers should also endeavor to get their hosiery into de-partment stores as well as specialty shops, for it is in the department store that the majority of women buy their stockings.
The greatest percentage of women did not see the hosiery they bought advertised anywhere. For those who did see hosiery advertised, newspapers were the most effective media. Recommendati
Magazines and TV were respectively lower. The percentage who buy in a particular store be-cause of the advertising it does is extremely low. For those who did not plan to purchase hosiery when they entered a store, counter displays were the maost effective inducement to purchase.
Recommendations: These results may possibly indicate that hosiery advertising is not as effective as
as it could be. The author feels that the results may point out a need for a greater development of consumer research which will
guide advertising to a proper exploitation of its potentials.
Conclusions: A little more than half the women always wear stockings in the summertime. A small percent-age never wear them in the warm weather. The rest wear them sometimes. There is a definite relation between age and how often women
wear stockings in warm weather. As the age increases, the sometimes and never answers decrease and the always answers increase. A-iiong the younger people many feel that it
Recommendations: Perhaps the hosiery industry could sug-gest to the consumer that she is not correct-ly dressed without stockings. This might re-tard the growing trend of not wearing stock-ings in the summertime.
Conclusions: The highest percentage of women thought gauge and denier meant sheerness and threads per inch. The next highest percentage did not know what the terms meant. Only a very small percentage knew the correct technical meaning.
The highest percentage of dontt knows were in the
65
and over age group.Recommendations: Gauge ar denier are inDortant terms in describing hosiery. Manufacturers and
re-tailers should realize that consumers need more education on technical hosiery terms
so they will know how to purchase exactly what they want, and thus will not be disap-pointed in the attributes of the hosiery
PROCEDURE
Marketing research, in order to be successful, should be organized in logical steps which follow each other in a methodical manner. Such an organization has been attempted
in this thesis. The method used encompassed the following basic steps:
A. Informal investigation and situation analysis B. Planning the investigation
C. Securing the information
D. Assembling, organizing and classifying data E. Analysis and interpretation
F. Preparation of Report
G. Follow-up
I,
25&
2(9
A. INFORMAL INVESTIGATION AND SITUATION ANALYSIS
In order to get a feel for the particular problems of the hosiery industry, a preliminary, rapid examination of the data available from printed sources was made. The author
talked with people in the industry, those who manufacture and those who sell hosiery, thus gaining valuable insight into the field. This investigation revealed that one of the most interesting oroblems of hosiery retailers and manufacturers was the reason why women buy hosiery. During
the war it was not necessary to delve carefully into buying motivations because nylons were so scarce. In the past year, competition has increased tremendously, and hosiery manu-facturers and retailers have become more interested in
sell-their product. Much of the hosiery industry's advertising of late has featured fashion innovations to arouse the woman-consumer's interest in buying more hosiery.2 The hosiery in-dustry wants to know if such appeals are effective, and, if not, just what makes a woman buy a certain stocking rather than others.
1. The author spoke to Mr. L. Ecker, statistician, MKM Mills, Miss A. Daniels, Mrs. M. Thorton, managers, Ring Clear
Ho-siery Store, Mirs. D. Roark, owner, Specialty Store, Mr. B. Gordon, owner, MKM Mills.
2. The author rea. ads on hosiery in a large variety of maga-zines and newspapers over a period of several weeks.
2r
Upon continuing the situation analysis, it was discov-ered that there was little information on what effect prod-uct characteristics, consumer characteristiday and market characteristics had on the motivations to buy hosiery. Be-cause of the exhaustive nature of a thorough study of all the trends in the hosiery industry, the investigation was lim-ited to a study of other consumer surveys and a brief histor-y of stocking fashions, output, and sales. It is believed that a thorough investigation of what data was available was made. After this examination, it was decided that one of the most valuable and profitable problems to survey was buying motives in women's hosiery.
its
B. PLANNING THE INVESTIGA TION
After the preliminary investigation had been made, the problem was defined. It was now necessary to plan a survey operation. There are many different ways of obtaining information for a survey, such as observations, mail questionnaires, telephone questionnaires and per-sonal interviewing. In this problem, the author decided to use personal interviewing. Personal interviewing is cheaper, because the author could do it himself, and the percentage of answers to such interviews is usually high.
It also permits the interviewer to vary his approach for different types of people, thus enabling him to judge the characteristics of the person and at the same time get the fullest value from each interview. Ther interviewer can size up the reaction of those answering, and, if neces-sary, reword a question in order to secure the maximum information from each. The greatest disadvantage of this type of interviewing is that it sometimes has to be done in haste.
The type of information which was considered desirable was:
1. What a person is or does (characteristics, behaviour) 2. What he knows (knowledge)
By getting these three types of information it was ffelt that the author could better delve into the many mo-tivations behind the purchase of a pair of stockings. The motivations could not be secured by simply asking the
ques-tion "why?". There are so many things; habit, supply, predelictions, and other factors which contribute to the decision to purchase. Thus, in order to know some of the reasons, it is necessary to get at some of the individualis characteristics (age, social backgnound, marital status, economic position), the knowledge of the product she pose
sesses, and what her attitudes towards the product's at-tributes are.
In order to achieve the goals of this study, which were mentioned in the scope, it was necessary to determine a
proper sample to interview. A correct sample is required because the examiner wishes to obtain a proper cross sec-tion of all the people concerned in the proolem. It was hoped that the attitudes and opinions of the sample mem-bers ould be representative of the whole population. In considering what the sample should be, it must be kept in mind that the author was faced with limiting ffactors of time
and distance. The population which could be reasonably stu-died was necexsarily in the immediate area of Boston. Due to the limitations already mentioned, downtown Boston was chosen as the area in which the survey would be taken .
~30
Specifically, the area covered would be in and/round Washington Street and Sumner Street, and along Tremont Street. Because this area is so thickly traversed, a mixture of people from all the outlying areas and of diverse backgrounds would be found in this area. The time of the survey was to be varied in order to get a more representative distribution of those who bought in Boston stores. It is realized that this possibly does not give a true miniature of theitotal population under study. However, it was believed that the characteris-tics of those interviewed could be checked with census figures which would, to a certain degreeshow their rep-resentative qualities. The sample was to be chosen in
a random manner. It was originally planned to ask one out of every three women who passed by. This proved
impossible, and will be discussed under the section called SECURING THE INFORMATION.
Certain characteristics of the population were known, such as percentages by age, marital status, and
occupa-tion. These figures were secured from the U.S. Bureau of Census tables. (See charts in Appendix C) The age factor was controlled. No girls below fifteen were
ques-tioned, and after the survey had progressed, checks were to be token according to the percentage of women in each age group.
The sample taken was as large as possible. It is realized that a larger sample might very well be more ac-curate. However, the comparison of the population data with the corresponding sample data shows a close correla-tion. Such a test cannot be construed as a fool proof check, but does give some indication of accuracy.
TLhe next problem was to draw up the questionnaire, of a personal interview type, which could be used to question the sample group, and which would throw some light on the aggreed upon problem. It was necessary to formulate ques-;ions which would get behind the first-degree reason for buying stockings (because they need them); which would delve into factors of preference. Problems which confront
the questionnaire writer.include such considerations as; How many questions should there be? Just what questions should be asked? How shall the subject be introduced? How can the questions be phrased so that they will permit little misunderstanding? What questions should be asked
1. about the person's characteristics?
The characteristics of a product must be thoroughly understood before the questionnaire can be formulated. Attributes such as size, shape, color, utility, price, technical knowledge and characteristics of style bear on
the formation of effective questions. The author was not
too familiar with some aspects of women's hosiery. A woman's viewpoint was considered necessary, therefore,
the aid of a friend was used to familiarize the author with the possible attitudes that women might have towards buying hosiery.
How many questions should there be?
Because of time limitations, it was necessary to re-strict questions (there were numerous possibilities) to those which could be answered in a period of between five and ten minutes.
Just what questions should be asked? How should the ques-tions be phrased to permit a minimum of misunderstanding? In what order should the questions be asked? Vhat ques-tions should be asked about the person's characteristics?
The questions were arranged in an order in which the author could foresee the least difficulty in answering. A series of questions were placed at the beginning which would direct the respondent's train of thought to her ho-siery buying habits. It was thought that by building up a correct pattern of questions the respondent would be better prepared to answer the more important motive
ques-tions.
The questions were formulated after studying adver-tising appeals, manufacturers and buyers opinions on wha# factors motivate preferences, and after discussing hosiery appeals with women acquaintances. Whether these questions
33
were effective or not could not be judged until the questionnaire was pre-tested. This pre-testing would also aid in phrasing the questions f or a minimum amount of misunderstanding and loss of time.
After the questionnaire was ptested it was re-worded. This procedure was continued until three drafts had been made, The third draft was checked by the
Research Manager of Filene's, Mr. Brown, and by Professor Cross. This resulted in a fourth draft which was consid ered final.
At this point I would like to discuss the actual choice of questions. These questions were drawn up to fincjut what a consumer did, what she would do, and what she thinks, in order to get at the core of the question why? .
In the first draft of the questionsthe interviewee was requested to recall all her purchases of stockings and
give generalized answers to all questions. This did not prove feasible, because, in pre-testing, it was found that women could not co-ordinate and generalize their buying habits into useful and coherent answers. For this reason, it was decided, in the second draft, to ask questions about the last purchase in the beginning. come of the later ques-tions would still be of a general nature. Upon testing, it was found that women could recall their last purchase and make satisfactory replies.
The next section will be devoted to discussing the reasons why these particular questions were chosen.
1. WNas the last hosiery you purchased sheer, semi-sheer, or service weight?
This first question gets the respondent thinking a-bout her last purchase. It is a simple question, there fore it would not antagonize the respondent by making her think too hard at the outset of the interview. It was also worded in order to find out whether there was
any confusion of terms in reference to sheer, semi-sheer and service weights, and if there was a definite prefer-ence for any specific weight.
2. What brand did you purchase?
This follows, in logical sequence, the first question. It was intended to bring out the significance of brand names as a motivation, and also to see if there were any brand preferences.
3.
Why do you like this brand?This introduced a why question rather early, but it had to be related in the respondent's mind with question 2. This was the first definite motivation question, and the motivations were checked with later questions. The respondent was free to give a first impulse answer, and
space was left for a long answer. It was hoped that a va-riety of answers would be recieved and also that brand im-portance could be estimated. it wadtrictly an opinion
question of an impulsive nature.
3-r
4.
What store did you buy these in?It was thought at the time that information about the type of store in which women bought hosiery would be sig-nificant. It was also necessary to lead into question
5.
5.
What influenced you to buy in 'this store? (or any store)? Habit and convenience? Values they offer? adver-tising?This was an important motivation question. Was the the women consumers' mind primarily on the attributes of the stocking or did she buy simply because of allegiance to a store2
6.
Did you buy any other item when you bought the hosiery?It was hoped that this question would indicate how many women shopped for hosiery primarily and whether the motivation to buy hosiery is sbrong enough to induce a special shopping trip, or whether hosiery buying is simply incidental during a shopping trip.
7. Did you see the hosiery you bought advertised on Radio and TV, in magazinesor in newspapers? The author sought to find out how much of an effect advertising has on women's buying motives and also which advertising media are the most effective.
3(6
the store? If not, what caused you to buy them? Window displays? Counter displays? Other?
The author wished to find out how often hosiery buy-ing was motivated by an impulse. If impulse, the question was so worded that it would rate the effectiveness of win-dow and counter displays.
9.
What points do you consider most important in buying hosiery? this was a straight motivation question with answers to be suggested by the questioner. it wasa check on the general answer in question3, and it would give relative values to the attributes which the hosiery industry felt were important.
10. What price did you pay for these stockings? This question would show to what extent women were price conscious. Also, it would reveal trends toward lower or higher priced stockings.
11. Would you have bought the hosiery if the price had been 20% higher?
If women were highly price-conscious, to the point where price was a strong motivation, this question would reveal such tendencies.
12. Do you associate quality in hosiery with weara-bility, price, or appearance?
really fine stocking irerms different than she did of thestockings she ordinarily wore, or if her motivations were always the same. A limitation of this question was
the possible difficulty in' defining "quality".
13. Did you purchase these for a special occasion? Are women motivated to buy different stockings for a party, a shopping trip, or for work? Are they motiva-ted to buy a new pair of stockings for something special?
34.
Was the color chosen for a special costume? Will colors motivate a woman to buy more stockings? Does she wear different stockings with different clothes? How important is the "byle factor in buying stockings?15. Do you buy mesh stockings, fancy heels, clocks, butterflies, seamless, or rhinestone trims?
This was formulated to find out yh ether women actually
buy stockings which have fashion innovations, and also how many buy out of the ordinary stockings , such as mesh and seamless.
16. Do you wear stockings in the summer time -
al-ways, sometimes, never?
!he author wished to find if there was a trend away from stockings in the summertime or in warm climates. It would be significant to see whether women still feel it is not correct to go barelegged.
The next four questions were characteristic quest ions which could be used to check the sample against Census per-centages.
17. How many are there in your family including yourself?
18. Are you single - married (widowed, divorced)? 19. What is your occupation?
20. What is the head of the household's occupation? It was the interviewer's responsibility to determine the respondent's age, since such a question cannot be
asked with any large degree of success.
21. What does guuge and denier mean to you?
Gauge and denier are important terms in describing the attributes of stockings. How many women knew what this term actually means?
.he questionnaire, in finished formcontained twenty one questions, some with more than one part. It is realized that such a questionnaire is lengthy, but the questions
were 'trded so they could be asked in the most rapid manner possible, and were carefully pretested to prevent
misunder-standing.
How shall the subject be introduced?
There were two interviewers - the author and an assis-tant. At first it was decided that one out of every three passers-by would be interviewed. However, upon attempting thi.s, 1pny difficulties were encountered. There were far
too many women about to enable keeping an accurate count of one out of every three. It was also impossible to stop women when they were moving on the street. The in-terviewers concluded that they would question women where they were temporarily stopped, in front of window displays or in store doorways. this method proved more fruitful.
The approach to be used was, "Pardon me madam, Erm doing a thesis at M.I.T. on woments hosiery, and Ild like to ask you a few questions that won't take long.". If the woman hesitated the interviewer was to add that the questions were not of a personal nature, and repeat once more that it would not take too long.
C. SECURING THE INFORIATION
During the actual interviewing, the interviewers found it expedient to change and reword some of the
questions. Because the questionnaires were already prin-ted, these changes were made verbally. The changes ap-pear in printed form in the fifth draft in Appendix C.
In general, the planned introduction worked well. It was found, however, that "Pardon me madam, I'm from M.I.T., and I'm doing a thesis on why women buy hosiery. Itd like to ask you a few questions", was even more efect-ive. If the woman hesitated the interviewer asked the first question and usuAlly was permitted to continue. Some of the women gave the impression, towards the end of the interview, that it was too lengthy. The majority seemed pleased and interested in the survey, too the point where they took up too much of the interviewers' time in comments and advice.
As has been mentioned, arandom numerical sample could not be taken. For this reason, the interviewing was taken in periods of two to three hours over two weeks.
SCIEDULE
Monday morning - evening
ruesday morning afternoon
Wednesday Thursday Friday Saturday morning morning noon afternoon afternoon afternoon evening
The areas were selected in an attempt to give dif-ferent income groups, and the interviewers shifted
posi-tions during the questioning periods. In this manner it was felt that the chance of getting a more representative sample would be possible because it was thought that the wide selection oidays and hours would capture most of those who normally shop in the downtown area.
It was seldom necessary to re-define the questions because it was found they were worded clearly. If the respondent was allowed to read the questionnaire it was found that the questioning proceeded more rapidly.
Generally, the questionnaire proved a successful means of securing the desired information.
42.
q
D. ASSEMBLING, ORGANIZING AND CLASSIFYING DATA
After the questionnaires, 253 in all, had been taken, the next step was to bring all the material together,
organize it, classify it, and then draw logical findings and conclusions. This involved a series of steps which include:
Editing data Testing sample Tabulating data Editing data
The editing was done to check for errors and omissions in the questionnaire and t'o check for any misunderstandings. This was done after each group of interviews had been made. Testing sample
The sample was tested for proportionality against the U. S. Bureau of Census data. The first test was for ager (See Chart 1.) The sample age groups were close to the Census percentages. The largest errors were in the
25-34 group which was plus
5
and in the65and
over group which was minus 4.2%.The marital figures had errors of plus 11.4% for single, minus
5.4%
for married, minus4.0%
for widowed or divorced.CENSUS
Vi
-SAMPLE
30 2 5r4
AGE GROUPS
R SUS
AGE GRPOUPS
Ct~NSuS SAMPLE 25-34 45-44 45'-64 "43
CHA RT
650'Aovet 15-24CHART
2
SAMPLE
re0 40 30 20 10 0 SINGLE~CENSUS
.SAMPLE
"60 50 CENsus SAM PLE MARRI Dwa
00WI0 OR
STATuVS
STATU
S
DOVORCCOCHA
RT
orwfrI Nor RrPOftrf o REtR ED OR UNALE : HOUSEWEFEIN LABOR FORCE * NOT IN LABOR FORce
.E90ALS .17-S * .7. C NaELIGiseL)
CENSUS
MARWITAL
VERSUS
MARITAL
STATUS
STATUS
E'MPLOY
MENT
Vri~svs
EMPLoYMrNT
E~MPLOYEOD-*(uivc'mpL'oye7o
Tabulating data
Tabulation was first done generally on each question in order to totals. The next was a cross-tabulation by age groups and then by marital status. All these figures were cross-checked and carefully classified. The complete tab-ulations may be found in Appendix A.
E. ANALYSIS AND INTERPRETATION
After all tabulations were completed, analysis and interpretation was done. By studying the tabulations the
author could arrive at the relative weight of the information, and how it could be used to solve the problem. In this
analyzation some of the various classifications of motivations were narrowed into major reasons. From the tabulations and
general classifications of what was importAnt, summary graphs were made up and are included in the findings. After the
graphs had been drawn up, they were studied and interpreted. Results of this interpretation are include in the findings.
G. FOLLOW - UP
The author regrets that an extensive follow-up of his thesis was not possible. Due to limitations of time, distance, and money, his thesis could not be presented to
those in the hosiery industry who might find it helpful. F. PREPARATION OF REPORT
The report was prepared in accordance with thesis
regulations. The first step was to outline the material.
Then the scope and purposes of the investigation were devel-oped. Then the description of the method and procedure used was written up. The graphs were included in the findings and
the tables in the appendix. Finally, from the results in the findings, conclusions and recommendations were drawn up and placed in the beginning of the report.
k
FINDINGS
The following notes are included here to explain the use of the FINDINGS that follow:
1. If the total percentage to a given question is greater than 100%, some persons gave more than one answer to the question.
2. Only significant results will be included in the FINDINGS.
3. For a complete list of every answer to every question see Appendix A.
4.
For accurate percentage used on charts (graphs) see percentages for a given question in Appendix A.50
QUESTION 1. WAS THE LAST HOSIERY YOU PURCHASED SHEER, SEMI-SHEER, OR SERVICE WEIGHT?
The results of the question show that the majority of women in the sample wear sheer (54.2%) or semi-sheer (30.8%). Only 14.6% wore service weight. Most of the women remembered what type they wore. Only
.4%
didntt remember. There seemsto be little confusion in terms which are descriptive of weight among the women in this sample.
As could be expected, the 15-24 age group wore mostly sheer (73.5%), and as 'the age increased, the percentage of sheer decreased, while semi-sheer and service weights in-creased. Among the three younger groups there was little
percentage difference in those who wore sheer (11% difference). From the
44-65
and the65
and over age groups thepercent-age who wore sheer declined considerably, being 33.8% and 24.0% respectively, while semi-sheer and service weight went up.
Both single and married women wore a large percentage of sheer, but widowed or divorced wore less. Married wore
55.5,
single57.7,
widowed and divorced35.7
per cent.There is a correlation between the first three age groups and those who are single. 83.5% of those who are single come from these first three groups, so the first three age groups
and those who are single both had high percentages of sheer stockings. This correlation does not follow for the married
QUESTION
I.
WAS TRE LAT
H
PURCHAIED SHEER, $EMI-SHEER, OR
To4ALS
.0OSIERY
SERVIcE
CHART 4You
40 20 0SHEER SEMI- SHEER
SGRVICE-AGE GROUP
35-44 44-CA C54to SHEERBY MARITAL
0 S H rr SE~Mi- SHEERSTATUS
*-( DoN'T REMEMBER EQuALS .4- %-NEGU4lSLE)
BYeto 800 so 40 40 SERVICE' 5INGLE MARRIED 01w*lJ'CE0 SEevi
ctE-group, because only
57%
of the married group are in the first three age groups. This fact alone would not account for the high percentage of sheers among married women. It would appear that of all age groups those who are married have a high preference for sheer with the last two age groups.It would appear that the preference for sheer, semi-sheer, or service weight depends mainly upon the womants age groups.
QUESTION 2. WHAT BRAND DID YOU PURCHASE?
About half the women (49.0%) did not know what brand they bought. This would seem to indicate a great lack of brand consciousness. National brands ranked next in order
(35.6%)
to the dontt knows; stoke brands were bought in the smallest quantities, comprising only 15.4%puESTION
.
WHAr
BRAND DD
YOU
3uy?
TOTA.-40
30
.ao
QUESTION
3.
WHY DO YOU LIKE THIS BRAND?Performance ranks first as the reason why women like a particular brand (49.7%). This category includes such ans-wers as comfort, fit, and wears well. (See Appendix A, question 3 for further breakdowns of answers as given by respondents.) With the older groups this reply was general-ly higher.
The cost of the stockings does not seem to play an im-portant role; only 7.1% listed it as a reason.
The number who didn't know was significant--21%. It seemed that many women had no particular reason for buying a brand. This is probably related to the percentage in ques-tion 2 who couldn't remember what brand they had purchased. Possibly women are not conscious of brand names and their specific attributes.
Appearance as a factor decreased as age increased. With the 15-24 age group the percentage was high
(30.6%)
compared to the other four groups.Cost factors decreased as age increased.
Whether mnaried, single, or widowed-divorced made little difference in appearance and cost, but those who were married were more interested in performance than the other two
groups.
CHART 6
UfESTION
J.
W&Y DO YOU LIKE TIAIS
BRAND?
TOTAL S
40
20
APPEARANCE PERf;VRM4NcE CoST OTHE R DON 'T KNOW
GROU P
APARANCE PERFORMANCC COS~T Dcw'T KNOW OTiHR
E>Y
MARI
TA L
GOSTATUS
St4GLE~ MARRIC-0 WIDoCE'D j>iyvdcE7DAfPEMAWCE PERFORMANCE C o6 T DoN r KtIo' O
BY
AGr
too
10
was a more important motivation than either appearance or price.
QUESTION
4..
WHAT STORE DID YOU BUY THESE IN?The majority of the women (66.0%) bought in department stores. Both Filendsland Jordaills have very high percentages of the purchases among department stores, as would be
expected because of the area in which the interviews were taken. This question has little bearing on motivations in the author's opinion, except that department stores might have a larger selection of hosiery from which to purchase.
K
~L 44.
ST1N
7~jjIP;TAUD
OL 70 I-4N,
DF-^OtME"r Tott, sPitc iALty s1Ae- Orof~
~-1
I
-tI
>4
II
I
-i
QUESTION
5.
WHY DID YOU BUY IN THIS STORE?The results of this question were not what the author had originally expected. Habit and convenience were the main reasons why women bought their hosiery in a particu-lar store (73.5%). It would appear that hosiery is a con-venience rather than a shopping item. Women seem content to buy their stockings in the store which is most convenient or which is where they usually shop. It must be kept in mind that the store in which they shop from habit may be so
because of the values they offer.
The reasons were very much the same for all age groups. The percentage for advertising was very low for all groups. The values they offer category was low, but considerably higher than advertising. Hosiery advertising seems to af-fect the woman-consumer very little.
Surprisingly, the married group's percentage was low-est in the values they offer category (25.8%).
'69
CHART
8
9UESTrION
5. WHV
DID
You
BUY IN
THIS STORE?
TOTALS
G0
40
NABIT f
COiVENI ENC
ADVE'RTI 6G VALWE5 T~h+E( YOri4
OFFER REAoNS
0 0
AGE
G~ROUP
0ro so mi HAblr * CONVE14IENCE:ADvonr WG VALUES THEY OFrER
BV
MARITAL STATUS
co
40 HAS 1 T ADVeRTI-SINCN COAVENIENCE 0ThER ii4so5ms SINGLE' MARREO WI 0wED VALU#rS -EY OFFeR OTHERREAISONS
15'- 214-35-44 4 :Co
QUESTION
6.
DID YOU BUY ANY OTHER ITEM WHEN YOU BOUGHT THE HOSIERY?The number who shop for hosiery alone is greater (53.7%) than those who buy other items at the same time. These per-centages are quite close, so no definite conclusions can be drawn.
More of the older groups shop for other things. The two youngest groups shop more for hosiery alone.
Married and widowed or divorced shop for other items besides hosiery.
QUESTION 7. DID YOU SEE THE HOSIERY YOU BOUGHT ADVEP. TISED ON RADIO & TV, IN MAGAZINES, OR IN NEWSPAPERS?
The greatest percentage of women (67.246) did not see the hosiery they bought advertised anywhere. It is surpris-ing how many women claimed they had not seen any advertis-ing. This question was worded to include any time when the purchaser could have seen ads of the stockings she had last purchased.
Newspapers are the most effective media (26.1%). Maga-zines and radio and TV were respectively lower. The per-centage who saw ads in newspapers is high enough to be en-couraging to advertisers.
CHART
9
QUESTION
G.
DID
'YOU
BUY ANY OTI4ER ITEM
WHEN
YOU 8GH
T
THE
HOSIERY
TOTAL
s.
6o
DON'T REMEM SER
AGE
GgouP
is- 243&-44 45-.-G4 DoNP' 1 , ROMEM6EIt
BY MARITAi.
-s. 60 40STATU
S
MARRtED 1> elayr WI oowEfc DoN" r REMEM BER 40 YES NO 60 60 40, YES NO No;UESTION
7.
DID
BOUGHT
ADVER1iSED
OR NEWS PA
PritS
TOTAL S
ToA s
CHART
1oYOU
SEE T14E
HOSIERY
YOU
IN
RADIo AND
TV
MAGAZINES,
+0
RAD14o 4 TV MA6AZff4FS NEWSPAPERS Dio NOT SF
AGE
GROUP
SY 16' 24 35--44 4 4 ' rv6loKw 0RADIOLT & 'YIAGAZINE5 NEWS PAVPERS DID WA1r sEE
MARMIAL.
StNG.LE MARIitro WpOWIED D 146 Wiltr RADIO 4- -ry51rAV 5
NEWSPAPERS Dio NoT~ SEC
C2
By
so
Go
The highest percentage of women who read newspapers
was in the
65
and over age group (36.0%).The single women had the highest percentages in maga-zines (11.4) and in newspapers (28.9%).
QUESTION
8.
DID YOU PLAN TO PURCHASE THESE WHEN YOU ENTERED THE STORE?Most of the women interviewed planned to buy their hosiery before they went into the store (80.3%). The first four groups were similar--all had high yes percentages.
65
and over varied from the rest. A lower percentage saidyes (64.0%) and a higher said no (36.0%). The majority
of those who were single (82.6%) and married (81.3%) planned to buy hosiery. The percentage of widowed and di-vorced was smaller.
For those who did not plan to purchase hosiery, counter displays were the greatest incentive (56.00). For those in
the 15-24 age group counter displays persuaded 80.0% to, bpy.
pUESTiON
8.
TMI$r
WMEN
YOU
TOTALS
%
DiD You
.fNT eRrQ
YESPLAN
THE'CH8ART
iiTo
PURCHASE
STORE?
NOBY
AGE
40 4o 20GRoUP
'~-a
435-4 *5-G ~Vv YES NOBY
MARir0
L.
40 401 sTATUs 64-51NGLf~ NO w I paire*oo DIvoQUESTION
9.
WHAT POINTS DO YOU CONSIDER MOST IMPORTANT IN BUYING HOSIERY: STYLE AND FASHION, PRICE, WEARABILITY, OR FIT?Wearability, by far, was the most important factor (67.2%) with fit a second (32.0%). Price with 26.4% has gained in importance since question
3.
The desire for wearability increases as the age increases. With increasing age the importance of style and fashion
de-creases as does price, in general. Fit seems most important
(43.5%)
to those in the 35-44 bracket.Wearability is equally important to married (68.7%) and single (68.0), less important to divorced. Both style and fashion and fit are more important to married and single
than to widowed or divorced. Price is more important to widowed and divorced. Wearability is the most important factor for all groups.
c
CHARr
la
qUP
TION
IMPO?TANT
#N
9.
WHAT
Potrs
no
you
CONSIOCR
MOsT
BUYINWG
HosteltY :
sTY.LE'
AND
FASHION,
PRICE7, WEARABILITY, Fir
?
TOTALS
40
.5TYLE 4 PRICE FASHIONAGE~
GROUf
40WEARA1It3ITY FIT OTHER
35-44
45-"4
STYLE * O-AsHI0N
BY
PRICE WEARAILTY FIT
MARITAL
SrATUS
SINGLE~
U
MARRICD Wt ~o Diva-CE 40 .STyL & fASH'IONPRICE WEARAB giTY
(* OTER 'Nor s5oWNT - evE/sE5 -roo SMALt) OTHER