Challenges Facing Agriculture: Evaluation of the Impact of AgTech,
Recommendations, and Opportunity Identification in Food Waste Reduction
By
Guillaume Defrance de Tersant
Master in Management (2016)
HEC Paris
Submitted to the Integrated Design and Management Program and the Department of Mechanical Engineering in Partial Fulfillment of the Requirements for the Degrees of
Masters of Science in Engineering and Management and Masters of Science in Mechanical Engineering
at the
Massachusetts Institute of Technology
June 2019
2019 Guillaume Defrance de Tersant. All rights reserved. The author hereby
electronic copies
Signature of Author:
grants to MIT permission to reproduce and to distribute publicly paper and of this thesis document in whole or in part in any medium now known or
hereafter created.
Signature redacted
Certified by:
Integrated Design and Management Program Depatrqent of Mechanical Engineering
(S
ig
nature redacted
May 7th2019
( Accepted by: Executive Director, Accepted by: MASSACHUSETTS INSTITUTE OF TECHNOLOGY
2
-2019
LIBRARIES
Douglas Hart, PhD Professor of Mechanical Engineering Thesis SupervisorSignature redacted
thew S. essy Integrated ramSignature redacted
I
Nicolas HadjiconstantinouChairman, Committee on Graduate Students
77 Massachusetts Avenue Cambridge, MA 02139
http://Iibraries.mit.edu/ask
DISCLAIMER NOTICE
Due to the condition of the original material, there are unavoidable
flaws in this reproduction. We have made every effort possible to
provide you with the best copy available.
Thank you.
The images contained in this document are of the
best quality available.
Challenges Facing Agriculture: Evaluation of the Impact of AgTech, Recommendations, and Opportunity Identification in Food Waste Reduction
By
Guillaume Defrance de Tersant
Submitted to the Integrated Design and Management Program and the Department of Mechanical Engineering on May 7th, 2019, in Partial Fulfillment of the Requirements for the Degrees of
Masters of Science in Engineering and Management and Masters of Science in Mechanical Engineering
Abstract
Global food production faces severe challenges that will test the world's ability to mobilize technology, industry participants, and governments to develop a sustainable response. Feeding a
growing population and accommodating for rapidly evolving diets calls for a significant expansion in production. Progress is needed to help produce more with less, limit the
environmental impact of chemical inputs, and curb agricultural greenhouse gas emissions. The agricultural workforce is facing increasingly challenging economic conditions, a lackluster generation of new producers, and industrywide labor shortages that threaten the continuity of food production. Innovative systems are crucially needed to boost productivity, while protecting natural resources and sustaining a vital workforce. In the past decade, Agriculture has witnessed the rise of a novel proponent of such systems stemming from an unprecedented wave of
investments, innovations, and entrepreneurial ventures, referred to as AgTech for the purpose of this work.
The aim of this work is initially to analyze the most pressing challenges faced by global food production, communicate on their magnitude, and highlight opportunities for innovation. In parallel, this work aims to increase awareness on the magnitude of food waste and loss, and present opportunities associated with food waste reduction and prevention. Then, this work will briefly define AgTech, present its benefits, and evaluate its impact on the food production industry. Based on this evaluation, limitations of AgTech will be presented, and industrywide recommendations to enhance its impact will be proposed. Finally, this work will propose a concept to reduce food waste in agricultural production.
Thesis Supervisor: Douglas Hart
Acknowledgments
This work would not have been possible without the amazing support of many exceptional individuals that I have met during my time at MIT. I will forever be grateful for the confidence initially placed in me by Matthew Kressy, and for his vision to create such an inspiring masters program. I would also like to thank Andy McInnis and Melissa Parillo for their unwavering support, warmth, and encouragements during the past three years. I am extremely grateful to Doug Hart for giving me the flexibility to work on a topic that I felt passionate about, for his mentorship, and for his courses that I will always remember very fondly. This work was born out of the willingness of numerous growers, advisors, and industry experts to lend me their time. I am thankful for their help, insights, and valuable advice. I also deeply enjoyed working with Helena Briones under the supervision of Professor Sang-Gook Kim on the later parts of this work.
This three-year journey would not have been this memorable if I had not met such an extraordinary group. I would like to thank Matthew Rosen, who has been a close friend and fellow researcher in the past three years. I am grateful for his dedication, efforts and help, and will always cherish the memories of our common work. I am particularly thankful to Khatia Chitashvili for her loving support, generosity, and advice. Her presence by my side has made my experience here even more unforgettable than it already was. To all the friends I have made in IDM and more broadly during my time at MIT, I feel very fortunate to have been surrounded by such interesting, ambitious, and supportive people.
I have been blessed with an incredibly loving and supportive family - H61ene and Thibault; Marie, Louis, and their children; and Marie and Adrien. I am very grateful for their constant desire to see me thrive. This work is dedicated to my parents: H61ene and Thibault, for their unconditional kindness and generosity, and for giving me the freedom to be who I want to be as long as I am happy.
Contents
I
Introduction...
15
1.1 Goals, motivation, and research methodology ... 16
2
Challenges to Agriculture and the necessity for innovative solutions ... 17
2.1 The urgent need for new sources of productivity growth...17
2.1.1 Required yield increases to meet projected demand levels ... 17
2.1.2 Concerns on the feasibility of necessary yield increases... 21
2.1.3 Additional challenges associated to changing diets ... 24
2.2 The shortage of natural resources and the need for increased sustainability...27
2.2.1 The finiteness of land and freshwater resources... 28
2.2.2 The increasing environmental impact of agricultural inputs ... 31
2.2.3 The looming threat of climate change on Agriculture... 33
2.3 The shortage of producers and the urgent need to improve farming income...34
2.3.1 The shrinking generation of new farmers ... 35
2.3.2 The lack of economic incentives to become a farmer ... 37
2.3.3 The increasing labor shortage across the farming sector... 40
2.4 Opportunities in food waste reduction and prevention ... 41
2.4.1 Overview of food loss and waste...42
2.4.2 Causes underpinning food loss and waste ... 44
2.4.3 The benefits associated with food waste reduction ... 45
3
Evaluation of the impact of AgTech...47
3.1 Technological advances and direct benefits ... 47
3.1.1 Origins, definition and recent traction ... 48
3.2 Current limitations and future challenges ... 56
3.2.1 Decreasing user engagement and slow-paced technology adoption ... 56
3.2.2 Low financial incentives for farmers to invest in AgTech solutions...60
3.2.3 Current limits to the impact of AgTech on Agriculture ... 65
3.3 Factors underlying the difficulties of AgTech...66
3.3.1 Common deficiencies of AgTech startups...66
3.3.2 The inertia of the agriculture industry ... 69
3.3.3 The initial absence of adapted funding for AgTech solutions ... 72
3.4 The limited focus of AgTech on food waste reduction ... 73
3.4.1 Recent developments in food waste reduction initiatives ... 73
3.4.2 Food waste reduction efforts remain limited in comparison to AgTech ... 75
3.4.3 Food waste reduction remains an untapped pool of valuable opportunities...75
4
Recommendations to enhance the impact of AgTech...78
4.1 Ventures: focus on solutions that primarily benefit farmers ... 78
4.1.1 The rationality of farmers on technological investments ... 78
4.1.2 Identification of the needs of crop producers ... 80
4.1.3 The necessity of listening to producers ... 82
4.2 Innovation ecosystems: enhance cooperation between stakeholders...82
4.2.1 Develop innovation clusters to foster collaboration ... 82
4.2.2 Funding innovative ecosystems with adequate and expert capital ... 84
4 .2 .3 T he Israeli m odel...85
4.3 Agriculture: become a collaborative industry platform ... 87
4.3.1 Definition and benefits of industry platforms...87
4.3.2 Opportunities for platform solutions in Agriculture ... 88
4.4 Proposed concept for food waste reduction in agricultural production...90
4.4.1 Problem definition ... 90
4.4.2 Solution design ... 93
4.4.3 Solution details, risks and potential impact ... 97
5
C onclusion...100
5.1 Future W ork ... .. ... 100
List of Figures
Figure 1. World population (millions): historical data and Medium Variant forecasts (1980
-2 0 5 0 ) [7 ]...18
Figure 2. Undernourished people and prevalence of undernourishment [11]...20
Figure 3. Global cereal yield growth rates, averaged over 25 year periods, derived from [12]. ... 21
Figure 4. Yield growth rates for corn and wheat crops in the US, averaged over 25 years [13]. ..22
Figure 5. Global urbanization, historical figures and forecasts [17]...25
Figure 6. Energy use, blue water footprint, and greenhouse gas emissions per food (index). Figure fro m [19 ]... ... .... ...-... 27
Figure 7. Arable land per capita (ha/person) [20]. ... 29
Figure 8. Baseline forecasts of agricultural GHG emissions (million tons of C02). From [9]...33
Figure 9. Age distribution of principal farm operators (1978-2012). Figure taken from [34]...35
Figure 10. Distribution of farms, production value and land operated by farm type, 2017 [37]...36
Figure 11. Value of production for selected commodities, by farm type, 2017 [37]...37
Figure 12. Corn and soybean prices ($/bushel) [13]. ... 37
Figure 13. Input and output price indices, as computed by the USDA [13]. ... 38
Figure 14. US farming gross cash income, net cash income and cash expenses [13]...39
Figure 15. US net cash farm income margin. Derived from [13]. ... 39
Figure 16. Percentage of food loss and waste at each phase of the food supply chain for fruits and v eg etab les [4 4 ]. ... 4 3 Figure 17. Relative contribution of each food chain stage to food waste and loss [45]. ... 44
Figure 18. AgTech application domains, as defined by AgFunder. Figure taken from [48]...49
Figure 19. AgTech funding activity since 2012 (billion dollars) [48]. ... 50
Figure 20. Breakdown of AgTech funding between upstream and downstream solutions [48]....50
Figure 21. Evolution of AgTech funding by application. Figure taken from [48]...51
Figure 22. Breakdown of AgTech funding in 2017 and 2018 [48]...52
Figure 23. Adoption of yield monitoring solutions in major crops in the US (percent). Data from
[7 9 ]. ... ... ... ... .... ... 5 8
Figure 24. Adoption of guidance systems in major crops in the US (percent). Data from [79]. ... 59
Figure 25. Adoption of GPS soil mapping in major crops in the US (percent). Data from [79]. ..59
Figure 26. Adoption of VRT in major crops in the US (percent). Data from [79]. ... 59
Figure 27. Output, input and Total Factor Productivity indices, as computed by the USDA. Data fro m [8 5 ]...6 2
Figure 28. US farming gross cash income, net cash income and cash expenses [13]...63
Figure 29. Evolution of a selection of cash farming expenses (percent of gross cash income). Data fro m [8 6 ]...6 3
Figure 30. Profits/Losses ($/acre) of US farmers on major crops. From [87]. ... 64
Figure 31. A drawing by Kip Tom details the use of technology in the business operation at Tom F arm s. F ro m [54 ]...6 8
Figure 32. Concentration of the food value chain, by segment. From [73,97] ... 70
Figure 33. Contribution of each phase of the supply chain to fruit and vegetables waste. Data from [44] averaged over the US, Europe and Industrialized Asia. ... 91
Figure 34. Process flow between farmers, retailers and consumers. In red, four sources of waste stemming from current industry practices. Derived from farmer interviews, industry reports an d new articles. [15 1]. ... 9 2
Figure 35. Evaluation of the three proposed concepts against primary functional requirements. .96
Figure 36. Evaluation of four proposed technologies to meet FR.I. ... 97
List of Tables
Table 1. Increases in food production needed to match demand. AT2050 refers to 2009 estimates.
D ata from [4] ... .. ...--... 19
Table 2. Sources of growth in crop production (percent). From [10]. ... 19
Table 3. Number of undernourished people (millions) per region. From [I]. ... 20
Table 4. Percentage of global crop production under different yield trajectories [14]. ... 22
Table 5. World prices of selected grains per scenario (USD per metric ton) [6]...23
Table 6. Real growth of public agricultural research and development spending. From [4]...24
Table 7. Per capita food consumption (kcal/person/day) [10]. ... 25
Table 8. Diet composition in kcal/person/day [10]. ... 26
Table 9. Total arable land in use (millions ha): historical data and projections [10]...28
Table 10. World use of crops for biofuels (percent) [10]...29
Table 11. Water use efficiency and pressure on water resources due to irrigation. Adapted from [10 ]. ... 3 1 Table 12. Fertilizer consumption per harvested hectare. From [10]. ... 32
Table 13. Simulated impact on yield in 2050 from three climate change scenarios (percent ch ange). F rom [6].. . . ... ... 34
Table 14. Farm labor wages in California ($/hour) [40]. ... 41
Table 15. Food loss and waste per category [43]...42
Table 17. Breakdown of adoption rates for Precision Agriculture technologies on US farms, by farm size [6 8 ]...6 0
Table 18. Mergers conducted by the world's 'big 6' agribusiness companies. From [101]...71
Table 19. AgTech M&A led by agribusiness giants. Data from [48]. ... 71
Table 20. Acreage under management of AgTech companies. Data from [80,110-120]...79
1
Introduction
Global food production is facing severe challenges that will test the world's ability to mobilize technology, industry participants, and governments to develop a sustainable response. Feeding a growing population and accommodating for rapidly evolving diets calls for a significant
expansion in agricultural production. The feasibility of such an expansion is uncertain, as experts point out that the benefits from the Green Revolution have already been reaped, and the chances of one happening again are limited. In parallel, the depletion of arable land and freshwater resources questions the sustainability of agricultural production. Progress is needed to help produce more with less, limit the environmental impact of chemical inputs, and curb agricultural greenhouse gas emissions. A key enabling factor in the development of a holistic response to these challenges will be the engagement of the agricultural workforce. However, it is facing increasingly challenging economic conditions, a lackluster generation of new producers, and industrywide labor shortages that threaten the continuity of food production.
Innovative systems are crucially needed to protect natural resources, while boosting productivity and sustaining a vital workforce. In the past decade, Agriculture has witnessed the rise of a novel proponent of such systems stemming from an unprecedented wave of investments, innovations and entrepreneurial ventures, referred to as AgTech for the purpose of this work. AgTech has expanded the boundaries of agricultural production, and has put forward models with significant benefits to farmers and consumers. These novel solutions must be adopted on a wide scale for these advances to come to fruition, and for demand to be sustainably met. However, several factors inherent to AgTech and the food industry have hindered their implementation. Changes are needed to ensure that there are sufficient incentives and support infrastructure for food producers to invest in these solutions. To achieve this, there must be an increased collaboration between all industry stakeholders, along with adequate governmental support. The future of food and agriculture faces uncertainties, but the cooperation of technologists, entrepreneurs, industry participants and governments will help overcome them.
1.1 Goals, motivation, and research methodology
The aim of this work is initially to analyze the most pressing challenges faced by food production, communicate on their magnitude, and highlight opportunities for innovation. In parallel, this work aims to increase awareness on the magnitude of food waste and loss, and present the opportunities associated with food waste reduction and prevention. Then, this work will briefly define AgTech, present its benefits and evaluate its impact on the food production industry. Based on this evaluation, one of the main goals of this thesis is to explain the limitations of AgTech, and propose industrywide recommendations to enhance its impact. Furthermore, this work will expose the gaps in food reduction innovation, and propose a concept to reduce food waste in agricultural production.
This work is primarily motivated by the multiple challenges faced by Agriculture, and the urgent necessity to develop innovative production systems. Challenges that have especially motivated the author are the increasingly challenging economic situation of farmers, and the overwhelming
amount of food waste and loss in the food supply chain. Although Agriculture has a limited economic role, and only accounts for 3.5% of the world's Gross Domestic Product (GDP), it
remains a foundational industry that employs 26% of the world's population, and occupies 37% of global land [1-3]. It has been a formidable engine of scientific progress in genetics and mechanization, and can still propose cutting-edge advances that can benefit most industries.
This work was initially born out of dozens of interviews with farmers, researchers, entrepreneurs and industry stakeholders conducted in the summer of 2018. To supplement these qualitative insights, a literature review was conducted, ranging from reports of international
non-governmental organizations, to scientific research and news articles. Personal reflections and a secondary set of interviews helped build the recommendations proposed in the later parts of this thesis. The proposed concept to reduce food waste in agricultural production was developed through coursework taught by Professor Sang-Gook Kim at the Massachusetts Institute of
2
Challenges to Agriculture and the necessity for innovative solutions
Global food production is facing three severe challenges that will require unprecedented support, change and innovations to sustainably meet a growing and diversifying demand. First, there is an urgent need to find new sources of productivity growth to match the demand of a rising,
increasingly urban population. Second, the heightening scarcity of natural resources and the looming threat of climate change require novel solutions to support the sustainability of the global food supply. Finally, plummeting profits and labor shortages in Agriculture put additional pressure on food security, and demand progress to sustain a crucially needed workforce. In this
context, food waste and loss sheds light on the dysfunctions of the food supply chain and the chasms between producers, retailers and consumers. It constitutes a pool of opportunities to help meet demand, enhance agricultural sustainability and improve farming profits.
2.1 The urgent need for new sources of productivity growth
Although decelerating, population growth continually requires increases agricultural productivity. The FAO estimates that a 48.6% increase in global crop production is required to match the expected rise in demand by 2050 [4]. Even more so than before, yield increases will drive most of the needed production increment. Achieving them poses a formidable challenge in and of itself, as numerous experts argue that yield ceilings have been, or are being reached for major crops, which might trigger a surge in food prices in the coming years [5,6]. A tremendous wave of research and development spending is necessary to fuel progress in seeds and inputs, along with incentives and support structures to aid the adoption of new technologies on farmland.
Concurrently, urbanization has triggered a global shift in diets that will require a rapid adaptation of food production systems.
2.1.1 Required yield increases to meet projected demand levels
The United Nations (UN) forecast that the world population will increase by 32.4% over the next
30 years, from 7.38 billion people in 2015 to 9.77 billion people in 2050 [7]. Developing nations
will fuel 98% of the growth over this period, through an increment of 2.34 billion people, to reach 8.47 billion people by 2050. These forecasts mark a significant deceleration compared to
the past 35 years. World population is projected to grow at an annual rate of 0.80% between 2015 and 2050; nearly half of what it was between 1980 and 2015 (1.45%).
- World - - - World (forecasts) - Developed countries - - Developed countries (forecasts)
12000 - Developing countries Developing countries (forecasts)
9000 10000 - 8000 80000 8 000 600 6000 6 000 5000 4000 4000 3000 2000 2000 1 000 0 0
Figure 1. World population (millions): historical data and Medium Variant forecasts (1980 -2050) [7].
Population growth, albeit slowing, demands a tremendous increase in global food production to
supply an additional 2.39 billion mouths by 2050. In 2009, the United Nations Food and
Agriculture Organization (FAO) had estimated that agricultural production needed to increase by nearly 60% between 2005 and 2050 to meet projected demand [4,8]. After a revision in 2017, the FAO currently estimates that agricultural production must increase by 48.6% compared to its 2013 levels, by 2050 [4]. This implies a 112.4% increase for Sub-Saharan Africa and South Asia, and a 34.2% increase for the rest of the world over this period [4]. Similarly, the World
Resources Institute (WRI) estimates that global agricultural production needs to increase by 56% between 2010 and 2050 [9]. Their projections assume a faster shift in diets, and a notable 68% increase in the consumption of meat and milk over the period, which exceeds the rise in demand
Table 1. Increases in food production needed to match demand. AT2050 refers to 2009 estimates. Data from [4].
2 52005/070/7-
2013-2050 202 2050
World
As projected in AT2050 59.6% 14.8% 44.8%
With updated population projections (UN, 2015) 63.4% 14.8% 48.6% Sub-Saharan Africa and South Asia
As projected in AT2050 124.9% 20.0% 104.9%
With updated population projections (UN, 2015) 132.4% 20.0% 112.4%
Rest of the world
As projected in AT2050 44.9% 13.8% 31.2%
With updated population projections (UN, 2015) 47.9% 13.8% 34.2%
Even more so than in the past, yield increases will be the main drivers of crop production growth. Given the growing scarcity of arable land, yield growth is expected to drive 80% of global crop production growth between 2005 and 2050, as compared to 77% between 1961 and 2007 [10]. Arable land expansion will still be an important source of growth in agricultural output for countries of Latin America Sub-Saharan Africa (20% and 40% respectively), but its decline in regions like South Asia will put more pressure on cropping intensity and yield increases [10].
Table 2. Sources of growth in crop production (percent). From [10].
Arable land expansion incatensitv Yield increases 1961 207 205/207-
0052007
191..0072005/2007-1961- 2007 1050
All developing countries 23 21 8 6 70 73
Sub-Saharan Africa 31 20 31 6 38 74
Near East/North Africa 17 0 22 20 62 80
Latin America and the Caribbean 40 40 7 7 53 53
South Asia 6 6 12 2 82 92
East Asia 28 0 -6 15 77 85
World 14 10 9 10 77 80
Developing countries with less than 20 percent of their
potentially arable land in use in 2005/2007* 35 6 59
Developing countries with over 60 percent of their
potentially arable land in use in 2005/2007** 4 6 90
* 24 countries with a gross land balance exceeding 80 percent of total suitable land in 2005/2007
However, global food security will not just depend on yield increases. The fast growth of many developing nations puts even more pressure on already strained food systems, and requires novel solutions to facilitate access to food and support agriculture in impoverished regions [11]. Even if there is sufficient food supply in principle for nearly everyone to be well-fed, there were still 821 million undernourished people in 2017 [10,11]. That number has raised numerous concerns because of its renewed growth since 2014, as highlighted by Figure 2, thus writing off progress made between 2010 and 2014.
1000 14.5% 950 900 11.8% 11.3% 10.7% 10.8% 10.9% 850 800 750 700 650 600 550 500 2005 2010 2012 2014 2016 2017*
Number of undernourished people (World, Millions) -4 -Prevalence of undernourishment (Percent)
Figure 2. Undernourished people and prevalence of undernourishment [ 11.
This is partly due to a stark increase in undernourishment in and countries, as evidenced by Table 3 below, itself a result of multiple reasons like the lack of appropriate financing for farmers, poverty, or instability in these regions.
Table 3. Number of undernourished people (millions) per region. From [11].
Africa 196 200.2 205.2 212.5 241.3 256.5
Asia 686.4 569.9 552.2 523.1 514.5 515.1
Latin America and the Caribbean 51.1 40.7 38.9 38.5 38.9 39.3
Oceania 1.8 1.9 2 2.3 2.6 2.8
North America and Europe 26.4 27 27.2 27.3 27.5 27.6
World 945 820.5 805.7 783.7 804.2 820.8
2.1.2 Concerns on the feasibility of necessary yield increases
Numerous experts question the feasibility of the yield increases needed to meet the production targets set by the FAO, as well as the potential for a continuation of growth in productivity [10]. The World Bank had alerted about this issue in 2008, after pointing out significant declines in crop yield growth rates in developing countries since the 1980s [5]. The deceleration was attributed to slowdowns in public research and development spending, the deterioration of soil and water quality, and the imbalanced use of nutrients [5]. This slowdown is taking place at a global level, as evidenced by the decrease of yield growth rates of cereal crops (averaged over 25 years) from c.2.5% per annum in the 1980s to c.1.5% in the 2010s [12].
-25-year CAGR 3.0% 2.5% 2.0% 1.5% 1.0% 0.5% 0.0% 1985 1987 1989 1991 1993 1995 1997 1999 2001 2003 2005 2007 2009 2011 2013 2015
Figure 3. Global cereal yield growth rates, averaged over 25 year periods, derived from [12].
This observation also stands for developed countries with significant research and development spending. In the US, yield growth rates of corn and wheat (averaged over 25 years) have decreased from c.2.0% and c.1.2% in the 1980s to c.1.5% and c.0.8% in the 2010s, respectively [13].
-W Wheat 25-yr. CAGR ...-- Linear (Wheat 25-yr. CAGR) 3.0% 2_5% 2.0% 1.5% 1.0% 0_5% 2.0% 1.8% 1.6% 1.4% 2% 1.0% 0.8% 0.6% 0.4% 02% 0.0% - or or
--r --r , C r -re r r -n -r -- Oa-e rr-r a -t
~
o 0- -t ----orFigure 4. Yield growth rates for corn and wheat crops in the US, averaged over 25 years [ 13].
Among causes for concern, experts highlight that easy gains from the Green Revolution have already been reaped, and that the chances of one happening again are very limited [5,10]. Additionally, studies have discussed the possibility that yield growth for certain crops has plateaued, or even that yields have reached the maximum biophysical potential of crops [10,14]. A 2013 study led Grassini et al. argues that 21% of the global production of rice, wheat and maize have reached upper yield plateaus. 12% alone follow an increasing rate of productivity, while 10% are on a decreasing trend [14].
Table 4. Percentage of global crop production under different yield trajectories [ 14].
% of
global Increasing
production rate (%)
Constant Decreasing Upper yield
rate (%) rate (%) plateaus
Rice 84 19 23 9 33
Wheat 56 5 24 0 27
Maize 71 13 33 20 5
Total (rice, wheat, maize) 70 12 27 10 21
Historically, significant yield gains have been obtained by bridging the gap between average farm yields and experimental yields through the adoption of hybrid seeds, the widespread use of fertilizers and pesticides, and the expansion of irrigation equipment [14]. However, one concern today is that despite increases in research and development funding between 1981 and 2000 in countries like China and the US, rates of yield gains have remained linear, or even stagnated [14]. This situation highlights the need for an intensified growth in research and development spending
Crop species
... ..I..'_... "... -...
...
to match production targets. Besides, it evidences the increasing complexity for farmers to maximize yield, who now have to optimize numerous facets of their operations simultaneously.
The gradual decline in arable land and the deceleration of crop productivity growth have fueled fears of significant food price increases in the future. In 2009, the International Food Policy Research Institute (IFPRI) estimated that world grain prices would increase by 30 to 50 percent by 2050, while meat prices would grow by an extra 20 to 30 percent as compared to 2007 levels, increments above historical trends [6]. Adverse environmental conditions induced by climate change could exacerbate these trends. Two climate change modelling scenarios, NCAR and CSIRO, point towards the possibility of additional prices increases compared to standard projections for maize: +51.9% and +55.1%, respectively [6]. Without adaptive action to curb climate change, along with significant innovations in resistant seed varieties, these scenarios could materialize and have devastating consequences on global food security.
Table 5. World prices of selected grains per scenario (USD per metric ton) [6].
Baseline NCAR-based scenario CSIRO-based scenario
2050 (no climate 2050 (wkith %2050 (with %
200 change) climate change) Chneclimate change) Change
Maize 95 155 235 51.9 240 55.1
Rice 190 307 421 36.8 406 32
Wheat 113 158 334 111.3 307 94.2
As mentioned above, tremendous innovations and increases in agricultural research and
development will be needed to sustain yield growth, and curb food prices. This is especially true for developing countries, where the FAO identified a 50% gap in agricultural research and development funding (annual investments average $142 billion as opposed to a required $209 billion) in 2009 [8]. This gap is a result of a decline in both public and private agricultural research and development spending. Bridging it will require policies that support farmers and incentivize them to invest in new technologies, on top of funding increases. Similarly, the growth rate of public agricultural research and development has stalled in numerous regions: it went from 9.1% between 1960 and 1970 to 1.0% between 2000 and 2009 in high-income countries [4].
gone from 50% between 1970 and 2008, to 20% between 2008 and 2013, underlining a sharp decline [15]. Currently, public agricultural research and development funding is supported for the
most part by developing countries, and notably China, who drove 40% of global investments between 2000 and 2008 [16].
Table 6. Real growth of public agricultural research and development spending. From [4].
96-7 197- E
IE
IE
Low-income 6.0% 4.1% 3.1% 1.0% 2.3% Lower middle-income 6.7% 3.3% 3.1% 3.2% 4.6% Upper middle-income 4.3% 6.6% 2.8% 2.1% 6.2% High-income 9.1% 3.3% 2.1% 1.6% 1.0% China -0.1% 7.8% 5.1% 3.9% 9.9% India 9.8% 1.7% 5.6% 6.7% 5.2% Sub-Saharan Africa 5.7% 2.7% 0.6% -0.5% 4.0% World 7.6% 4.1% 2.4% 1.9% 3.1%Although there has been a surge in private funding for agricultural research and development, questions have been raised on whether this might compensate for the sharp slowdown in public investments. The latter is especially surprising since large bodies of literature have demonstrated that public agricultural research and development holds significant rates of return: between 20% and 60%, with a median rate of return of 40% [15]. These rates of return, in addition to the necessity of increasing production levels in the coming years call for a renewed and robust support of public agricultural research and development. While many believe that there are still significant exploitable yield gaps, there remains uncertainty on whether there will be enough public support to help develop new technologies, and assist farmers to invest in them [5].
2.1.3 Additional challenges associated to changing diets
Increasing productivity is not the only challenge to our global food system. Urbanization and rising incomes have sparked a shift in diets towards more resource-intensive foods that will
require an adaptation of food production systems. The UN estimate that 68.4% of the population
M Urban N Rural 100% 90% 80% 70% 60% 50% 40% 30% 20% 10% 0% 2000 2010 2020 2030 2040 2050
Figure 5. Global urbanization, historicalfigures and forecasts [ 17].
As opposed to rural populations, urban dwellers have a higher calorie intake, and consume more animal protein, fats, sugar, and processed foods [18]. As a result, there has been a global increase in per capita food consumption, which is expected to continue as urbanization increases [10]. Globally, the calorie intake per person is poised to increase by 7.3% and 9.5% between 2015 and 2050 for the world and developing countries, respectively [10].
Table 7. Per capita food consumption (kcal/person/day) [10].
Worild
Developing countries Sub-Saharan Africa Near East / North Africa Latin America and the Caribbear South Asia East Asia Developed countries 2772 2619 2238 3007 2898 2293 2850 3360 2860 2740 2360 3070 2990 2420 3000 3390 2960 2860 2530 3130 3090 2590 3130 3430 3070 3000 2740 3200 3200 2820 3220 3490 1970 1980 1990 1950 1960 4
--Ag .M .EIMI
10
Similarly, the FAO projects a sharp increase in the consumption of meat and dairy between 2005 and 2050: +26% and +19% at the world level respectively, and +50% and +46% in developing countries [10].
Table 8 below provides additional details in the evolution of the diet composition at the world level, as well as for developing countries.
Table 8. Diet composition in kcal/person/day [10].
22305/5
-07
mm
World
Cereals, food 158 160 160
Cereals, all uses 314 329 330
Roots and tubers 68 73 77
Sugar and sugar crops (raw sugar eq.) 22 24 25
Pulses, dry 6.1 6.6 7
Vegetable oils, oilseeds and products (oil eq.) 12 14 16
Meat (carcass weight) 39 45 49
Milk and dairy, excl. butter (fresh milk eq.) 83 92 99
Other food (kcal/person/day) 294 313 325
Total food (kcal/person/day) 2 772 2 960 3 070
Developing countries
Cereals, food 155 159 158
Cereals, all uses 242 254 262
Roots and tubers 66 73 78
Sugar and sugar crops (raw sugar eq.) 19 22 24
Pulses, dry 7 7.4 7.7
Vegetable oils, oilseeds and products (oil eq.) 10.1 13.1 15.4
Meat (carcass weight) 28 36 42
Milk and dairy, excl. butter (fresh milk eq.) 52 66 76
Other food (kcal/person/day) 253 279 293
Total food (kcal/person/day) 2 619 2 860 3 000
This creates an additional challenge for our food system, since these foods are the most resource-intensive, and increase the pressure on an already strained environment. Fruit and vegetables, dairy, and animal protein are among the most demanding in energy use and blue water footprint,
100 -r 90 80
I
70 60 50 -40 30 20 to 0 Food Groupa Energy Use i Blue Water Footprint a GHG Emissions
Figure 6. Energy use, blue water footprint, and greenhouse gas emissions per food (index). Figure from [19].
Overall, urbanization magnifies the pressure on food production to meet the demand of large, concentrated populations. Shifting diets require a rapid adaptation, along with novel solutions to help sustainably meet demand.
2.2 The shortage of natural resources and the need for increased sustainability
Numerous experts question the sustainability of the food production system, because of its heavy reliance on land and irrigation expansion, significant amounts of inputs, and the transportation of products over long distances [10]. The finiteness of available arable land and the scarcity of freshwater resources require novel solutions to help produce more with less. Similarly, progress is needed to limit the impact of agricultural inputs on the environment, and curb agricultural greenhouse gas (GHG) emissions. Finally, the potential impact of climate change on yields and crop stresses will demand advances in resistant seed research, if future food demand is to be met. Overall, significant research and innovation efforts will be needed to surpass these challenges, as many experts call for a shift towards sustainable intensification (i.e. the increase of food
2.2.1 The finiteness of land and freshwater resources
The FAO estimates that arable land in use has grown at an annual rate of 0.28% between 1961 and 2007 [10]. Paralleled with a faster population growth, this had led to a steady decline in arable land per person, a measure often used to illustrate the need for productivity gains when compared to growing food demand.
Table 9. Total arable land in use (millions ha): historical data and projections [10].
Arable land Annual in use growth
World 1 592 1 661 0.28 0.1
Developed countries 624 586 -0.17 -0.14
Developing countries 968 1 075 0.65 0.24 idem excl. China and India 668 775 0.74 0.34 Sub-Saharan Africa 240 291 0.83 0.44 Latin America 202 251 0.98 0.49 Near East / North Africa 84 84 0.31 0
South Asia 206 213 0.14 0.08
East Asia 236 236 0.93 0
Globally, arable land per person has declined by 54%, from 0.42 ha/person in 1961 to 0.19 ha/person in 2016. In least developed countries, it has decreased by 61%, from 0.46 ha/person to 0.18 ha/person [20].
-World -Least developed countries 0.50 0.45 0.40 035 0.30 025 020 0.15 0.10 0.05 0.00 r'
~
'0 00 0 61010 ' 00 00 0 0 0 00 0 S' '0 ' 0 0 (' 0 0 0 r0 ;'Figure 7. Arable land per capita (ha/person) [20].
Experts project this trend to continue, as arable land in use will only grow at an annual rate of 0.1% until 2050, being the main reason for the necessary level of yield increases mentioned in 2.1.1 [10]. This situation is even more concerning as there is an intensifying competition for land use between agriculture and biofuel production. The FAO estimates that by 2050, 6.1% of cereal crops and 24.3% of sugar crops will be used for biofuels, up from 3.2% and 15.1% in 2005/2007, respectively [10]. Should this trend continue, it might disrupt food production systems, possibly to the benefit of producers, but to the detriment of low-income consumers. According to the WRI, goals set by developed countries in terms of biofuel production could, if met, increase the existing food gap toward 2050. Multiple governments have announced that they aim to increase the share of biofuel used for transportation fuel by 400% in the coming years [9]. Such an
increase would cover only 2% of transportation fuel needs in 2050, but it would increase the food gap from 56% to 78%, according to the WRI [9].
Table 10. World use of crops for biofuels (percent) [10].
Cereals 3.2 6.7 6.1
Vegetable oils 4.8 12.6 10.3
Sugar 15.1 27.4 24.3
Soil erosion stemming from agriculture is an additional threat to the availability of land for food production. A third of the planet's land has already been severely degraded, and 24 billion tons of arable land are eroded each year because of practices like heavy tilling [21-23]. This has two highly detrimental consequences: a significant economic burden to recover from nutrient losses, valued at $33-60 billion per year, and a massive carbon debt due to lowered carbon sequestration in the soil, estimated at 133 billion tons [22,23]. Soil erosion also causes productivity losses, as well as eutrophication of waterways and reservoirs [24]. Thus, increasing yields alone will not be enough to limit environmental damage caused by unsustainable practices. Instead, innovative solutions, such as controlled traffic, variable depth tillage, and conservation practices like no-till farming will need to be widely adopted.
Another crucial question is whether there will be enough water resources to meet the needs of food producers and other users alike. Agriculture accounts for nearly 70% of freshwater withdrawals in the world, and is deemed to be the main responsible behind the scarcity of freshwater in certain regions [10]. Because of the growing needs of agriculture, industry, and cities over time, the FAO estimates that 40% of the world's rural population lives in areas that are classified as water scarce [4]. This increasing scarcity calls for novel solutions to enhance water
use efficiency, and thus reduce the pressure of irrigation on these regions' freshwater resources. In 2012, the FAO pointed out that the world average for water use efficiency (i.e the ratio between crop water requirements and irrigation water withdrawal) was at 50%, and projected to
stagnate towards 51% in 2050 [10]. This stems from losses of water during transport and distribution, as well as irrigation practices such as field flooding, plant protection, and weed control, which require significant amounts of water. As a result, there is significant pressure on renewable water resources (measured as the ratio between irrigation water withdrawal and renewable water resources), up to 52% in North Africa, or 40% in South Asia. These figures highlight the need for novel irrigation solutions that can further optimize agricultural water consumption; and the need for increased support to help farmers adopt technologies such as drip irrigation.
Table 11. Water use efficiency and pressure on water resources due to irrigation. Adapted from [10].
Water use Pressure on water efficiency ratio resources
2005/ 250 20/ 25 2007 20 World 50% 51% 7% 7% Developed countries 41% 42% 4% 4% Developing countries 52% 53% 8% 9% Sub-Saharan Africa 25% 30% 3% 4% Latin America 42% 42% 1% 2%
Near East/North Africa 56% 65% 52% 54%
South Asia 58% 58% 40% 39%
East Asia 49% 50% 8% 9%
2.2.2 The increasing environmental impact of agricultural inputs
Although the wide adoption of chemical inputs such as fertilizers and pesticides has brought about significant productivity improvements, it has also triggered detrimental environmental consequences. Globally, around 115 million tons of mineral nitrogen fertilizers are applied to croplands each year, 20% of which accumulate in the soils, and 35% enter the oceans [25]. This has led to an estimated 24% of the global land area under irrigation to be affected by salinization [25]. Nitrate is considered the most common chemical contaminant in the world's aquifers, and has been reported as a major issue in Europe, the United States, and South and East Asia [26]. In many OECD countries, nitrate levels in groundwater exceed prescribed drinking limits in 10-15% of cases, a number that goes up to 33% for Europe's groundwater bodies [26]. In the US, the EPA deems nutrient pollution as one ofAmerica's most widespread, costly and challenging
environmental problems, caused by excess nitrogen and phosphorus in the air and water [27].
Nutrient pollution also favors the generation of algal blooms, thus hurting industries and sectors that depend on clean water [28]. In the US, federal, state and local governments spend billions of dollar per year to prevent the effects of nutrient pollution [28]. If no novel substitutes to fertilizers or solutions to mitigate nutrient runoff are developed, this situation will be aggravated. Increasing
amounts of fertilizer are expected to be used, because of its growing adoption on farmland, and the need to use it in larger quantities to maximize yield [10]. Globally, fertilizer consumption is expected to grow by 45%, from 132 kg/ha in 2005/2007 to 191 kg/ha in 2050 [10].
Table 12. Fertilizer consumption per harvested hectare. From [10].
Sub-Saharan Africa 8 27
Latin America 122 250
Near East / North Afric; 113 170
South Asia 121 268
East Asia 210 256
Developing countries 127 200
Developed countries 144 166
World 132 191
Similarly, pesticides have been recently put under the spotlight because of their increasing environmental cost, and potentially detrimental consequences to human health. Worldwide, 4.6 million tons of chemical pesticides are sprayed in the environment each year [25]. This intense spraying is estimated to have an annual $8 billion economic impact on non-target species (including humans) in developing countries [25]. Farmers rely heavily on these chemicals for crucial operations, such as weeding, leading to an estimated 200 million pounds of herbicides sprayed annually by US farmers on their fields [29]. However, this intense use has led FDA chemists to find trace amounts of it in numerous common foods, such as wheat crackers, granola cereal and corn meals, according to a recent inquiry [29]. Roundup, one of the most widely used weedkillers was recently alleged to be a substantial factor in causing cancer [30]. Two plaintiffs (Edwin Hardeman and Dewayne Johnson) were awarded significant damages in lawsuits against its manufacturer [30]. There is more: repeated spraying of herbicide has led to the emergence of 255 herbicide resistant weed species over time, thus evidencing the unsustainability of these chemicals to durably treat weeds [31]. These challenges make a strong case for the development of novel substitutes to agricultural chemicals, and innovative solutions to mitigate our reliance on them, or increase their efficacy.
There is an urgent need to curb agricultural greenhouse gas (GHG) emissions. Agriculture already constitutes 56% of non-C02 emissions, and the global food systems account for 19-29% of total GHG emissions, according to CGIAR research [32]. Due to growing food production, the WRI projects emissions caused by agricultural production will increase by 33% between 2010
and 2050, from 6.8 Gt to 9.0 Gt of C02 [9]. Put together with emissions stemming from
agricultural land expansion and drained peatlands, this number would go up to 15 Gt by 2050 [9]. This will represent close to 70% of the total allowable emissions for all sectors by 2050, if we are to hold global warming below 2 degrees Celsius [9].
10000 9024 9000 8000 6769 7000 5000 4000 3000 2000 1000 0 2010 2050 (baseline)
0 Ruminant enteric fermentation U Energy
e Rice methane a Soil fertilization
a Manure management 9 Ruminant wastes on pastures
Figure 8. Baseline forecasts of agricultural GHG emissions (million tons of C02). From [9].
Although the contribution of agriculture to global GDP is likely to be below 2% by then, it alone would fill 70% of the global emissions budget in 2050 [9]. These projections are especially concerning since, as mentioned in 2.1.3, diets are shifting towards the larger consumption of foods that lead to higher emissions.
2.2.3 The looming threat of climate change on Agriculture
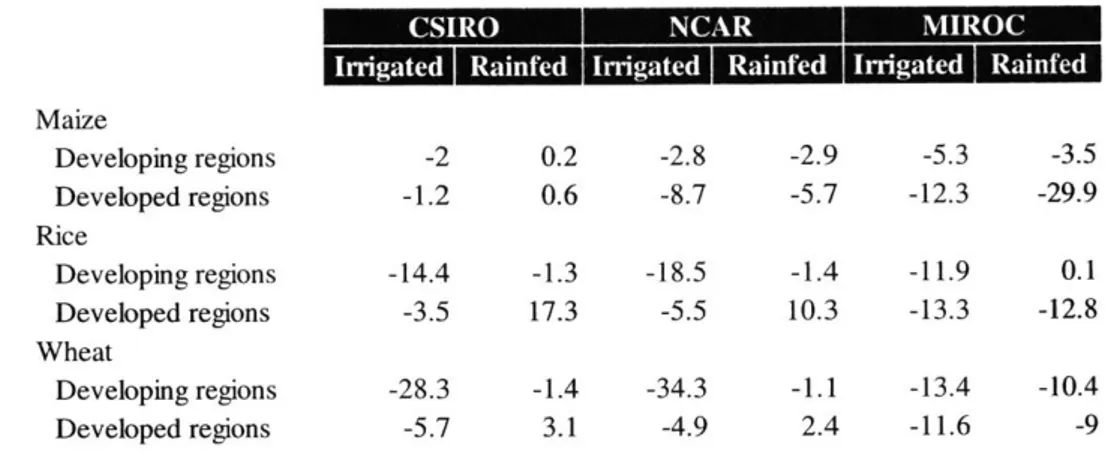
The potential increase on food prices, briefly mentioned in 2.1.2, is partly attributed to the negative effects of climate change on agricultural production. First, multiple modelling efforts and climate change scenarios predict that rising temperatures could severely affect crop yields [6,33]. For instance, the CSIRO climate change scenario projects that crop yields of rice and wheat could decrease by up to 14.4% and 28.3% respectively, in irrigated areas of developing countries [6].
Table 13. Simulated impact on yield in 2050 from three climate change scenarios (percent change). From [6].
-riae
Rind Rane Iriae Iriae Ra.eMaize Developing regions -2 0.2 -2.8 -2.9 -5.3 -3.5 Developed regions -1.2 0.6 -8.7 -5.7 -12.3 -29.9 Rice Developing regions -14.4 -1.3 -18.5 -1.4 -11.9 0.1 Developed regions -3.5 17.3 -5.5 10.3 -13.3 -12.8 Wheat Developing regions -28.3 -1.4 -34.3 -1.1 -13.4 -10.4 Developed regions -5.7 3.1 -4.9 2.4 -11.6 -9
Similarly, simulations conducted by the National Climate Assessment (NCA) have shown that crop yields of cotton and sunflower could decrease by over 20% in the next 80 years because of global warming [33]. Overall, the NCA forebodes increasing stresses on agricultural production due to extreme heat, drought, and heavy downpours [33]. Weeds, insects and diseases already have a negative impact on crop and livestock production, which could be magnified by climate change [33]. In parallel, the degradation of arable soil and freshwater is expected to continue at an accelerating rate, because of extremes in precipitation [33]. Finally, these effects could also cascade into other layers of the food systems, with climate change reportedly having a negative impact on protein and mineral concentration in foods [4]. Unless novel conservation methods are implemented, or increased innovation is developed, it is unlikely that Agriculture can endure climate change unaffected [33].
2.3 The shortage of producers and the urgent need to improve farming income A crucial, yet often overlooked question is whether there will be enough farmers to ensure sufficient levels of food supply by 2050. In the US, the average of farmers have increased significantly in recent decades, surging to 58.3 years old in 2012, being perhaps the starkest evidence of the lack of new farmers coming into agriculture [34]. Because of increasingly
expensive inputs and unstable prices, farming profits have plummeted, often leaving farmers with negative returns for major crops. Across the farming sector, there has been an intensified shortage of farm labor, sometimes threatening the continuity of their operations. Overall, there is an urgent need to support farmers and enhance their profit levels to sustain this vital workforce.
2.3.1 The shrinking generation of new farmers
It has become increasingly challenging for the farming industry to generate new producers, and it is perhaps best exemplified by the rapid aging of American farmers. In the US, the average age of farmers has been on the rise for the past 40 years, and has surged from 50.3 years in 1978 to 58.3
years in 2012 [34]. Farmers over 55 years old now represent over 60% of all farmers in the US [34]. This aging workforce represents a looming peril for the industry, since it is still unclear whether a new generation of farmers will emerge after it retires in the coming years.
Percent of principal farm operators
100
80
60-
40-
20-* Age 65 and older
* Age 55 to 64 * Age 45 to 54 0 Age 35 to 44 Age 25 to 34 * Under age 25 1978 1982 1987 1992 1997 2002 2007 2012 (50.3) (50.5) (52.0) (53.3) (54.0) (55.3) (57.1) (58.3) (Average age)
Figure 9. Age distribution of principal farm operators (1978-2012). Figure taken from [34].
Overall, the agricultural workforce is facing a lack of new farmers. Because of surging prices, buying land has become one of the biggest hurdles to the arrival of new farmers in the industry.
Land access is the top challenge young farmers face, said Holly Rippon-Butler, the Land Access
Program Director for the National Young Farmers Coalition (NYFC) in 2018 [35]. Land prices in the US have surged by 1600% since the farm crisis of the 1980s, making the upfront cost to own land prohibitive for many young farmers [35]. Renting farmland could be an alternative, but it is often too heavy a financial burden, leading novice farmers to struggle if they opt for it [35]. The United States Department of Agriculture (USDA) .estimates that non-operators currently own
30% of farmland, and that this number is on the rise [36]. The latter perceive farmland as a financial investment, which often makes production economics even more challenging than they already are. This situation is likely to get worse, as an estimated 100 million acres of US
farmland will change owners in the next few years, which should not make land or rent more affordable [36].
This challenging situation and historical reasons have led to a higher concentration of farms under family-owned businesses, one of the last mechanisms through which new farmers come into the industry. In 2017, 98% of US farms were family farms according to the USDA, and they accounted for 87% of food production [37].
100% 90% 80% 70% 60% 50% 40% 30% 20% 10% 0%
Number of farms Value of production Land operated
N Small Family farms U Large-scale family farms E Midsize family farms Nonfamily farms
Figure 10. Distribution offarms, production value and land operated by farm type, 2017 [37].
Except for high-value crops where they account for 25% of the value of production, non-family farms are responsible for an increasingly lower value of production for numerous crops, such as grains, cotton and dairy (see Figure 11 below for more detail). Currently, family farms seem to serve as one of the last mechanisms to generate new farmers in the sector. Children often inherit land and take over their parents' operations, but this trend has also been decreasing, because of lowering economic incentives, tightening profit margins and higher financial risks.
23% 100%/ 90% 80% 70% 60% 50% 40% 30% 20% 10% 0% 14% 6% 7% 6% 15% 10%, Beef Hogs Cash grains Cotton Dai
and soybeans
0 Large-scale family farms U Midsize family farms
13% 25% 1 10%
IA
76%Figure 11. Value of production for selected commodities, by farm type, 2017 [37].
2.3.2 The lack of economic incentives to become a farmer
Besides buying farmland, one of the major obstacles that hinders the generation of new producers are the lowered economic incentives to become one. The combination of unstable, declining commodity prices, with the surge in input costs in the past decades has had a drastic impact on farm profit levels. Farmers are especially vulnerable to fluctuations in commodity prices, which have been facing a sharp decline despite an uptick in the early 2010s. Corn prices have decreased by 51% between 2012 and 2017, from 6.89 $/bu to 3.36 $/bu, while soybean prices have
decreased by 35% over the period, from 14.4 $/bu to 9.3 $/bu [13].
- Corn Price ($/bu)
$8.0 $7.0 $6.0 $5.0 $4.0 $3.0 $2.0 $1.0 $0.0 $16.0 $14.0 $12.0 $10.0 $8.0 $6.0 $4.0 $2.0 $0.0
Soybeans Price ($/bu)
1985 1987 1989 1991 1993 1995 1997 1999 2001 2003 205 ?007 2009 2011 2013 2015 2017 1985 1987 1(99 1991 1993 1995 1997 1999 2001 2003 2005 2007 2009 2011 2013 2015 2017 Poultry, Hay
excluding eggs
N Small Family farms
ry High-value crops Nonfanily farms 29% 60'
----AIIn parallel, input costs have risen to the point where they exceed the price of the output created by farmers. Farmers now have to rely increasingly on off-farm income to make ends meet, and net returns for major crops such as corn can sometimes be negative.
- Output Price --- Input Price 2.0 1.8 1.6 1.4 1.2 1.0 0.8 0.6 0.4 0.2 0.0 kniCr 0 h 11M tW r -00 ON 0 C9 d W .0r-0
~O
O DC9e t V00 0 00 ON, ON1 ON O 0 00OOO;, NNONON ON CONONON 8000000000088 S-- G (ON ON ON (ON ON a*, O 7 ON l ON % ON 0 0 00 0 0 0 ) 0
Figure 13. Input and output price indices, as computed by the USDA [13].
As a result of decreasing commodity prices and rising input costs, farmers' profit levels have plummeted in the past 50 years. Despite a strong growth in gross cash income stemming from crop production growth (made of crop receipts, animals and product receipts, machine hire, government payments... etc.), cash expenses (interest, labor expenses, input costs, rent.. .etc.) have risen to the point where net cash income (difference between gross cash income and cash expenses) has not been able to keep up.
- Gross cash income - Net cash income - Cash expenses $500000000 $450 000 000 $400 000 000 $350000000 $300000000 $250000000 $200000000 $150000000 $100 000 000 $50000000 $0 0: C' 1 \C 000 C' Cq 't 000 N' -O c00 0 i C1 't 000C C rIt \C 00 0 1~ -\C Vx. r-~~ r- cc c- c- -c cc ~a ~o
-Figure 14. US farming gross cash income, net cash income and cash expenses [13].
Consequently, net farm income margins have steadily decreased in the past decades, from around 35% in the 1960s to around 20% in the 2010s [13].
- Income margin ... Linear (Income margin) 45% 40% 35% 30% ---. . , 25% 20% 15% 10% 5% 0% 0 t 110~
~
00 0 C 't 1- 0 00 0 Cq~
\C 00 0 CAJ~ '.0 cc 00 C:) -t 'O W0 0 r t'0~. Q~
~
~ ~ ~~1
a*, 0CO \0'C N0~O~
ON ON 0 ON 0 ON & 00000DFigure 15. US net cash farm income margin. Derived from [ 13].
Based on a recent FINBIN (an aggregator of US farm business management data) analysis for the years 2014-2016 on 850 crop farms, the average return for cash rented corn was negative $51.82
![Figure 1. World population (millions): historical data and Medium Variant forecasts (1980 - 2050) [7].](https://thumb-eu.123doks.com/thumbv2/123doknet/14221876.483864/19.917.115.763.229.477/figure-world-population-millions-historical-medium-variant-forecasts.webp)
![Figure 3. Global cereal yield growth rates, averaged over 25 year periods, derived from [12].](https://thumb-eu.123doks.com/thumbv2/123doknet/14221876.483864/22.917.232.633.451.675/figure-global-cereal-yield-growth-averaged-periods-derived.webp)
![Figure 4. Yield growth rates for corn and wheat crops in the US, averaged over 25 years [ 13].](https://thumb-eu.123doks.com/thumbv2/123doknet/14221876.483864/23.917.111.759.133.336/figure-yield-growth-rates-wheat-crops-averaged-years.webp)
![Table 6. Real growth of public agricultural research and development spending. From [4].](https://thumb-eu.123doks.com/thumbv2/123doknet/14221876.483864/25.917.150.736.317.522/table-real-growth-public-agricultural-research-development-spending.webp)

![Table 11. Water use efficiency and pressure on water resources due to irrigation. Adapted from [10].](https://thumb-eu.123doks.com/thumbv2/123doknet/14221876.483864/32.917.210.650.168.421/table-water-efficiency-pressure-water-resources-irrigation-adapted.webp)
![Figure 8. Baseline forecasts of agricultural GHG emissions (million tons of C02). From [9].](https://thumb-eu.123doks.com/thumbv2/123doknet/14221876.483864/34.917.199.657.289.563/figure-baseline-forecasts-agricultural-ghg-emissions-million-tons.webp)
![Figure 10. Distribution offarms, production value and land operated by farm type, 2017 [37].](https://thumb-eu.123doks.com/thumbv2/123doknet/14221876.483864/37.917.179.691.491.772/figure-distribution-offarms-production-value-land-operated-farm.webp)
![Figure 11. Value of production for selected commodities, by farm type, 2017 [37].](https://thumb-eu.123doks.com/thumbv2/123doknet/14221876.483864/38.917.146.708.141.452/figure-value-production-selected-commodities-farm-type.webp)
