Calculating Governance: City Benchmarking & Its Discontents By
Tanaya Srinivasakrishnan
Bachelor of Arts in College of Social Studies Wesleyan University
Middletown, Connecticut (2015)
Submitted to the Department of Urban Studies and Planning in partial fulfillment of the requirements for the degree of
Master in City Planning at the
MASSACHUSETTS INSTITUTE OF TECHNOLOGY May 2020
© 2020 Tanaya Srinivasakrishnan. All Rights Reserved The author here by grants to MIT the permission to reproduce and to distribute publicly paper and electronic copies of the thesis
document in whole or in part in any medium now known or hereafter created.
Author_________________________________________________________________ Department of Urban Studies and Planning
May 18, 2020
Certified by _____________________________________________________________ Assistant Professor Jason Jackson Department of Urban Studies and Planning Thesis Supervisor
Accepted by_____________________________________________________________ Ceasar McDowell Professor of the Practice Chair, MCP Committee Department of Urban Studies and Planning
Calculating Governance: City Benchmarking & Its Discontents
By
Tanaya Srinivasakrishnan
Submitted to the Department of Urban Studies and Planning
on May 18, 2020
in partial fulfillment of the requirements for the degree of
Master in City Planning
ABSTRACT
City benchmarks—in the form of rankings, ratings, and other comparisons and commendations represented in different formats and (ostensibly) objectively derived—have rapidly proliferated, such that the concepts they measure have grown in complexity, but not necessarily in sophistication. What began as genuine efforts to capture the essences (and essential differences) of places to inform those at a distance has evolved into an abstract endeavor to understand what makes a quality urban life. This thesis aims to problematize the practice of city benchmarking, understand their persistence despite evident flaws, and identify what is at stake given their widespread and continued use,
especially by and for city government actors. By tracing the evolution of city benchmarks through the lens of different institutional purveyors, I identify who values benchmarks and how they are valued before locating their measurement flaws in the literature. Such flaws include that benchmarks are too reliant on technocratic expertise, valorize transparency as an unmitigated good, and
ultimately deliver a flattened and decontextualized partial perspective to audiences. And yet, city actors continue to rely on them to inform various decision-making processes, as confirmed by a series of interviews I conduct with a set of urban actors primarily working in mid-tier American cities. I use these interviews, informed by the Foucauldian analytics of governmentality and discipline, to theorize about the effects and consequences of city benchmarks as governing agents. As governing agents, city benchmarks rationalize the practice of governance as one that is highly technical, specify spheres of concern for cities, transform city identities based on the statuses they bestow, and neutrally promote utopian ideals without declaring any normative commitments. I argue that the power of city benchmarks is disciplinary in nature, which is a cause for concern as city actors internalize their logics through both seductive and resistant forces.
Thesis Supervisor: Jason Jackson
Acknowledgements
There are many people without whom this thesis could not have been completed. To properly thank all those who have influenced this project is a daunting task, but here is my attempt.
First and foremost, I’d like to thank Professor Jason Jackson for his early encouragement of this project and continued reassurance, especially through the final thesis stretch. Thanks also to Professor Catherine D’Ignazio for multiple rounds of thoughtful edits.
Additional encouragement for this project came from Professor Arindam Dutta, who forced me to contend with why my questions mattered, and Professor Karilyn Crockett, who assured me that they did, even if I didn’t yet know why. Thanks to both.
Thanks are also due to Professor Justin Steil for his research guidance throughout my time at DUSP, and the tireless efforts of those in DUSP HQ, especially Ellen Rushman, for their steady show of support through what became a fairly chaotic final semester in the department.
I would not have pursued a graduate education in City Planning without the excellent examples and constant encouragement of my D.C. friends and mentors. Thanks to Carlos, Solomon, Diana, Diane, Erika, Rolf and all those supervisors who indelibly influenced my development as a researcher and thinker. And thanks to Somala, Ruthy, Sara, Jasmine, Maia, Jay, Shiva, and Carl for demonstrating what it means to be scholar-urbanists, or something less insufferable than that. I am forever grateful to have made lifelong friends (at work!) that can also always help me with my homework.
To Micaela and Austin, thank you for always answering my texts—no matter how incessant or harrowing. To Julia, Annie, and Stephen: thanks for sticking with me these past two years, and especially these last two months. I can’t wait to backyard bocce with you all very soon.
To Kat, I quite literally could not have survived Cambridge without you. Thanks for your couch, your patio, and your care through not one, but two theses! Andrew, thank you for keeping me fed and accountable, for improving most of my ideas and listening to all of them, and for your good taste. Soon we’ll be terraforming our island getaway!
Finally, I am exceedingly grateful for the good health, great cheer, and continuous snacks that my family has always provided, but especially so during this pandemic. Mom, Dad, and Ruchira, I can’t wait to make you visit once this is all over. Each and every one of my accomplishments is due in large part to your high expectations and unwavering support.
Table of Contents
ABSTRACT 2
ACKNOWLEDGEMENTS 3
TABLE OF CONTENTS 4
CHAPTER ONE: INTRO 5
1. The Inciting Incident 6
2. Understanding the Persistence of City Benchmarks 10
3. Charting a Thesis Trajectory 11
4. Data & Methods 12
CHAPTER TWO: A PRIMER ON CITY BENCHMARKS 16
1. Benchmarks by the Private Sector 18
2. Benchmarks by Media Outlets 23
3. Benchmarks by Academic & Research Institutions 26
4. Benchmarks by Cities & Their Consultants 31
5. Conclusion 33
CHAPTER THREE: CRITICAL APPROACHES TO CITY BENCHMARKS AS MEASUREMENT 34
1. The Urbanist Assessment of City Benchmarks 35
2. Situating City Benchmarks in the Quantification & Commensuration Literature 39 3. Conclusion: Motivating the Need for an Alternative Understanding 50 CHAPTER FOUR: PROBLEMATIZING CITY BENCHMARKS AS GOVERNANCE 52 1. City Benchmarks & The Analytics of Government 55
2. The Disciplining Effects of City Benchmarks 63
3. Conclusion: Ambition, Market Logics & A Normative Void 70
CHAPTER FIVE: CLOSING REFLECTIONS 72
Chapter One: Intro
City benchmarks—in the form of rankings, ratings, peer sets and cohorts, indexes and other comparisons and commendations represented in different formats and (ostensibly) objectively derived—have proliferated rapidly in recent years, such that the concepts measured by these
benchmarks have grown in their complexity, but not necessarily in their sophistication. What began as genuine efforts to capture the essences (and essential differences) of places to inform those at a distance has evolved into a far more abstract endeavor to understand what makes a quality urban life. City benchmarks are now abundant and broadly conceived, often measuring concepts like the relative “livability,” “economic and cultural vibrancy,” “opportunity,” “inclusivity,” “happiness,” and “playfulness” of cities, among other similarly abstruse concepts.
This rise in the commensuration of the urban experience dovetails with the rapid progression of quantification in the social sciences more generally, and both have had their fair number of critics. In the general case, critiques have been lobbed from methodologists, sociologists, political scientists and consultants; in the city-specific case, add to this list geographers, planners, local government officials and other urban practitioners. No matter the benchmark, the critiques all begin with a similar question, namely, what is actually captured in attempting to quantify such notional qualities? While their manner of answering this question obviously differs by discipline, the ultimate message of these critiques is clear: city benchmarks are often methodologically shoddy, conceptually
flattening, and generally misleading in myriad respects. Despite these generalized and widespread objections, over 500 different city rankings and benchmarks have been published in just the last decade (Moonen 2019). As its primary motivator, this thesis seeks to understand why.
1. The Inciting Incident
My interest in understanding why and how city benchmarks are used stems from the fact that I was formerly a benchmarking insider. For three years, I worked as a policy researcher at a national think tank studying different aspects of cities including their housing quality, demographic change, economic opportunity, and social inclusion. Part of my job was to quantify and compare these aspects. The priorities were clear: 1) find the most robust statistical representation of some urban quality to 2) ensure the results pass muster with gatekeepers like philanthropic funders, other research institutes, and the cities themselves, but 3) make sure the data are free and available across various geographies, and 4) simplify the methods so they appear legible to any potential interpreters.
Of course, this was no easy task, and from the beginning, our team sounded concerns. First, the only reliable and reliably free data we had access to were from the Census. This meant that we needed to measure our phenomena at the Census-defined city geography, whose boundaries sometimes changed. This inevitably led to challenges related to our sample. We ultimately decided on defining our universe of cities by population, but in including any city with over 100,000 in population, we ended up with a sample biased toward the east coast, with far fewer cities in the middle of the country or toward the west.
Next came troubles with our methods. By working with such a large sample, we foreclosed on the ability to represent the data individually; using narrative techniques would be too much work, and presenting every data point for each city in a graph or even on individual graphs would have been too overwhelming. Thus, we made the devil’s bargain: knowing full well that rankings were controversial, we needed a way to easily communicate city performance to an audience we assumed were not particularly data-savvy, and the relativity of rankings provided an easy narrative while also allowing us to control for macro trends. Never mind the huge caveat that with rankings also came
the false narrative of “best” and “worst,” whereby some cities would look artificially bad despite suboptimal macroeconomic trends across the sample and vice versa. The legibility and digestibility of ranking our data won the day.
But what would we rank? Raw data, cleaned up to reflect single indicators were one option and would ensure the actual numbers were centered in our output. Given the audience, however, we decided on bundling indicators into indices that told more powerful stories narratively. For example, our indicators for a city’s level of income segregation (an indexed measure, itself), share of rent-burdened residents, number of working-poor families, and highs school drop-out rate, were combined—but crucially, unweighted—to create an index of economic opportunity. Note that because this index included data as indexed calculations, percentage shares, and numbers, the raw indicators had to be normalized before they could be summed. In using z-scores instead of the actual indicators, the project distanced itself once more from the actual conditions on the ground in any given city, and as its creators, we took another step away from being able to understand what it was that we were measuring.
These sorts of editorial choices were littered across the study. For example, after combining a measure of racial segregation (again, an index), the percentage-point difference between the share of white homeowners and share of non-white homeowners, and the gap in poverty rates between these two groups, we realized that the top performing cities were those with fewer black or Hispanic residents. In order to counteract this effect, we added into the index a measure for the city’s share of people of color. With the new index, instead of punishing cities that are more diverse, we valorized the sheer existence of people of color in a place. Neither approach truly captured what it would mean for all races to be meaningfully included in places, but then again, how were we to measure a concept so complex as racial inclusion in a set of indicators anyway?
Despite these methodological challenges, we forged ahead. Our next step was to identify cities to feature as case studies, which was the focus of our next heated debates. Should the top cities be selected, given that they were statistically the “best”? Are the conditions in the top cities replicable enough to be informative? Is there some value in highlighting the “worst” cities, as cautionary tales of what to avoid? We settled on a blended strategy, selecting four top scoring cities based on wanting representatives from every region of the country, identifying different kinds of success stories, and, more strategically, where we had relationships, and where we wanted to build them.
In practice, the top-ranking city in terms of economic opportunity in our index had an oil rush to thank for its performance. The rush occurred a decade prior, and attracted scores of young men to the city for the high-paying, low-skilled oil industry jobs. Upon further investigation it was revealed that many of these young men had dropped out of high school to pursue their fortunes as rig operators, but the decadal data we used for the high school dropout rate was not sufficiently sensitive enough to capture this effect. Another top-ten city was selected for a case study based on its especially strong performance in racial inclusion, but local stakeholders were very shocked to hear of our findings. To them, the city’s history of racial exclusion and persistent disinvestment in the city’s black neighborhoods were obvious. We looked through local news clippings from the years in which the city performed best and found a rather obvious explanation: the city and county had completed a highly contentious merger in which the majority-black city was subsumed by the majority-white county. Recall the indicator for share of people of color included in the racial inclusion index; in this case, the drastic increase in people of color year-over-year due to a simple boundary change almost entirely drove the results for the most racially inclusive city in the country.
In our defense, we were very up front about these shortcomings in the convening we hosted to validate and share our findings. The attendees included leading urban policy experts, prominent philanthropic funders, and service providers and government officials from various cities featured.
We detailed how we selected indicators and our theory of change as to how they contributed to various indices, the methodological limitations, the policy recommendations we thought were actionable and the others that were merely interesting but not replicable. To my surprise, these limitations did not seem to faze our attendees, who were either more concerned with the
fundamental scoping of the project (i.e. why we chose to measure our phenomena at the city level as opposed to county or metro) or had already shifted their attention to how the data and case studies could be used. Even in this small room, a microcosm of urban actors, the numerous editorial
choices we made that significantly affected our results did not seem to bother anyone. This relatively data-savvy crowd was highly invested in the rankings, poring over the various charts we made to visualize city performance over time. They seemed more interested in understanding how their city fared and debating impressions of other cities than analyzing any of the individual metrics or unpacking the contextual specificities that made certain policy recommendations possible.
When the indices were finally published, I expected some backlash given the wider audience newly able to check our findings against their lived experiences. Instead, the report was an
unmitigated success. Top-ranking cities released numerous press releases bragging about their recent commendations. Bottom-ranking cities contacted us to dispute certain characterizations. The most interesting response, however, came from the cities in the middle. Those cities that were neither the best nor the worst were genuinely interested in discussing their performance: to which areas of urban policy they should shift their attention, in what realms we identified competitive advantages, how to interpret the performance of neighboring or peer cities, and the strategies they could use to improve their performance next time. While we never released another iteration of the study (though our use of rankings across research products only increased), we did have lengthy
engagements with these middle-ranked cities about how they could improve their hypothetical rank in the months and years to come.
2. Understanding the Persistence of City Benchmarks
It is precisely these reactions to benchmarks—the somewhat confounding responses betraying an investment in benchmarks despite the obvious conceptual and functional flaws of the
measurements—that continually surprised me as a researcher and serve as the inspiration for this inquiry. The continual usage of benchmarks and wide appeal seemed to defy rationality. The same pundit who called for a “death to livability” rankings, for example, also opines on a new ranking or other urban benchmark almost monthly (O’Sullivan 2019). The same academic who assured me that “rankings basically have no legitimate use in the [real estate] field,” is also designing his own ranking of the best cities for small investors, to be released later this year.1 The same chief methodologist
who, in reviewing our study design, expressed his strong discomfort with our approach, has still sanctioned multiple similar studies in its wake. As one city actor asserted regarding her city’s
investment in benchmarks, “perception is not reality, but that does not mean it isn’t powerful.”2 One
could blame hypocrisy, but sheer hypocrisy does not seem sufficient to explain how city benchmarks persist in the field, and is certainly unsatisfying in that it would not begin to grapple with what is at stake given their continued use. Such an explanation would not account for the real power that benchmarks seem to have in the realm of urban policy, or at the very least, their real political influence.
The object of city benchmarks, namely, cities, is especially important to understand insofar as cities are a discrete unit of government through which democratic experimentation and unmediated interactions with the state are made possible. As such, a more pressing question to consider is what
1 Benchmark Purveyor #1, interview by author, November 11, 2019. 2 City Actor #3, City A, interview by author, January 17, 2020.
power benchmarks hold for relevant urban actors, especially those with some semblance of state power, and what the consequences are of this power being exercised. If the power of benchmarking in the urban context is merely discursive, then a robust critique could be enough to dispense with this commensurative practice, but those posing critiques offer strategies to rehabilitate benchmarks in the same breath. The staying power of benchmarks in the urban planning and policy world is clear, but how are we to understand this power? While I am clearly uninterested in rescuing city benchmarks from their own limitations, my inquiry is aimed at specifying the modes in which city benchmarks do their “work”—be it discursive, political, economic, or other—and exploring what effects their influence may have in an effort to make these processes more legible.
3. Charting a Thesis Trajectory
Having briefly motivated the investigation, this analysis will unfold in four parts. Chapter Two offers an abbreviated primer on city benchmarks, featuring an institutional focus that organizes typical benchmarking approaches by their purveyor; namely, those created by the private sector, media outlets, research and academic institutions, and cities themselves. The primer serves to explain who values benchmarks and how and why they are valued, but also searches for any approaches to benchmarks that are potentially redeemable. Chapter Three then takes up the existing critiques of city benchmarks as a tool of measurement, in part to understand if the critique presented above is fairly privileged information. The degree to which benchmarks have been critiqued across disciplines (and by city actors themselves) warrants my characterization of them as “widespread and generalized objections” that have existed for decades across diverse fields. The synthesis of existing critiques reveals a major explanatory gap in the literature regarding the power of the practice of
an alternative critique of city benchmarks as a tool of governance. I propose that the persistence of city benchmarking is better explained as an agent of governance than as pure measurement alone. The analytical framework I detail draws heavily from the Foucauldian concepts of governmentality and discipline to more fluently discuss the politics and power of city benchmarks. Chapter Five
concludes in considering the normative implications of the alternative understanding proposed and the need for a politicized path forward.
This approach borrows from the tenets of “critical urban theory” proposed by Peter Marcuse, which highlight the need to expose, propose, and politicize urban phenomena (Marcuse 2009). In bringing political and social theory to bear on an often-used but understudied commensurative practice in cities, some definitions are helpful. Marcuse defines theory as an “attempt to understand, to explain, and to illuminate the meaning and possibilities of the world in which practice takes place”(Marcuse 2009, 185). It defines practice as the set of experiences that “…develop the potential of existing urban society” (Marcuse 2009, 186). These concepts all combine to inform critical urban
theory, which ideally “…should help deepen the exposé, help formulate responses that address the
root causes thus exposed, and demonstrate the need for a politicized response” (Marcuse 2009, 195). The diverse modes of inquiry utilized in this thesis are employed to further the application of critical urban theory to the commensurative forms used to motivate, commend and criticize urban actions.
4. Data & Methods
It is difficult to critically analyze commensurative practices without falling prey to the tendency to further commensurate. As such, this thesis will avoid the practice of “rating place ratings” or serving similar meta-evaluative functions. Given my interest in the reactivity of such measures, it is important to note that such effects are extremely difficult to quantitatively model without the
possibility of experimental design,which was well outside the scope of this inquiry. Instead, the initial exposé and categorization of city benchmarks presented in Chapter One relies on a database of my own construction. The database includes 50+ city benchmarks and categorizes them by geographic scope, stated purpose, intended audience, data sources, methods used, and makes note of any subsequent communications from purveyors regarding their benchmarks or reactions to
benchmarks that are generally available via Internet search. Benchmarks were selected for the database based on notoriety (as judged by Google Scholar citations, as well as the benchmarks of record that emerged through my interviews with purveyors and urban actors); publicly available benchmarks were prioritized, given that ascertaining information about proprietary benchmarks proved difficult. I use this database along with14 interviews I conducted with architects of a sample of these benchmarks to analyze benchmarks in terms of their intentions, uses, and effects, which were also included in the database.
The alternative analytical framework I propose draws from literature in political economy and theory as well as 17 personal interviews with city actors familiar with benchmarks and their uses. I use these interviews to “confirm, falsify, and above all, to refine” my theory of benchmarks as a tool and agent of governance, drawing from Ray Pawson’s approach to theorizing with qualitative methods (Pawson 1996, 299). Pawson’s methodology prescribes that researchers offer their “potential explanations for a closely circumscribed set of actions,” so that respondents can be involved in providing a “closer articulation and clarification” of the theory proposed (Pawson 1996, 311). Owing to their theoretical bent, my interviews were broader in scope and asked interviewees to reflect on the actions and psyches of many players across each of their cities. In light of this
methodological approach and the request for broad comment on a number of city actions, confidentiality was offered to respondents as a condition of agreeing to be interviewed, so
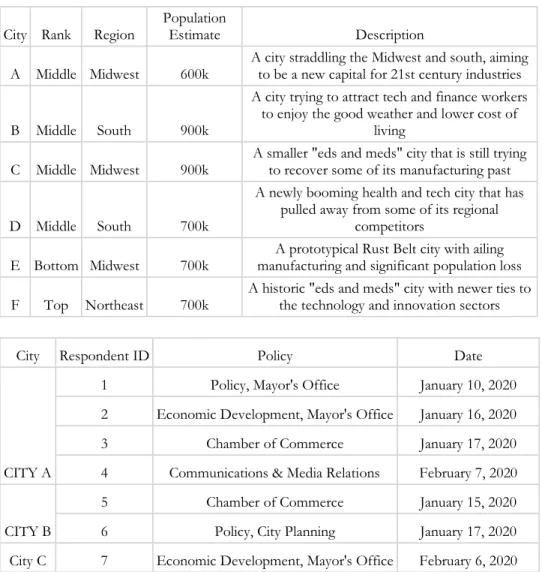
between November 2019 and April 20020 and those with city actors were conducted between January and March 2020. While I primarily employed a snowball sampling method to select interviewees, preference was given to purveyors so as to represent every kind of institutional actor and to actors from middle-ranking cities, as these were of primary interest to the inquiry (See Tables
1 and 2 for an anonymized description of interview respondents). While these data and methods are
obviously limited in their ability to demonstrate causality, the qualitative approach I have taken here makes room for critical interpretation and theoretical speculation, instead of purporting objectivity like the benchmarks themselves often do.
Table 1. City Actor Interview Respondents by City
City Rank Region Population Estimate Description
A Middle Midwest 600k A city straddling the Midwest and south, aiming to be a new capital for 21st century industries B Middle South 900k
A city trying to attract tech and finance workers to enjoy the good weather and lower cost of
living
C Middle Midwest 900k A smaller "eds and meds" city that is still trying to recover some of its manufacturing past
D Middle South 700k
A newly booming health and tech city that has pulled away from some of its regional
competitors
E Bottom Midwest 700k manufacturing and significant population loss A prototypical Rust Belt city with ailing F Top Northeast 700k A historic "eds and meds" city with newer ties to the technology and innovation sectors
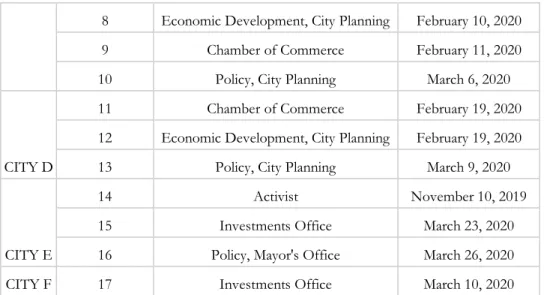
City Respondent ID Policy Date
CITY A
1 Policy, Mayor's Office January 10, 2020 2 Economic Development, Mayor's Office January 16, 2020 3 Chamber of Commerce January 17, 2020 4 Communications & Media Relations February 7, 2020
CITY B
5 Chamber of Commerce January 15, 2020 6 Policy, City Planning January 17, 2020 City C 7 Economic Development, Mayor's Office February 6, 2020
8 Economic Development, City Planning February 10, 2020 9 Chamber of Commerce February 11, 2020 10 Policy, City Planning March 6, 2020
CITY D
11 Chamber of Commerce February 19, 2020 12 Economic Development, City Planning February 19, 2020 13 Policy, City Planning March 9, 2020
CITY E
14 Activist November 10, 2019 15 Investments Office March 23, 2020 16 Policy, Mayor's Office March 26, 2020 CITY F 17 Investments Office March 10, 2020
Table 2. Benchmark Purveyor Interview Respondents by Type
Respondent ID Purveyor Date 1 Research Institution November 11, 2019 2 Research Institution November 19, 2019 3 Research Institution December 8 ,2019 4 Media Outlet Jan 9, 2020 5 Private Sector January 18, 2020 6 Research Institution January 22, 2020 7 Research Institution January 30, 2020 8 Private Sector February 2, 2020 9 Private Sector February 9, 2020 10 Media Outlet February 13, 2020 11 Research Institution March 3, 2020 12 City Consultant March 7, 2020 13 Private Sector March 11, 2020 14 Research Institution April 7, 2020
Chapter Two: A Primer on City Benchmarks
It is helpful to understand the breadth of benchmarking activities currently undertaken by and for cities before situating the phenomenon in the literature. This primer is therefore organized by purveyor as a way to understand who values benchmarks, for what purpose and for whom. By “benchmark” I mean any product that aims to provide a standard or point of reference against which city performance can be compared or assessed (Merriam Webster n.d.). Broadly defined, benchmarks most typically feature pure rankings, but can also take the form of different rating or grading systems, or less finite comparisons between peer sets or cohorts. This review primarily focuses on rankings, as they are the most common in relation to cities and are better-researched than other quantification techniques, but also includes other formats when they are relevant to the
audiences served by or effects of the benchmark.
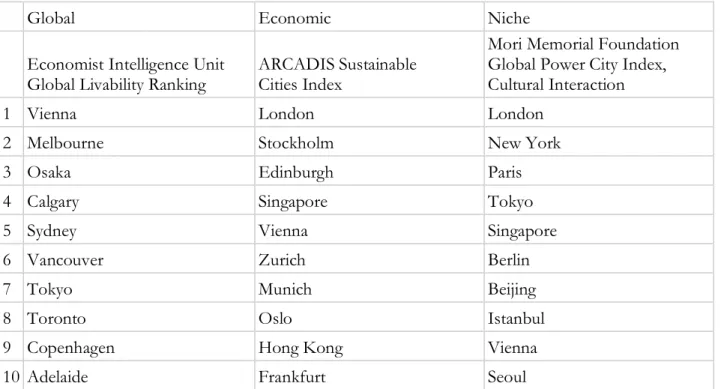
A highly cited survey of city benchmarks published in 2015 uses benchmarks, rankings, and ratings interchangeably, thus ignoring the subtly different editorial choices based on format that can have significant effects on how such benchmarks are used (Leff and Petersen 2015). This literature subsequently characterizes city rankings by their content and contends that the rankings largely fall into three categories: those that are more global or comprehensive in their scope, those particularly focused on measuring economic performance alone, and the mostly bespoke rankings that measure a subset of niche topics (see Table 3 for examples).3 The more global rankings (wherein “global”
reflects a wider scope, and not necessarily the geographic scale at which the ranking operates), such as those offered by U.S. News and World Report, PricewaterhouseCoopers, and the Economist Intelligence Unit, tend to elevate large, developed cities in the west (Leff and Peterson 2015). The
3 It should be noted that all of the example rankings presented throughout this chapter utilize different universes of
cities; they are not comparable to one another in this sense, and the examples are meant only to be illustrative of the trends.
economic performance rankings, while slightly more diverse in their geographies, are perhaps the most narrowly pitched. They include offerings from firms like McKinsey, ARCADIS, IBM, and Mercer, and privilege “global cities,” largely in the west and in East Asia. The niche set, including those measuring the abstract concepts referenced above, unsurprisingly is host to the most varied and evolving collection of players; these players include think tanks, media outlets, nonprofits or consultancies that range widely in reputability. Naturally, they also celebrate the widest array of cities, especially in terms of size and economic power.
Table 3. Sample of 2018 (top ten) city rankings by focus area (Leff and Petersen 2015)
Global Economic Niche
Economist Intelligence Unit
Global Livability Ranking ARCADIS Sustainable Cities Index
Mori Memorial Foundation Global Power City Index, Cultural Interaction
1 Vienna London London
2 Melbourne Stockholm New York
3 Osaka Edinburgh Paris
4 Calgary Singapore Tokyo
5 Sydney Vienna Singapore
6 Vancouver Zurich Berlin
7 Tokyo Munich Beijing
8 Toronto Oslo Istanbul
9 Copenhagen Hong Kong Vienna
10 Adelaide Frankfurt Seoul
While there are some differences that can be identified between the three groups above, their characterization by content flattens what are actually meaningful differences in scope, intended purpose, audiences, and effects based on the purveyors of the benchmarks. While the above assessment takes private sector creators as its primary focus, the niche category has seen the most growth and change in the intervening five years since it was published. Especially since this inquiry is
chiefly concerned with the effects of benchmarks—how they are used and by whom—the survey offered here uses an institutional lens, dividing benchmarks between private sector, media, and academic, and city (consultant) creators who each segment their audiences differently, and accordingly have different use cases.
1. Benchmarks by the Private Sector
The rankings, ratings, and other indices created by companies in the private sector have undoubtedly represented the prototypical benchmark historically and make up by far the largest share of benchmarks today. These benchmarks date back to the 1970s, when the Swiss bank UBS released their ranking of comparative purchasing power in 72 cities around the world and have largely served the same purpose since: namely, to inform large multinational firms on various aspects of the costs of doing business in cities across the globe (Leff and Peterson 2015). Today, the most prominent rankings of this kind are provided by the Economist Intelligence Unit and Mercer, two business intelligence firms, and measure livability (broadly defined; Deutsche Bank offers a
competing measure of livability as well). Other management consultancies offer indices measuring opportunity (PWC), globalization (KOF and UBS), and sustainability (Arcadis). Real estate
consulting firms like JLL and Savills are also prominent players here and tend to offer many more, and sometimes bespoke, rankings for their investment clients.
Geographic Scope
In terms of geographic scope, this set of benchmarks are certainly most susceptible to a global-northern bias. This is not altogether surprising, given that many firms undertake these benchmarks for specific clients with limited investment portfolios. These rankings are most likely to
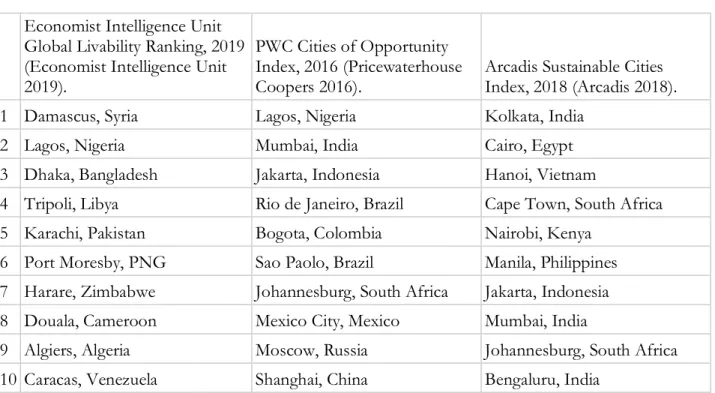
celebrate the Nordic cities, given their focus on livability and ease of business, and least likely to feature cities in developing countries, beyond a nod to the “Asian Tigers.” In all of the rankings mentioned above, Latin American and African cities exclusively make up the bottom ten, and no North American or European city appears even in the bottom third (see Table 4). These rankings also generally focus exclusively on the most populous cities within a region, though some economic anomalies are consistently included. For example, despite San Francisco being the 15th largest city in
the United States by population, it is consistently benchmarked by the private sector for its unique economic fundamentals; meanwhile, cities like Houston, Phoenix, and Philadelphia (the 4th, 5th, and
6th most populous American Cities) are rarely included here.
Table 4. Sample of the bottom-ranking cities in benchmarks by the private sector Economist Intelligence Unit
Global Livability Ranking, 2019 (Economist Intelligence Unit 2019).
PWC Cities of Opportunity Index, 2016 (Pricewaterhouse
Coopers 2016). Arcadis Sustainable Cities Index, 2018 (Arcadis 2018).
1 Damascus, Syria Lagos, Nigeria Kolkata, India
2 Lagos, Nigeria Mumbai, India Cairo, Egypt
3 Dhaka, Bangladesh Jakarta, Indonesia Hanoi, Vietnam
4 Tripoli, Libya Rio de Janeiro, Brazil Cape Town, South Africa
5 Karachi, Pakistan Bogota, Colombia Nairobi, Kenya
6 Port Moresby, PNG Sao Paolo, Brazil Manila, Philippines 7 Harare, Zimbabwe Johannesburg, South Africa Jakarta, Indonesia 8 Douala, Cameroon Mexico City, Mexico Mumbai, India
9 Algiers, Algeria Moscow, Russia Johannesburg, South Africa 10 Caracas, Venezuela Shanghai, China Bengaluru, India
In terms of indicators, these investment-focused rankings generally include some proxy for city-level GDP growth, as well as some combination of employment, education, health, and crime figures. They almost universally focus on high-income employment (number of Global 500 HQs, for example) and other approximations of a city’s importance to and integration in its regional economy. Many also include consumption metrics, valuations of capital markets or foreign direct investment, and other purely economic indicators that are often adapted from national-level measures.
Regardless of whether they say so in name, most private sector benchmarks try to
incorporate livability indicators in their rankings. The Economist Intelligence Unit’s creates its own ratings for indicators that fall into five thematic buckets including (political) stability, healthcare, culture and environment, education, and infrastructure. The indicators that are more qualitative in nature, like the threat of civil unrest (stability), quality of public healthcare, level of censorship (culture and environment), availability of private education, and the quality of public transport (infrastructure), are derived from the judgment of EIU-employed country analysts both internal to the company and based in the field. Some of these indicators are actually composites of other ratings and the weights applied to each thematic bucket are left unexplained (e.g. it is unclear why a city’s educational offerings only contribute to 10% of its livability whereas its cultural and environmental offerings count 2.5 times more). In terms of other indices, PWC’s Opportunity ranking seems to focus its instrument on business opportunity, incorporating measures like airport connectivity, ease of commute, and corporate tax rate, as well as other competing indices including A.T. Kearney’s measure of entertainment attractions, Mercer’s housing metric, and the World Bank’s ease of starting a business indicator. Interestingly, PWC measures its own employees’ impressions for some indicators like ease of commute, thus putting a fine point on whose opportunity they are concerned with (Pricewaterhouse Coopers 2016). The private sector sustainability indices purport to measure
more “citizen-centric” conceptions of sustainability, but combine personal wellbeing and economic outlook metrics quite shamelessly. For example, the “people sub-index” for Arcadis’s Sustainable Cities Index measures employee amenities like digital connectivity and transportation access, and packs its “profit sub-index” with the typical GDP and business infrastructure metrics.
Environmental sustainability indicators, at least traditionally conceived, only make up two of ten sub-indices (Arcadis 2018). Though data availability is a problem regardless of type of purveyor, in general, this group of benchmarks was far more likely to feature purchased and proprietary data than those from media outlets or research institutions. Using national data where city data was
unavailable also occurred more than once in this cohort, indicating a greater comfort (or perhaps, greater authority) in sharing data that was not necessarily representative.
Unsurprisingly, benchmarks from the private sector tend to be far less methodologically transparent than those benchmarks from other sectors. The standard formula for these indices calls for a composite index made of anywhere from three to ten sub-indices that are averaged together to create a final city score. Sometimes this city score is normalized across the sample, so that for a benchmark ranking 30 cities, the top-ranking city will have a score of 100 and the worst-ranking city will have a score of 0. Given that the cities are already ranked, this additional extrapolative measure is generally unnecessary insofar as it fails to add to the user’s understanding of the phenomena being measured, but purveyors often use this strategy to simplify their reporting. The scores for the sub-indices that make up the final score, however, are much more statistically involved in that they typically each include a varying number of measures that are weighted according to schemes that are rarely coherent. The Arcadis Sustainable Cities index is perhaps the worst offender I studied; its three sub-indices include 13, 11, and 7 indicators respectively, but each of these indicators are comprised of anywhere from one to five raw metrics, which are each weighted at percentages ranging from 4% to 18% (Arcadis 2018). The effect is that their sustainability composite rating
weights measures like employment rate and city GDP at 18%, but natural disaster susceptibility and carbon emissions at 4% (Arcadis 2018).
KPMG’s “Benchmarking City Services” report offers an interesting methodological outlier in the private sector set. This report, focused on comparing the level and quality of city services offered around the world, only used self-reported data from its universe of cities, anonymized all of its data so participating cities only knew their own performance but could not identify competitors, and did not generate any composite indicators or indices. Instead, having identified a theoretical grounding (in the Municipal Reference Model) and service areas where data were most readily available and comparable across geographic context, KPMG reported one indicator of service efficacy in its raw form for each of ten service areas (e.g. percent of transit costs covered by revenue for the transit service area, or days to issue a building permit for its permitting and enforcement service area) and compared anonymous cities to the average across the sample for each indicator. Such an approach is very unique across benchmarks of all types and is likely only possible given the study’s significantly smaller scope and sample size (KPMG could only identify 35 cities with the capacity to report on city service indicators, so only included these 35 in the study) (KPMG 2017). Explanations as to the weighting logic are rarely provided in methods documentation and when asked to clarify their methods in interviews, many purveyors declined to comment, citing the proprietary nature of this information.
Typical Uses
In general, benchmarks from the private sector are used by large multinational firms to decide where to open new headquarters and to key employee compensation packages to the quality of life said employees can expect to enjoy once relocating. Such firms aim to split the difference between cities where the quality of life is high enough to encourage employees to relocate, but low enough
where the costs of doing business are still affordable. Put simply, where cities perform well on livability indicators, employers can get away with paying employees less; where livability suffers, employees must be compensated at higher rates to move. The other obvious motivation of private sector purveyors in creating such benchmarks is to drum up business. The management
consultancies generally provide these benchmarks to identify new problems they can help lower-ranking cities solve. Benchmarks of all kinds have an interesting psychological effect in that they can simultaneously feign objectivity while inciting an emotional response and private sector benchmarks are very effective at using this response to their favor, especially for a certain kind of city with world-class ambitions.4 This idea will be explored in greater detail in Chapter Four.
2. Benchmarks by Media Outlets
Media outlets gained interest in city benchmarking around the same time that the practice was blossoming in the private sector. These benchmarks, usually in the form of rankings or even looser best and worst categories, are likely the least methodologically rigorous and most popularly
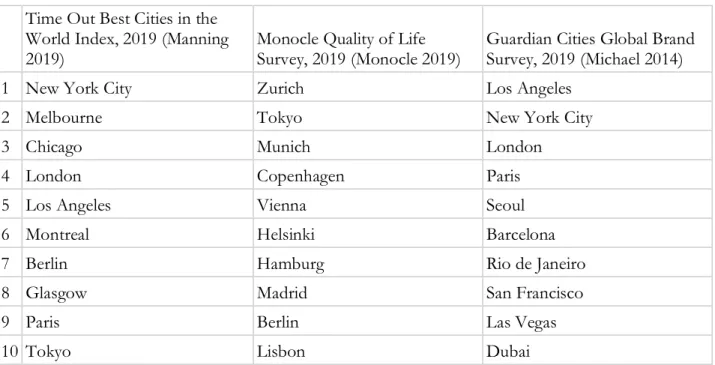
consumed. Common benchmarks of this kind include Time Out’s “Best Cities” ranking, Guardian Cities “Global Brand Survey,” Monocle’s “Quality of Life Survey,” and even The New York Times’ “52 Places to Go” series, which despite its strictly touristic focus, still operates similarly to the other benchmarks in this group. Given their general lack of rigor, my review of media-created benchmarks will be brief.
Geographic Scope
In terms of geographic scope, media-created benchmarks are similarly biased against cities off the beaten touristic path. North American and European cities are featured more often, given their accessibility and notoriety. Even so, there are generally more surprises to be found in the latter halves of these benchmarks precisely because there are fewer limitations around data availability or investor interest. In this cohort of benchmarks is where smaller American cities are often included (e.g. Seattle, Washington DC, and Boston) as well as true outliers like the Guardian’s inclusion of Chittagong, Bangladesh as a city with a relatively weak brand, or Fukuoka, Japan as Monocle’s 22nd
most livable city (See Table 5).
Table 5. Sample of the top-ranking cities in benchmarks by media outlets Time Out Best Cities in the
World Index, 2019 (Manning 2019)
Monocle Quality of Life Survey, 2019 (Monocle 2019)
Guardian Cities Global Brand Survey, 2019 (Michael 2014)
1 New York City Zurich Los Angeles
2 Melbourne Tokyo New York City
3 Chicago Munich London
4 London Copenhagen Paris
5 Los Angeles Vienna Seoul
6 Montreal Helsinki Barcelona
7 Berlin Hamburg Rio de Janeiro
8 Glasgow Madrid San Francisco
9 Paris Berlin Las Vegas
10 Tokyo Lisbon Dubai
Indicators and methods are very difficult to discern for this set of benchmarks, and in some cases, journalistic license is the primary mode of city selection.5 One unique feature of these
benchmarks is that their data is often user-generated: media outlets will ask their readership to complete surveys about their experiences living in or visiting a city, but how these data are subsequently aggregated and analyzed is rarely documented publicly. The flexible forum for gathering data allows media outlets to ask highly subjective questions, such as “what is the typical price of a good lunch?” or “how attractive do you find your city?,” and create indicators of city quality or livability from their responses (Manning 2020). In using less rigid data, these benchmarks are also able to measure more diverse concepts—ideas like the most sleep-deprived (Paris), happiest (Chicago), and least lonely (Buenos Aires) cities—but the legitimacy of such commendations are obviously suspect (Manning 2020). Where journalistic license prevails, cities will be selected based on narrative or need. For the Times’ travel ranking for 2020, the newspaper’s travel desk admits to taking suggestions from staff for places that seemed “newly fresh or compelling,” and then further examining cities that may need a boost due to recent economic downturn (the Bahamian city of Nassau) or environmental threat (Sicily) (Virshup 2020). This particular benchmark, described as a “boutique airline advertisement” in one interview with a journalist, also looks to highlight new places and the businesses that make visiting them possible.6
Typical Uses
Despite the lack of statistical robustness or methodological rigor evident in this set of rankings, I include them in this review because they most clearly demonstrate a key use of city benchmarking regardless of purveyor; that is, to build and manage a city’s reputation. The rankings detailed here are
5 Benchmark Purveyor #4, interview by author, January 9, 2020. 6 Ibid.
often cited by cities’ residents (or their public relations staff) for bragging rights and encourage a pride in place (or touristic curiosity) that can certainly be instrumentalized, even if it is sometimes unclear what end such commendations serve.7 Some argue that user-generated benchmarks are
actually significantly more accurate in that they tend to have larger sample sizes, both in terms of responses and by not restricting the universe of cities they compare, and because they actually reflect lived experiences and the opinions of real residents. This kind of benchmark is less relevant to the present inquiry insofar as few city governments take benchmarks created by media outlets seriously, but the reactivity of user-generated rankings is still an interesting topic to consider, especially as this mode of data collection grows in popularity.
3. Benchmarks by Academic & Research Institutions
City benchmarks created by academic, research, and nonprofit institutions have grown in number and popularity especially in the past decade, but this group is relatively under-scrutinized compared to similar offerings from the private sector. One source quipped that this lack of scrutiny was due to the “cloak of legitimacy” under which such institutions operate.8 This was certainly
palpable in speaking directly with city representatives who readily criticized private sector and media benchmarks but were very open to assessments offered by academics. This set of benchmarks were also the most diverse in their topics, indicators, geographic scope and methodologies, which is perhaps another reason that few have commented on trends across the academic benchmarking space. Benchmarks from The Brookings Institution and the Urban Institute were often cited by cities domestically, while reports from The United Nations and World Bank Group were more
7 Benchmark Purveyor #10, interview by author, February 13, 2020. 8 Benchmark Purveyor #14, interview by author, April 7, 2020.
popular internationally. Smaller and more local research labs and centers at universities have also newly entered the benchmarking space.
Geographic Scope
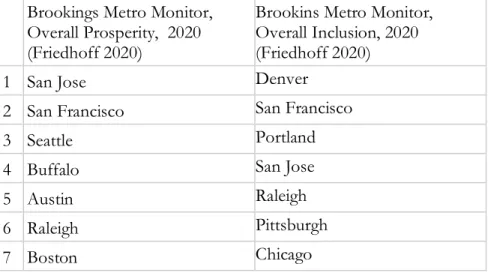
With respect to geographic trends, academic benchmarks tend to measure a broader scope of cities. Unsurprisingly, development institutions like the UN and World Bank demonstrate a commitment to including global southern cities and the domestic institutions, who tend also to focus domestically, do not limit their sample universe to populous cities or those with significant notoriety. Benchmarks produced by smaller labs have sometimes taken a more regional approach to defining their samples, as these purveyors likely have closer relationships with the cities that form their audience (Kirwan Institute 2020). Interviewees that worked for city governments felt the geographic scope of these benchmarks as more thoughtfully conceived—“the comparisons are more meaningful” was a general comment—but were rarely able to expand on this notion when pressed.9
Table 6. Sample of the top-ranking cities in benchmarks by domestic academic or research institutions Brookings Metro Monitor,
Overall Prosperity, 2020 (Friedhoff 2020)
Brookins Metro Monitor, Overall Inclusion, 2020 (Friedhoff 2020)
1 San Jose Denver
2 San Francisco San Francisco
3 Seattle Portland
4 Buffalo San Jose
5 Austin Raleigh
6 Raleigh Pittsburgh
7 Boston Chicago
9 City Actor #3, City A, interview by author, January 17, 2020; City Actor #6, City B, interview by author, January 17,
2020; Benchmark Purveyor #2, interview by author, November 19, 2020; Benchmark Purveyor #11, interview by author, March 3, 2020.
8 Nashville Buffalo
9 Pittsburgh Austin
10 Louisville Milwaukee
Urban Institute, Economic Helath, 2013 (Poethig et al. 2020)
Urban Institute, Overall Inclusion, 2013 (Poethig et al. 2020)
1 McKinney, TX Fremont, CA
2 Elk Grove, IL Daly City, CA
3 Naperville, IL Torance, CA
4 Louisville, KY Santa Clara, CA
5 Roseville, CA Elk Grove, IL
6 Sunnyvale, CA West Covina, CA
7 Fremont, CA Sunnyvale, CA
8 Carlsbad, CA Bellevue, WA
9 Olathe, KS Carlsbad, CA
10 Santa Clara, CA Naperville, IL
Data & Methods
In general, the academic benchmarks were less economistic, measuring concepts like opportunity, prosperity, and inclusion; while they were often measured alongside growth and efficiency indicators, the purely economic measures were subordinated at least in the narrative explanation of the benchmarks, if not in the methods themselves. These rankings were also more transparent about how their indicators correspond to theoretical understandings of ideal urban qualities. For example, the IESE Cities in Motion Index plainly states, “the main goal of any city should be to improve its human capital,” and weighted these indicators (including number of universities, public school expenditures, and educational attainment of the population among other metrics) higher than its social cohesion (crime and mortality rates, share of women in the workforce, Gini index, etc.) and economic indicators (GDP, income, purchasing power, number of
headquarters, etc.) accordingly (Berrone et al. 2019). Similarly, the Urban Institute benchmarked cities based on their residents’ financial health, making the case the city financial health is dependent on family financial security and incorporating family-level economic security metrics like credit scores, amount of delinquent debt, and health insurance coverage, as a proxy for urban economic stability accordingly (Ratcliffe et al. 2017).
Benchmarks in this cohort almost exclusively used publicly available or publicly collected (in the case of person-level IRS records) data and were especially sensitive to geographic specificity— the idea of using national data where city-level metrics were not available was sacrosanct to these interviewees.10 They also were less likely to include other indices as individual indicators in their
composite measures, unless those indices were externally validated measures like the Gini coefficient as a proxy for urban inequality. As part of their stronger theoretical grounding, these benchmarks also tended to be more careful about whether a certain indicator was a positive input that generates the ideal urban outcome (e.g. education spending leading to greater opportunity), or an output measure that would demonstrate the existence of prosperity, opportunity, or the like (e.g. a reduced poverty rate indicating greater inclusion). Finally, benchmarks from research institutions almost always included a longitudinal dimension as opposed to measure phenomena at a single point in time. The use of longitudinal data is another reason for their heightened use by among governments, as they can be used to chart progress over time.
The methodologies employed by academic and research institutions in creating city
benchmarks were the most diverse of any cohort and the most statistically rigorous on the whole. In creating composite indices, these purveyors were unlikely to apply arbitrary weights (though one purveyor weighted indicators based on the data quality); rather, they used methods like principle
10 Benchmark Purveyor #11, interview by author, March 3, 2020; Benchmark Purveyor #14, interview by author, April
component analysis and even simple correlations to determine the extent to which individual indicators were driving composite results and to identify redundancies in indicators that functionally measure the same phenomena. In general, these benchmarks were the most methodologically transparent, especially with respect to data limitations. For example, the UN’s technical
documentation for its City Prosperity Index spans a lengthy 132 pages; in it, mathematical formulas for different normalization strategies were detailed and each indicator received its own discussion of benefits, limitations, and theoretical rationale (UN Habitat 2012). Finally, academic benchmarks most frequently utilized case studies to bolster the narrative and contextual framing of the rankings. Though private sector and media benchmarks also peppered in city-specific qualitative narratives, these features seemed haphazardly designed at best and were rarely given the same footing as the quantitative benchmarks. Instead, the academic rankings often paid equal (or at least, more equal) attention to the qualitative cases to help explicate their quantitative findings and provide more narrative heft to their studies.
Some benchmarks in this cohort also employed methodological strategies outside the realm of rankings and ratings, unlike benchmarks by any other type of creator. The Urban Institute’s benchmark of resident financial health, for example, used a cluster analysis of indicators for 66 cities to create ten peer groups of cities with similar characteristics (Ratcliffe et al. 2017). Clusters were created for “prosperous cities with high housing costs” (Honolulu, San Francisco, San Jose, and Seattle), “rapidly growing cities with threats to economic stability” (Austin, Charlotte, Denver, Durham, Nashville, and Orlando) and “cities in economic recovery” (Detroit and Newark), among other peer groups (Ratcliffe et al. 2017). The Kirwan Institute’s Opportunity Mapping Project is a longstanding alternative model in which neighborhoods within a city are analyzed using city administrative data to provide a spatial understanding of the city’s performance. Here, block-level data from the census were used to determine a neighborhood’s Opportunity Index score; because
Kirwan has now analyzed around fifteen municipalities and regions using the same methods, they can look at thematic trends, such as the geography of opportunity for Africa-American males or disaster-affected regions (Kirwan Institute 2020). These alternative approaches are more analytically intensive and likely harder to produce at scale, but their relative benefits are still interesting to consider.
Typical Uses
Unlike other benchmarks, those created by academics and researchers were most often cited by city governments in policy conversations. Cities use academic benchmarks to “identify realistic competitors,” “network with cities in similar situations,” and “identify policy solutions.”11 These
benchmarks offer benefits that others cannot. They measure political issues, like inequality and opportunity, unlike the overly economistic private-sector benchmarks. They are far more methodologically sound than benchmarks created by media outlets, and are consequently more transparent in documenting their methods. Academic and research institutions also provide an air of credibility and stature that no city consultant can match. As such, these benchmarks are most often used to assess the goodness of governance across various dimensions.12
4. Benchmarks by Cities & Their Consultants
A final player in the city benchmarking space is the cities themselves. Economic development offices, chambers of commerce, and communications officials often undertake bespoke
11 City Actor #2, City A, interview by author, January 17, 2020; City Actor #10, City C, interview by author, March 6,
2020; City Actor #12, City D, interview by author, February 19, 2020.
12 I use the term “governance” here instead of government intentionally. “Governance” is the term commonly used to
benchmarking projects to understand how their city fares by building dashboards through which they can monitor their own progress at quarterly or even more frequent intervals. Interviewees spoke of these dashboards off the record, as these metrics are infrequently publicized “unless there is something good to report.”13 In the absence of many primary resources, a review of city-created
benchmarks is necessarily abbreviated. There is one interesting iteration, however, that is worth elaboration. Cities sometimes enlist consultants in an auditing process that was colloquially described as “benchmarking the benchmarks.”14 These consultants will take stock of every ranking and rating
their city of employment was included in and try to make sense of these measurements. Like the present analysis, these audits often take a critical eye to such benchmarks; unlike this analysis, though, their critiques come from a place of defensiveness in trying to preserve the reputation (and ego) of whatever city is being ranked.
This is not to say that such consultant reports are uninteresting. In fact, they raise many of the same critiques raised here. But the recommendations they make with regards to how cities should interpret and use benchmarks are often as simplistic as the very methods and data they criticize. For example, the City of Toronto enlisted a consultant in constructing a review of Toronto’s
performance across various growth and livability rankings in which the findings primarily criticize global benchmarks for their lack of relevance to Canadian-specific issues (Taylor 2011). In raising concern over the standardization of currencies to the US dollar and how the definition of Canadian metro boundaries differ from that of the US and England, the report effectively suggests that every country should simply take on its own city benchmarking process, instead of problematizing their use in governance more fundamentally. Similarly, the City of Chicago’s assessment of Chicago’s performance across global cities indices recommends that “cities conduct their own analysis of their
13 City Actor #9, City B, interview by author, February 11, 2020. 14 Benchmark #12, interview by author, March 7, 2020.
performance, and identify their strengths and weaknesses compared with their peer group” and calls for government officials to “consult forward-looking indexes to gauge their city’s future prospects” (Leff and Petersen 2015).
In effect, these studies amount to user guides for cities to better understand city benchmarks. Without an attempt at situating the use of benchmarks by governments in a structural context, these arguments fail to engage with what is really at stake when benchmarks are used to make decisions in local government, a subject I will take up in Chapter Four.
5. Conclusion
It is difficult to discern patterns in methodological transparency across the types of benchmarks discussed: examples representative of each set are alternatively legible and opaque, elegant and arbitrary. Some of the most apparently sophisticated benchmarks are essentially compendiums of other rankings upon closer inspection. Others boast of simplicity, but use only one or two metrics to make sweeping statements of quality. Even when a benchmark’s methodology is decipherable, The divergent orientations toward scope, data, methodology, and use generally amount to little by way of rehabilitating city benchmarks. The benefits or innovations of certain benchmarks only vary by degree; none are entirely free of flaws, and thus should raise concerns when used in actual decision-making processes, as discussed in the next chapter.
Chapter Three: Critical Approaches to City Benchmarks as Measurement
Having established various typologies of city benchmarks and commonalities and differences in their scope, data, and methods, it is now possible to understand the general critique of these benchmarks insofar as they are used as measurements. The existing critical analyses wage their disapproval based largely on their flawed measurement aspects alone. The theories discussed here relate as concentric circles, with theories of quantification (drawing mainly on science and
technology studies) situated in the outermost ring, followed by theories of commensurative forms, which are a mode of quantification (these are mostly sociological critiques). The few analyses that focus on practices unique to quantifying cities constitute the center of this circle. Such analyses are not especially theoretical and instead offer largely technical critiques from geographers and urban planners whose subject matter expertise is useful for understanding how quantification and commensuration come to bear on cities, but rarely engage with any political implications of such practices. I begin my review of the literature at the center of this concentric model to demonstrate the limited application of these critiques to city benchmarking as it exists today, before searching for useful insights in the broader quantification and commensuration literature.
At the outset, it is worth acknowledging the most common question that arises in considering quantification: which metrics are preferred to simplify a given concept, and why? Much effort has been spent debating the technical merits of counts versus ratios versus indicators, for example.15 I at
once do not wish to review the vast body of literature pertaining to performance evaluation and think it too individualized an endeavor to yield generalizable lessons. Moreover, answering this question would fall within the “rating the ratings” realm that I desperately wish to avoid. For the
15 In The Seductions of Quantification, an analysis of the quantification of human rights, Sally Merry argues that, in hewing
closer to the actual concept being measured, counts and ratios should be preferred to indicators because they “require less interpretive work than composites and are less vulnerable to the twists produced by long interpretive chains.” (Merry, 127).
purposes of this review of the literature, I assume the fixedness of city benchmarking as a phenomenon and focus instead on gleaning insights regarding the sociological and political behaviors that emerge from this practice.
1. The Urbanist Assessment of City Benchmarks
In many analyses, a robust understanding of the object to be measured—in this case, cities— would precede any discussion of data, methods, uses, expertise, and reactions. I find this approach limiting for its tendency to veer into an overly deterministic characterization of quantification writ large. Put differently, an analysis that begins with the entity to be quantified assumes away the practice of quantification, and instead narrows its focus to the contours of the measurement. With the brief review of urban-specific benchmarking critiques (the canon is exceedingly short) that follows, I wish to highlight what might be gleaned by emphasizing the city in city benchmarks.
The Geographer’s Perspective
As place is central to the geography discipline, it is surprising that few geographers have taken up the issue of city benchmarks. The seminal work dates back to 1985 and comes from Susan Cutter, then a professor of geography at Rutgers University. It was published by the American Society of Geographers, perhaps as the discipline’s collective comment on the rising trend of rating places. At its outset, Cutter claims to “put place ratings in their place,” (emphasis in original) but acknowledges that place ratings are hardly trivial, citing a $26 million suit by the Tulsa Chamber of Commerce against a researcher who admitted errors in a quality of life calculation as proof of the significance of benchmarking (Cutter 1985). Her review focuses exclusively on quality of life ratings, which were of keen interest to the federal government throughout he ‘60s and ‘70s when
policymakers began to invest in the use of social indicators for performance evaluation and crafting new regulations.
Cutter’s “geographic definition of quality of life” is a “measure of the difference between the goal state and the appraisal state, or the distance between the ‘ought’ environment and the ‘is’ environment”(Cutter 1985, Chapter 1). For her, the goal state is based only on the highly subjective collective images of a(n undefined) populace, and is thus largely susceptible to cultural bias, whereas the appraisal state is still culturally defined, but at least incorporates some pseudo-objective
multivariate criteria. She models the concept of quality of life off of three “key geographic” factors including the subjective and objective aspects of both social (crime, housing, income) and
environmental (climate, pollution, recreation) place characteristics as well as the perceptual understanding of a place based on its image and attachments to it.
To Cutter, the geographer’s contribution to analysis of place ratings is the discipline’s “holistic perspective,” which allows the unique capacity to consider “all the attributes of place including objective measures of existing conditions and subjective assessments of those conditions and their importance to individuals” (Ibid). The understanding of these subjective assessments are Cutter’s main contribution: she provides a review of perceptual methods used to rate places including geographic stereotyping, geographic chauvinism, and cognitive maps (Cutter 1985, 18). This focus on the psycho-geographic power of place attachment could carry important insights regarding how to motivate longer-term investments or population growth in cities (Devine-Wright 2013).
Though Cutter’s recommendations acknowledge that civic pride can have important (re: financial) implications for a city’s performance, she limits her suggestions to methodological improvements that can be made. Her most useful concern is avoiding the common “ecological fallacy,” by which place’s average characteristics are ascribed to the entirety of the population, thus
reverting the entirety of the city’s performance to the mean or median (Cutter 1985, 66). Today, gap measures employed by some of the more research-oriented purveyors attempt to capture inequalities in benchmarks so performance is not based on the average, as the “average” likely reflects few actual lived experiences. Her other suggestions (match data used to the intentions of the study, statistical sophistication does not always beget the best ratings, benchmarks can never please every audience) are rather obvious and not specific to the geographer’s approach.
The Planner’s Perspective
Urban planners that have taken up city benchmarks as a subject of analysis are even fewer. As one planning academic explained, “the field’s commitment to place specificity—each city’s indelible character—makes ranking them sacrosanct, and caring about those rankings useless.”16 It
should come as no surprise that I reject this preciousness for the myriad effects of benchmarks I have identified in previous chapters, but also because the incorporation of the planner’s
commitment to place specificity could yield unique insights into city benchmarking practices. Architect and urban designer John de Monchaux attempts to distill these insights in his chapter, “Rating Place-Ratings,” as part of Imaging the City, collection of essays speculating on how creative media shape cities (Vale and Warner 2001). From the outset, de Monchaux’s low opinion of place ratings is obvious; he describes them as “simply reworkings of U.S. Census data and published marketing materials” but acknowledges that ratings are important to planners as a performance evaluation of their own work (Vale and Warner 2001, 397). He characterizes the planner’s disciplinary contribution as its focus on residents as the primary urban clientele. Instead of separating the objective and subjective as Cutter calls for, his ideal approach involves joining the