HAL Id: cea-02489555
https://hal-cea.archives-ouvertes.fr/cea-02489555
Submitted on 24 Feb 2020HAL is a multi-disciplinary open access archive for the deposit and dissemination of sci-entific research documents, whether they are pub-lished or not. The documents may come from teaching and research institutions in France or abroad, or from public or private research centers.
L’archive ouverte pluridisciplinaire HAL, est destinée au dépôt et à la diffusion de documents scientifiques de niveau recherche, publiés ou non, émanant des établissements d’enseignement et de recherche français ou étrangers, des laboratoires publics ou privés.
DARWIN2 low burnup validation for burnup creditusing
SFCOMPO PIE database verification of ICF values
C. Riffard, A. Santamarina, C. Carmouze, L. Sanfelice
To cite this version:
C. Riffard, A. Santamarina, C. Carmouze, L. Sanfelice. DARWIN2 low burnup validation for bur-nup creditusing SFCOMPO PIE database verification of ICF values. ICNC 2015 - 9th International Conference on Nuclear Criticality Safety, Sep 2015, Charlotte, United States. �cea-02489555�
DARWIN2 LOW BURNUP VALIDATION FOR BURNUP CREDIT
USING SFCOMPO PIE DATABASE – VERIFICATION OF ICF VALUES
Riffard C., Santamarina A., Carmouze C., San-Felice L.
CEA, DEN, DER, SPRC, Cadarache Center, F-13108 Saint Paul lez Durance, France. [email protected]; [email protected]
ABSTRACT
The DARWIN package, developed by the CEA and its French partners (AREVA and EDF), provides the parameters required for fuel cycle applications, especially fuel inventory. It is widely used in the French Burnup Credit (BUC) calculation route, based on the connection of the depletion code DARWIN and the Criticality-Safety Package CRISTAL.
The experimental validation process of BUC nuclides provided by DARWIN2.3 package consists in the comparison between JEFF-3.1.1-based calculated values of isotopic concentrations and experimental values obtained from the chemical analysis of PWR fuel rod cuts. As a complement to the extensive validation using the French PIE database, specific PIE data chosen for their quality were selected and analyzed in the SFCOMPO database of NEA. A set of 56 samples chosen in PWR-UO2 experiments was
selected, with initial 235U enrichment between 2.7% and 4.1% and local burnup estimated from 148Nd
measurement varying between 7 and 35 GWd/tHM.
This paper provides an overview of calculation – experiment comparison obtained in Takahama-3 17x17, Trino-Vercellese 15x15 and Obrigheim 14x1 for uranium, plutonium isotopes, as well as available fission products contributing to the assembly reactivity. Consistent biases compared to SCALE5 results were obtained.
From these results, an analysis is driven using 15 selected samples with low burnup, selected among asymptotic rods of irradiated fuels at 1 or 2 cycles. This paper shows the consistency of the calculation - experiment biases obtained with DARWIN2.3 towards previously defined penalized biases used for the Isotopic Correction Factors (ICF) in BUC applications.
KEYWORDS BUC, DARWIN, PWR UOx, ICF, low BU
1. INTRODUCTION
The DARWIN package, developed by the CEA and its French partners (AREVA and EDF), provides the parameters required for fuel cycle applications, especially fuel inventory. It is widely used in the French Burnup Credit (BUC) calculation route [1] (Fig.1), based on the connection of the depletion code DARWIN [2] and the Criticality-Safety Package CRISTAL [3]. DARWIN Package calculates the concentrations of isotopes at the end of irradiation or after cooling times. Then, these concentrations, to which a correction factor can be applied [4,5], are used as input data in the Criticality- Safety Package CRISTAL, which provides the effective multiplication factor associated to the calculated situation. Part of this work was discussed within the French BUC Working Group, involving experts from IRSN, AREVA, EDF, ANDRA and CEA [6].
b
(1)Δkeff(PFi)= Δkeff[Actinides+PFs]-Δkeff [(Actinides+PFs-PFi]
description
Criticality calculation with CRISTAL Depletion calculations with CESAR or DARWIN
CESARor DARWIN
.
.
.
.
.
.
.
.
.
.
.
.
.
BU1 BU3 . . . BUy BU2.
.
.
.
.
.
.
.
.
.
.
.
.
C1(X) C3(X) . . . Cy(X) C2(X) A P O L L O 2 (CEA 93) MORET 4 of the criticality calculation Σ1 Σ3 Σy Σ2.
.
.
.
.
.
.
.
. . .k
effCriticality calculation with CRISTAL Depletion calculation with DARWIN or CESAR
DARWIN2.3 or CESAR5
.
.
.
.
.
.
.
.
.
.
.
.
.
BU1 BU3 . . . BUy BU2.
.
.
.
.
.
.
.
.
.
.
.
.
BU1 BU3 . . . BU11 BU2.
.
.
.
.
.
.
.
.
.
.
.
.
C1(X) C3(X) . . . Cy(X) C2(X).
.
.
.
.
.
.
.
.
.
.
.
.
C1(X) C3(X) . . . Cy(X) C2(X) Spent fuel inventoryk
eff F(X) . . . F(X) F(X) F(X) X X X X X CRISTALV2.0 CorrectionFactors Penalty Factors Reactivity worth of BUC FPs Axial profile of burnup ∆keff (PF1)(1) ∆keff(PF2) . . . ∆keff (PF15) X X X X F(PF1) F(PF2) F(PF15) . . . Conservative irradiation
JEFF-3.1.1 / SHEM Library
Figure 1 The French BUC calculation route The CEA – AREVA BUC methodology, accounts for:
• 15 poisoning Fission Products (FPs), stable and non-gazeous, in addition to the actinides [7], following the recommendations of the benchmark Phase-I of the OECD BUC Expert Group [8], • conservative hypotheses for the depletion calculations,
• experimental validation of the spent fuel inventory obtained with DARWIN and of the reactivity worth of BUC nuclides calculated with CRISTAL,
• a bounding axial burnup profile of spent fuel assemblies. A recommended bounding profile for PWR LEU spent fuel assemblies (SFA) applications has been previously described.
A specific BUC program [9] has been developed at Cadarache Centre in the framework of the CEA-AREVA collaboration in support of this methodology. This program involves two kinds of experiments:
• Chemical analyses and microprobe measurements of PWR spent fuel rods to obtain the fuel inventory (Actinides and FPs);
• Reactivity worth measurements of each BUC nuclide by oscillation in the MINERVE reactor of UO2 samples involving the separated-FP.
The experimental validation process of BUC nuclides provided by DARWIN2.3 Package consists in the comparison between calculated values of isotopic concentrations using the industrial scheme ‘CYCLE 2008’ [10] with the European evaluation JEFF-3.1.1 [11] and experimental values obtained from the chemical analysis of fuel rod cuts. As a complement to the extensive validation using the French PIE database [12], specific P.I.E. (Post Irradiated Examination) data chosen for their quality were selected in the SFCOMPO NEA database and analyzed. This paper provides an overview of calculation – experiment comparison obtained in Takahama-3 17x17, Trino-Vercellese 15x15 and Obrigheim 14x14 for BUC nuclides. From these results, an analysis is driven using 15 selected samples with low burnup, selected among asymptotic rods of irradiated fuels at 1 or 2 cycles. The consistency of the C/E biases, towards previously defined penalized biases used for the Isotopic Correction Factors (ICF) in BUC applications [13], is analyzed in the third section.
2. DARWIN VALIDATION FOR BUC NUCLIDES USING SFCOMPO P.I.E. DATA
2.1. Industrial Scheme ‘CYCLE 2008’ (calculation model of the depleted fuel)
The new ‘REL2005’ optimized and validated scheme for PWR UOx calculation is based on the recent package APOLLO2.8 [14] developed by CEA. In the specific case of fuel cycle studies, a consistent scheme ‘CYCLE2008’ has been developed and validated using the benefit of the validation program of the ‘REL2005’ APOLLO2.8 scheme [15]. It provides self-shielded cross sections used by PEPIN2 in order to give BUC isotopes concentrations of the depleted fuel. The neutron energy spectrum is calculated in the 2D assembly geometry, using a Pij multicell model: the UP1 Interface Current method based on linearly anisotropic interface fluxes. The fuel pellets are split into 4 rings (UOX) in order to give an accurate representation of absorption of 238U as well as FPs concentration profile. Local spectrum
calculation is performed in the SHEM 281 energy group structure [16]. Space-dependent self-shielding (used only above 23 eV that is the upper limit of the fine mesh in SHEM) is repeated at recommended burnup steps, optimized consistently with the ‘REL2005’ recommendations. Refined burnup steps are used for the depletion calculation.
This scheme is also used in calculation of BUC nuclides concentrations using DARWIN2 package for BUC applications (Fig.2). The PEPIN2 evolution module uses the results provided by APOLLO2, self-shielded cross-sections and multigroup spectra, to make up the collapsed library with burnup dependent cross-sections required in the depletion chains.
Figure 2 Sequence including the DARWIN2 ‘CYCLE 2008’ Scheme in BUC calculations
2.2. PIE data selection in SFCOMPO database
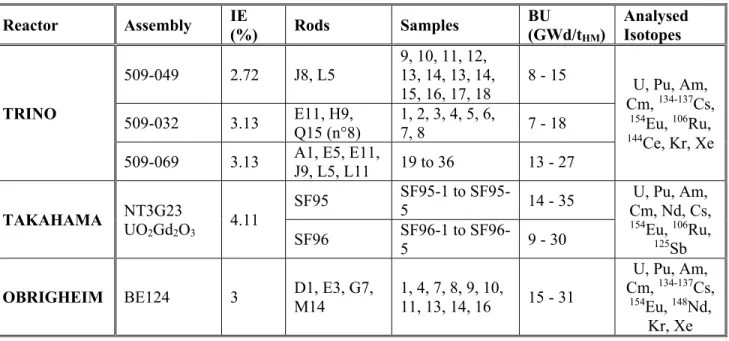
A set of 56 samples chosen in PWR-UO2 experiments was selected in the SFCOMPO database of the
NEA [17], with initial 235U enrichment between 2.72% and 4.11% and local burnup estimated from 148Nd
measurement varying between 7 and 35 GWd/tHM, detailed in Table I. This database allows the
calculation of a wide range of PWR assemblies, as a complement to the extensive validation using the French P.I.E. database, especially with samples irradiated at low burnup (1 or 2 cycles). Moreover, calculated biases can be compared with published results of other laboratories involved in depletion calculation of BUC nuclides [18].
Table I. PWR UO2 selected samples in SFCOMPO P.I.E. database Reactor Assembly IE (%) Rods Samples BU (GWd/tHM) Analysed Isotopes TRINO 509-049 2.72 J8, L5 9, 10, 11, 12, 13, 14, 13, 14, 15, 16, 17, 18 8 - 15 U, Pu, Am, Cm, 134-137Cs, 154Eu, 106Ru, 144Ce, Kr, Xe 509-032 3.13 E11, H9, Q15 (n°8) 1, 2, 3, 4, 5, 6, 7, 8 7 - 18 509-069 3.13 A1, E5, E11, J9, L5, L11 19 to 36 13 - 27
TAKAHAMA NT3G23 UO 2Gd2O3 4.11 SF95 1 to SF95-5 14 - 35 U, Pu, Am, Cm, Nd, Cs, 154Eu, 106Ru, 125Sb SF96 1 to SF96-5 9 - 30
OBRIGHEIM BE124 3 D1, E3, G7, M14 1, 4, 7, 8, 9, 10, 11, 13, 14, 16 15 - 31
U, Pu, Am, Cm, 134-137Cs,
154Eu, 148Nd,
Kr, Xe
2.3. General trends obtained with DARWIN 2.3
The trends on the (C-E)/E biases are summarized in Table II for main actinides involved in BUC studies. The calculation burnup is adjusted using the experimental indicator, namely the 148Nd. 235U seems slightly
overestimated at low burnup (mean +3%) as shown in Fig.3, although it is well calculated using French experiments. The slight overestimation of 239Pu (mean +3%) shown in Fig.3, is less than the result
obtained using SCALE5 [19] (mean +5%). Both DARWIN2 and SCALE5 240Pu C/E sample results are
varying between -8% / +8%, depending on the type of assembly, although it is calculated within 2% accuracy from French experiment.
The total uncertainties (1σ) correspond to the combination of uncertainties on chemical assays (from SFCOMPO when available or deduced from published analysis of the selected experiments [19]) and of the determination of the rod-cut burnup derived from 148Nd content. Technological uncertainties (fuel and
moderator temperature) are also included.
Consistent biases, towards foreigner laboratories using SCALE5, were then obtained from these samples, although inconsistent results can be highlighted for some samples providing high technological
uncertainties. The comparison of total uncertainties associated to each sample with those of the French P.I.E. database in Table III enhances the quality of the later one. Therefore, a careful choice of accurately characterized samples should be done among this selected sample set to derive the BUC ICFs.
Table II. Trends of the DARWIN2.3 experimental validation using SFCOMPO PWR experiments Isotope SFCOMPO 7 – 40 GWd/t
DARWIN2.3 / SCALE5.1
Previous work [12] French PWR C-E ± 1σ (%) 235U +3% / +2% 0 ± 2% 236U -7% / -4.5% -1% ± 1% 239Pu +3% / [0 - +10]% -2% ± 1% 240Pu [+3 - +8]% / [+4 - +13]% Takahama 0% ± 2% 241Pu [-9 - +9]% / idem -1% ± 3%
Table III. Uncertainty ranges (%) obtained for actinides, comparison with French P.I.E. data
Reactor TRINO TAKAHAMA OBRIGHEIM DARWIN French PIE
(20 GWd/t) Isotope σ min / σ max σ min / σ max σ min / σ max mean (%)
235U 2.6 / 2.8 0.6 / 2.6 4 / 5.3 2
239Pu 2.3 / 2.5 1.1 / 3.6 0.7 / 0.8 0.6
240Pu 3.2 / 3.6 1.7 / 3.8 0.6 / 2.6 2
241Pu 3.3 / 4.7 2.1 / 5.2 1.7 / 5.1 2.5
242Pu 5.8 / 7.1 4.2 / 8.3 6.9 / 7.7 4
Figure 3 C/E bias (in%) obtained for 235U and 239Pu in SFCOMPO P.I.Es
3. COMPARISON WITH PENALIZED BIAS USED FOR ICF IN BUC APPLICATIONS
3.1. Selected samples for BUC application
From these results, an analysis is made using 15 selected samples at low burnup, selected among asymptotic rods of irradiated fuels at 1 or 2 cycles (Table IV). They are chosen for the quality of the measurement data, the availability of BUC isotopes among the chemical analysis, the number of irradiation cycles and the location of the rod / sample (flat BU zone of the fissile column, middle of the assembly to avoid environment perturbations).
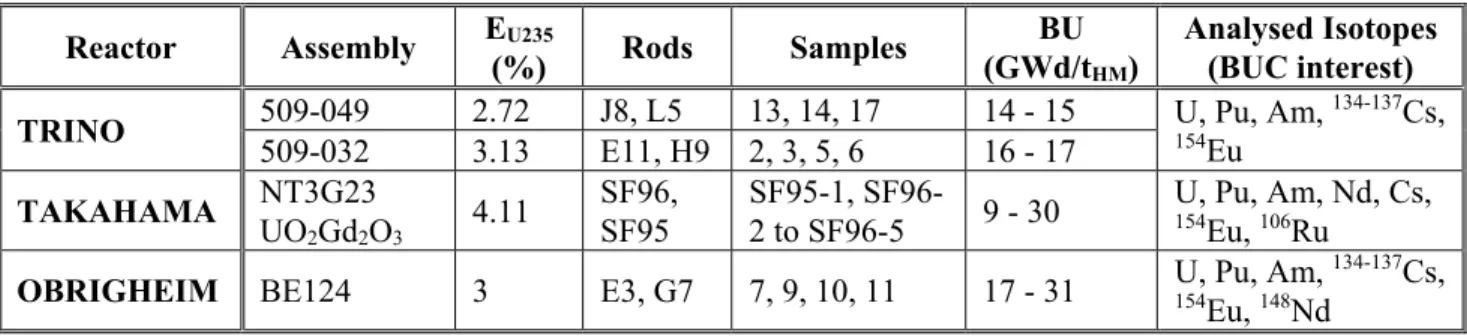
Table IV. Selected rod cuts for BUC application Reactor Assembly EU235
(%) Rods Samples
BU (GWd/tHM)
Analysed Isotopes (BUC interest) TRINO 509-049 509-032 2.72 3.13 J8, L5 E11, H9 2, 3, 5, 6 13, 14, 17 14 - 15 16 - 17 U, Pu, Am, 154Eu 134-137Cs,
TAKAHAMA NT3G23 UO2Gd2O3 4.11 SF96, SF95 SF95-1, SF96-2 to SF96-5 9 - 30 U, Pu, Am, Nd, Cs, 154Eu, 106Ru
OBRIGHEIM BE124 3 E3, G7 7, 9, 10, 11 17 - 31 U, Pu, Am, 154Eu, 148Nd 134-137Cs,
3.2. ICF derivation methodology
Isotopic Correction Factors (IFCs) are applied to the BUC nuclide densities to ensure the conservatism of the irradiated fuel inventory in criticality studies. They take into account two sources of errors :
1- The bias between calculated values of isotopic concentration (using the industrial scheme 'CYCLE 2008' ) and experimental values obtained from accurate chemical analyses of well characterized fuel rod cuts, selected in the French P.I.E (Post Irradiated Examination) database ;
2- The total uncertainty obtained by combining the various uncertainty components : measurement uncertainty associated with the chemical assays; fuel coolant/moderator temperatures during irradiation; local Burnup estimation; initial content in 235U; reactor cycle follow-up.
The JEFF3.1.1 ICFs values, to be implemented in PWR UO2 applications to guarantee the conservatism
of the SFA inventory, were already derived from the experimental validation of DARWIN2.3 [13] [1]. The purpose of this work is to check the consistency of these Penalized (C-E)/E values towards recent results obtained from experimental values of the SFCOMPO database at low burnup.
In order to obtain the Penalized (C-E)/E values, the C/E biases obtained from SFCOMPO rod cut measurements are increased by the 95% one-sided confidence interval of the total experimental uncertainty (Tab. III) :
- burnup determination (±2% at 1σ) from 148Nd adjustment;
- moderator temperature (±2°C), at 1σ; - fuel temperature (±50°C),
- reactor cycle follow-up
- chemical analysis uncertainties.
These independent uncertainties are then combined.
3.3. BUC actinides and FP results
In this work C/E results are compared with the penalized bias associated to each BUC nuclide, in order to verify the consistency of the linear trend at low burnup (< 30 GWd/tHM) derived from DARWIN2
experimental validation [13].
3.3.1. 235U penalized bias and C/E results
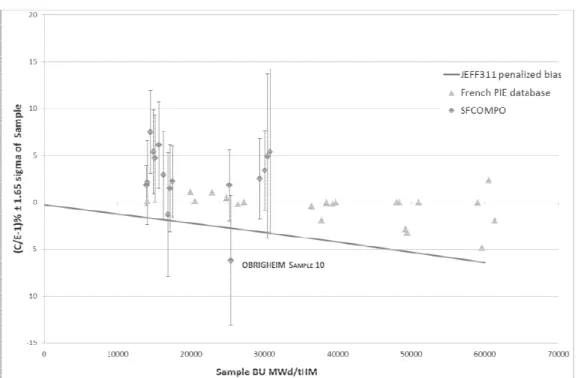
The recent ICF value versus burnup of 235U was derived from the DARWIN2.3/JEFF-3.1.1 experimental
validation, giving a penalized bias Δ = (C-E)/E – 1.65σ shown in Fig.4. At high burnup it is mainly driven by a strong uncertainty component due to burnup determination, the depletion of 235U being accurately
predicted by DARWIN2.3 package within 1% accuracy for low burnup ranges (< 30 GWd/t). For
criticality studies, the penalized bias equals to -3.2% at 30 GWd/tHM. An ICF value of 1.033 applied to the 235U JEFF3.1.1-based concentration can be therefore recommended at 30 GWd/t
HM, in order to guarantee
its conservativeness in criticality calculations.
The results obtained from SFCOMPO rod cuts measurements at low burnup confirm the relevancy of the retained penalized bias using JEFF-3.1.1, as shown in Fig.4. The C/E result obtained from Sample n°10 of Obrigheim experiment is covered by the large experimental uncertainty; the 137Cs result shows an
overestimation by +3%, to be compared with the -3.5% general tendency obtained in previous work [12], which explains the under estimation of 235U.
Figure 4 Confirmation of penalized bias of 235U using SFCOMPO P.I.E. data at low Burnup
3.3.2. 241Pu penalized bias and C/E results
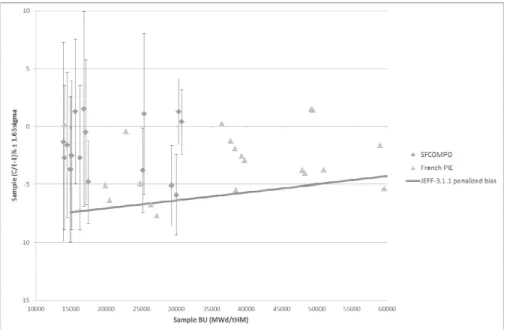
The recent ICF value of 241Pu is derived from the DARWIN2.3/JEFF-3.1.1 experimental validation,
giving a penalized bias Δ = (C-E/E) – 1.65σ shown in Fig.5. It is partly driven by experimental uncertainties around 3% and the slight underestimation of the 241Pu building. The penalized bias
associated to the 241Pu concentration amounts to -6.4% at 30 GWd/t HM.
The C/E results obtained from SFCOMPO P.I.E. data at low burnup using 1.65σ uncertainty confirm the relevancy of the retained bias using JEFF-3.1.1: every C/E value is less penalizing than the retained bias for criticality studies as shown in Fig.5.
Figure 5 Confirmation of penalized bias of 241Pu using SFCOMPO P.I.E. data at low Burnup
3.3.3. Absorber actinides 240Pu and 242Pu
The penalized bias derived from DARWIN2.3/ JEFF-3.1.1 C/E results for absorber isotopes is +1.8% for
240Pu, which is accurately predicted with DARWIN2.3, and +1.6% for 242Pu which is slightly
underestimated [12, 13].
The underestimated 240Pu C/E obtained for most samples clearly confirm the JEFF-3.1.1 retained bias, as
shown in Fig.6. The Takahama-3 experiment shows quite inconsistent result, with a slight C/E overestimation, however covered by the large experiment uncertainty.
The underestimated 242Pu C/E obtained for most samples confirm the JEFF-3.1.1 retained bias (Fig.7).
One sample from Obrigheim seems not consistent at 26 GWd/tHM, however covered by 1.65σ uncertainty.
Figure 7 Confirmation of penalized bias of 242Pu using SFCOMPO P.I.E. data at low Burnup
4. CONCLUSION
The SFCOMPO PIE database is of high interest for depletion calculation benchmarking. A large range of fuel design, enrichment, burnup, are available with a good associated statistic. However, uncertainties in chemical analysis and reactor data have to be carefully evaluated, which is the purpose of WPNCS Expert Group. In criticality applications, most actinides and burnup indicator are available.
This work has validated the extension of the DARWIN2 experimental validation to low burnup. The comparison with SCALE5 analysis results of the selected experiments has shown consistent results. From this work, a key result can be derived for BUC application in PWR UO2:
- The Consistency of the calculation - experiment biases obtained with DARWIN2.3 towards previously defined penalized biases is demonstrated in this paper.
- Results obtained from15 representative samples (asymptotic rods) for 235U, 240Pu, 241Pu, 242Pu
confirm the relevancy of penalized biases derived from the French P.I.E. data.
- This study confirms the validity of JEFF-3.1.1 Isotopic Correction Factor at low burnup [10 – 30 GWd/tHM].
These ICFs were applied in recent criticality calculation for BUC PWR applications, carried out using the French BUC calculation Route based on DARWIN2.3 and CRISTAL V2.0.
ACKNOWLEDGMENTS
The authors acknowledge the French BUC Working Group participants, and CEA experts for their helpful discussions in BUC methodology: C. Vaglio, B. Roque, A. Chambon, D. Bernard, P. Leconte.
REFERENCES
1. C. Carmouze, C. Riffard, A. Santamarina, G. Grassi, “Full Burnup Credit conservatisms in PWR-UOx
industrial applications, due to the correction and penalty factors derived from the French experiments using JEFF3.1.1 library,” Proceeding of ANS NCSD 2013, Criticality Safety in the Modern Era:
Raising the Bar, Wilmington, NC, Sept 29 –Oct 3, 2013, on CD-ROM, ANS, LaGrange Park, IL.
2. A. Tsilanzara et al. “DARWIN: an evolution code system for a large range of applications”, ICRS-9, Tsukuba, Japan, October 2009.
3. J.M. Gomit et al., “CRISTAL V2.0: a new-generation criticality package”, submitted ICNC 2015. 4. L. San Felice, et al, “BUC implementation for a transport cask application using penalty terms from
French experiments”, Proc. of GLOBAL 2009, Sept 6-11 2009, Paris, France, pp.656-665 (2009). 5. M. Tardy et al.,”First Burnup Credit application for transport and storage cask using French
experiments”, PHYSOR 2014, Kyoto, Japan, Sept. 28-Oct. 3.
6. L. Jutier et al., “Burnup credit implementation for PWR UOX used fuel assemblies in France: From Study to Practical Experience”, submitted to Nuclear Science and Technology.
7. A. Santamarina, “Burnup Credit implementation in spent fuel management”, FISS’98, Cadarache, France, 1998.
8. M. Takano, “OECD/NEA Burnup Credit criticality benchmark: Results of Phase I-A”, Report JEARIM94-003, January 5th, 1994.
9. A. Santamarina et al., “Experimental validation of Burnup Credit calculations by reactivity worth measurements in the MINERVE reactor”, Proc. of Int. Conf. on Nuclear Criticality Safety ICNC’95, Albuquerque, USA, Sept.17-21 (1995).
10. L. San Felice et al., “Experimental validation of the DARWIN2.3 package for fuel cycle
applications”, Proceeding of the Int. Conf. on Reactor Physics PHYSOR’12, Knoxville USA, 2012. 11. A. Santamarina et al., “The JEFF-3.1.1 Nuclear Data Library; validation results from JEF-2.2 to
JEFF-3.1.1”, JEFF Report 22, NEA n° 6807, OECD, 2009.
12. L. San-Felice et al., “Experimental validation of the DARWIN2.3 Package for fuel cycle applications”, Nuclear Technology, Vol. 184, (2013).
13. C. Riffard, A. Santamarina, "Corrections factors applied to isotopic concentrations in burnup credit implementation of PWR LEU applications with the recent JEFF3.1.1 / SHEM library", Proceeding of
the Int. Conf. of Nuclear Criticality Safety ICNC2011, Edinburgh (UK), 2011.
14. R. Sanchez et al., “APOLLO2 Year 2010”, Nuclear Eng. and Technology, 42, pp. 474-499 (2010). 15. J.F. Vidal, et al.,, “New modelling of LWR assemblies using the APOLLO2 code package”, Proc.
International Topical Meeting M&C + SNA 2007, Monterey (USA),(2007).
16. A. Santamarina, N. Hfaiedh, “The SHEM energy mesh for accurate fuel depletion and BUC calculations”, Proc. Int. Conf on Criticality ICNC2007, Saint Petersburg, May 28 – June 1, 2007. 17. “Spent Nuclear Fuel Assay Data for Isotopic Validation, state of the art report”,
NEA/NSC/WPNCS/DOC(2011)5.
18. B. Roque, M. Erlund, “International Comparison of a Depletion Calculation Benchmark on Fuel Cycle Issues, Results from Phase 1 on UOx Fuels”, NEA/NSC/DOC(2013)1.
19. G. Radulescu, I.C. Gauld, G. IIas, “SCALE 5.1 Predictions of PWR spent nuclear fuel isotopic compositions”, ORNL/TM-2010/44.