HAL Id: in2p3-00282141
http://hal.in2p3.fr/in2p3-00282141
Preprint submitted on 26 May 2008
HAL is a multi-disciplinary open access
archive for the deposit and dissemination of
sci-entific research documents, whether they are
pub-lished or not. The documents may come from
teaching and research institutions in France or
abroad, or from public or private research centers.
L’archive ouverte pluridisciplinaire HAL, est
destinée au dépôt et à la diffusion de documents
scientifiques de niveau recherche, publiés ou non,
émanant des établissements d’enseignement et de
recherche français ou étrangers, des laboratoires
publics ou privés.
Data Filtering in the readout of the CMS
Electromagnetic Calorimeter
N. Almeida, P. Silva, J.C. da Silva, M. Husejko, A. Jain, P. Musella, A.
Mendes, M. Gallinaro, J. Varela, J. L. Faure, et al.
To cite this version:
N. Almeida, P. Silva, J.C. da Silva, M. Husejko, A. Jain, et al.. Data Filtering in the readout of the
CMS Electromagnetic Calorimeter. 2008. �in2p3-00282141�
Available on CMS information server
CMS NOTE-2008/002
The Compact Muon Solenoid Experiment
Mailing address: CMS CERN, CH-1211 GENEVA 23, Switzerland
CMS Note
21 May 2007
Data Filtering in the readout of the CMS
Electromagnetic Calorimeter
N. Almeida, P. Silva, J.C. Da Silva, M. Husejko, A. Jain, P. Musella, A. Mendes, M. Gallinaro, J.Varelaa) LIP, Lisbon, Portugal
J.L. Faure, P. Gras, I. Mandjavidze DAPNIA, CEA Saclay, France
P. Busson, P. Paganini
LLR, CNRS-IN2P3, Ecole Polytechnique, France
Abstract
For an efficient data taking, the Electromagnetic Calorimeter (ECAL) data of the CMS experiment must be limited to 10% of the full event size (1MB). Other requirements limit the average data size to 2kB per data acquisition link. These conditions imply a reduction factor of close to twenty on the data collected. The data filtering in the readout of the ECAL detector is discussed. Test beam data are used to study the digital filtering applied in the readout channels and a full detector simulation allows to estimate the energy thresholds to achieve the desired data suppression factor.
a)
2
1 Introduction
The Compact Muon Solenoid (CMS) [1] is one of the two general-purpose detectors that will operate at the Large Hadron Collider (LHC) at the European Organization for Particle Physics (CERN), Geneva, Switzerland. Protons or lead nuclei beams at 14 TeV and 1150 TeV center of mass energies, respectively, are expected to collide by the end of 2008. Finding the Higgs boson, evidence for supersymmetry and possibly new fundamental particles are some of the main goals of the research program. CMS events will be collected in the central storage system at a rate of 150 Hz, the high level trigger rate. The average event size including data from all detectors is estimated at 1MB. The Electromagnetic Calorimeter (ECAL) [2] of the CMS detector is divided in the barrel (EB) covering the central region
|η|≤1.5, and two endcaps (EE) which extend the coverage up to |η|=3. Made of approximately 76000 high purity PbWO4
crystals, the ECAL is characterized by its fine granularity and excellent energy resolution for measuring electrons and photons. For an efficient CMS data-taking the ECAL data must be limited to 10% of the entire event size. Other Data Acquisition (DAQ) requirements limit the average data per DAQ link to 2 kB for each Level-1 Accept (L1A) trigger [3]. In Section 2 the readout of the ECAL detector is presented. The high segmentation of the detector and the ten digitized time samples collected for each crystal imply that a reduction factor of close to twenty is needed to attain these requirements. The online data filtering scheme is implemented in the off-detector electronics [4] housed in the underground counting room near the experimental area where collisions occur. The data filtering is based on a Selective Readout (SR) algorithm which uses regions of the detector where energy has been deposited to decide the digital
filtering actions to be applied to each front-end readout channel2. Data acquired in the H4 electron test beam at CERN
allowed to study the digital filtering technique presented in Section 3. Based on the full detector simulation, including the emulation of the SR algorithm, the energy thresholds to achieve the desirable data filtering are estimated in Section 4.
2 Electromagnetic Calorimeter Readout
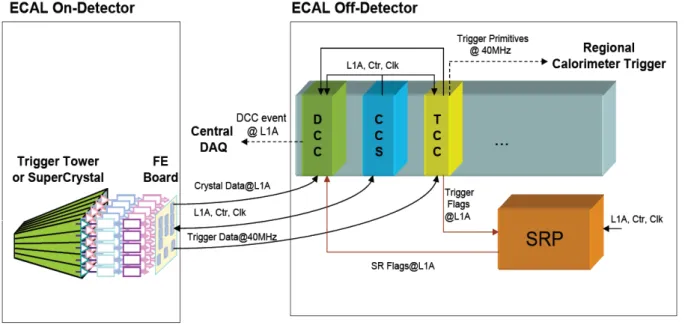
The architecture of the ECAL data acquisition flow is schematically shown in Figure 1, and can be divided in two sections: on-detector and off-detector electronics.
Figure 1. The ECAL readout architecture.
2.1
On Detector Electronics
The on-detector readout electronics is located just behind the crystals and is composed of radiation-resistant circuits. Each Front-End (FE) board is responsible for the readout of a 5×5 crystal matrix, which defines a trigger tower (∆η×∆φ=0.087×0.087) in the barrel and a supercrystal in the endcaps. The crystal light is collected by avalanche
2 In this paper the term “channel” refers to a front-end readout channel into the off-detector electronics. Each readout channel corresponds to a region of 5x5 crystals.
photodiodes in the barrel or vacuum photo-triodes in the high radiation regions of the endcaps. The crystal readout proceeds via a Multi-Gain Pre-Amplifier (MGPA) with three parallel gain stages (relative gains 1, 6, and 12) followed by three integrated sampling Analog to Digital Converters (ADC) working at the LHC frequency (40MHz). The non-saturated ADC output with the highest gain is read out and stored in the FE pipeline FIFOs waiting for the L1A trigger decision with a latency of 3.2 µs [5]. Each data sample comprises a 12-bit ADC value and a 2-bit code of the selected gain. When the L1A signal is received, ten data samples per crystal are moved to the de-randomizer buffers. Data from 25 crystals are assembled, packed and sent by an optical link to the off-detector. Besides storing crystal data, the FE modules also compute the trigger primitives, which codify the transversal trigger tower energy and are later used by the Level-1(L1) trigger system [5].
In the endcaps the trigger tower definition follows the η-φ geometry, and is composed of pseudo-strips (groups of up to 5 crystals) of different supercrystals. On the other hand, the supercrystals are organized as x-y crystal matrices. Therefore, in the endcaps the FE modules only compute the pseudo-strip transversal energy delegating to the off-detector system the final trigger tower sum [2].
2.2
Off Detector Electronics
Each off-detector crate communicates with the on-detector electronics through 90-m long high-speed optical links, operating at 800 Mb/s, for a total of approximately 9000 links. The off-detector electronics serves both the trigger and the data acquisition systems.
In the trigger path, the generation of trigger primitives started in the FE boards is finalized and synchronized [6] in the Trigger Concentrator Card (TCC) [7] before transmission, at each bunch crossing, to the Regional Calorimeter Trigger, a subsystem of the L1 trigger. After a L1A signal, the classification of the trigger towers based on their energies is made by the TCC. High and low energy thresholds identify low, intermediate and high interest towers. This classification is sent to the Selective Readout Processor (SRP) crate [8], which computes the filtering conditions to be applied in each readout channel.
In the data acquisition path, the crystal data are readout by the on-detector FE boards and are sent to the Data Concentrator Card (DCC) [9]. The DCC is also responsible for collecting the trigger data from the TCC and the SR flags from the SRP crate, and performs the filtering of the crystal data based on these flags. The Clock and Control System (CCS) distributes the clock and control signals in the system.
After filtering and formatting [10], the event information is forwarded to the CMS central acquisition system. The crystal data are used for cluster reconstruction and energy measurement, while the trigger data are used along with crystal data to establish the complete energy flow in the calorimeter. The SR flags track the filtering conditions applied to each readout channel.
A total of 54 DCC modules are needed to readout the entire ECAL detector. In the barrel each DCC is responsible for
collecting data through 68 FE links from one supermodule (1700 crystals) which covers a 200 half barrel section. In the
endcaps a coarser readout segmentation of 400 is used. The total data volume depends on the number of channels and
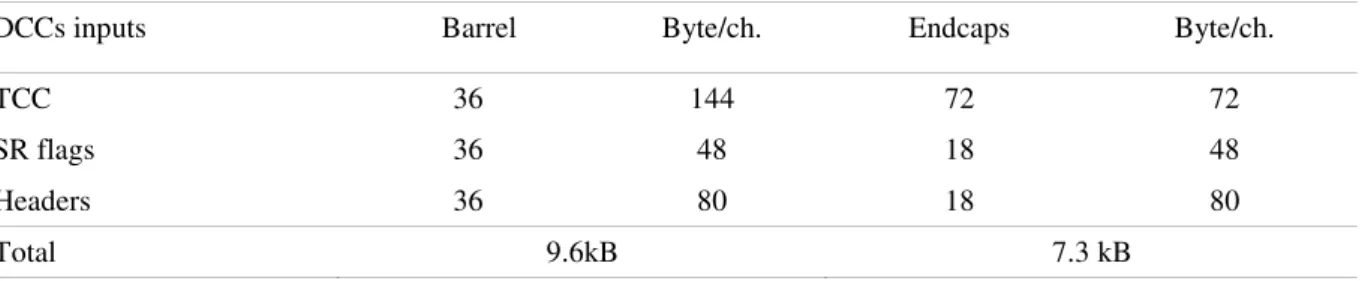
crystals that are readout in addition to the fixed-size data contributions (TCC trigger data, SR flags and event header and trailer), summarized in Table 1. This contribution represents a total of 16.9 kB.
Table 1: Fixed sized data volume contributions from the detector barrel and endcaps.
DCCs inputs Barrel Byte/ch. Endcaps Byte/ch.
TCC 36 144 72 72
SR flags 36 48 18 48
Headers 36 80 18 80
Total 9.6kB 7.3 kB
During normal data taking operation, the ECAL readout will collect ten time slices coded in 24 bytes with an 8 byte header word for each readout channel. In this case the ECAL data volume can be parameterized using the following formula:
event size = 16 .9 + 8 nch + 24 nxtal 1024 kB
[
]
(1)4
3 Electromagnetic Calorimeter Data Filtering
3.1
Digital Filtering
The amplitude of the signal pulse collected from the sampling ADC is a measure of the energy deposited in the crystal. In order to reduce the size of the data volume, a filtering algorithm which suppresses the read out of the crystal data below a certain energy threshold is used. The zero-suppression filtering is based on a digital estimate of this energy, which must be compared with a suppression threshold. The crystal data filtering is implemented in the DCC FPGA firmware, where the decision to apply the filter is made according to the associated SR flag (full readout, level 1 suppression, level 2 suppression and full suppression). DCC FE input buffers store the data for the time (3µs) needed by the SRP system to compute and transfer the SR flags to the DCC.
The zero-suppression filter uses a simplified version of the off-line amplitude estimation algorithm [11] suitable for
hardware implementation. The signal amplitude is given by a Finite Impulse Response (FIR) filter using six out of the
ten time slices. The filter is applied on the time samples (fi) using 12-bit filter coefficients (wi) which are configurable
for each crystal. The amplitude is computed using:
(2) 0
∑
= = n i i if w Aand the result is coded as a 16-bit integer.
An optimization of the filter weights can be obtained by minimizing the variance of A with respect to the true pulse amplitude. Using a Lagrangian multiplier technique applied to the signal pulse shape it can be shown that the best set of weights taking the covariance matrix as diagonal, are obtained with[11] :
∑
∑
= = − = = n i i i i n i i i i n f f g g g w 0 0 2 (3) where ,These values are multiplied by the crystal calibration coefficients to obtain the final weights wi.
FE data are readout if: 1) the energy measured is above the zero-suppression threshold, 2) the filter is overflowed or 3) a time sample with gain different from maximum is identified.
3.2
Digital Filtering Evaluation
Test beam data have been used to evaluate the performance of the ECAL detector [12] and are used here to evaluate the digital filter technique described in the previous section. In the test setup a supermodule was mounted on a scanning table and data were read out using a DCC prototype. The scanning table allows accurate crystal positioning in the electron beam line, which has a low momentum spread, suitable for precise energy resolution measurements. In front of the beam line, two orthogonal planes of scintillator fingers are used for beam position adjustment, while two scintillating fiber hodoscopes are able to find the impact position of beam particles with a resolution better than 150µm. The time difference between the trigger and the reference acquisition clock is measured using a Time to Digital Converter (TDC). Optimal weight computation depends on the correct description of the expected pulse and in particular on the time precision at which samples are acquired. At the LHC, an accuracy of 1ns (or better) can be achieved therefore the analysis was restricted to events within a 1 ns TDC window frame.
In the test beam, our studies were focused on a 5×5 crystal matrix corresponding to one trigger tower. The pulse shape, obtained by normalizing the acquired time frames to the maximum sample, was used with equation (3) for the computation of the individual crystal weights. The distribution of the 5×5 energy sum in terms of ADC counts, for a 120 GeV electron beam hitting the central crystal, is shown in Figure 2. The energy distribution is improved by using an algorithm that recovers the energy loss in the gaps between the crystals [13]. Using a Gaussian fit to the histogram, an average amplitude of 3315.5 ± 0.3 ADC counts is obtained. This corresponds to a conversion factor of 36.2 MeV/ADC count.
Figure 2. Amplitude distribution in a 5x5 crystal matrix expressed in ADC counts, for a 120 GeV electron beam hitting the central crystal, obtained with the algorithm implemented in the DCC.
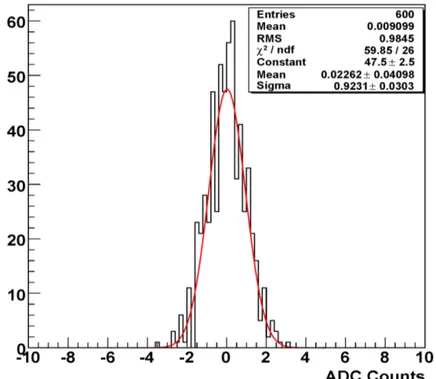
The digital filter threshold is normally specified in units of standard deviation of the crystal noise distribution. The electronic noise for a single crystal can be obtained from a Gaussian fit on the reconstructed amplitude for pedestal runs, where data are taken without beam. For an optimal set of weights the noise distribution must be centered at zero,
as it is observed in Figure 3. For this particular crystal a σnoise = 0.92±0.03 ADC counts (equivalent to 33±1MeV) is
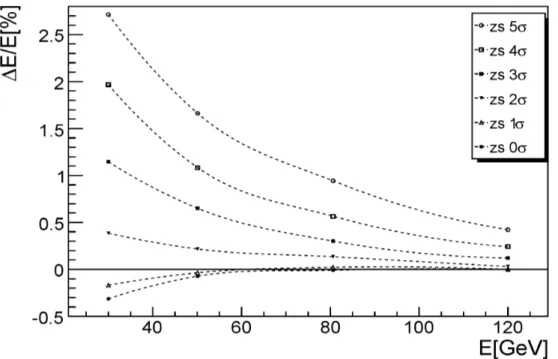
obtained. This is the value used for the 1-sigma threshold suppression in Figure 4, where the effect on the reconstructed electron energy by applying different levels of zero-suppression thresholds is shown. The true beam energy is estimated
using the calorimeter reconstructed energy when zero-suppression thresholds are not applied (Erec
NoZS
). As expected, the effect of the zero-suppression algorithm is more accentuated at low beam energies and becomes important for
thresholds higher than 2σnoise, introducing a large non-linearity in the calorimeter response. This suppression level is not
enough to attain the desired data reduction factor and therefore additional filtering of the data is needed.
Figure 3: ADC amplitude reconstruction of the central crystal over pedestal runs.
6
Figure 4: Percentage difference between true and reconstructed energy, (Erec
NoZS
- Erec (zs) )/ Erec
NoZS
, as a function of the true beam energy for different zero-suppression thresholds.
4 Selective Readout
4.1
The Algorithm
As shown in the previous section, a filtering scheme relying only on a zero-suppression readout does not satisfy the data filtering needs without a significant degradation of the energy reconstruction. For each L1A, the SR implemented for the ECAL detector requires determining high interest calorimeter regions, which should be read out with a low level of suppression or without suppression at all, while data from other areas should be strongly or fully suppressed.
The algorithm is implemented in the SR Algorithm Boards of the off-detector SRP crate and is based on a sliding technique that uses the trigger tower transversal energy classification from the TCC. This classification takes into account two energy thresholds, the high threshold (HTH) and the low threshold (LTH). Trigger towers can be classified
as high (ET≥HTH), intermediate (HTH>ET≥LTH) or low (ET<LTH) interest regions. The algorithm finds the
neighboring trigger towers of each high interest tower and classifies them as neighbors. A filtering flag is then associated to each trigger tower.
The neighboring region around the high interest trigger towers (3×3 or 5×5 trigger regions) and the correspondence among trigger towers and filtering flags are configurable in the SRP system allowing the implementation of different selective readout scenarios. The filtering actions are applied to crystal data of the readout channels. In the endcaps the readout does not match the trigger tower geometry and the readout channels are flagged with the less restrictive filtering action among the trigger towers overlapping with that channel.
4.2
Data Volume Simulation
In order to estimate the optimal SR thresholds and zero-suppression levels that best match the required data volume benchmark, a full detector simulation, using the CMS reconstruction and analysis software framework CMSSW[14] was performed. Given the relatively low energy thresholds used in any ECAL data reduction scenario, it turns out that the ECAL data volume is mainly dominated by the pile-up data. As a consequence, the estimated data volumes are rather sensitive to the model used to describe minimum-bias events. In a previous work [15] this aspect was explored, showing that data volume variations of the order of 50% can occur. In this study, standard minimum-bias events
generated with Phytia Monte Carlo were used. The simulation reproduced the high luminosity conditions (L~1034cm-2s
-1
) superimposing to the L1 event an average of 25 minimum-bias events.
In Figure 5, the data volume for the EB, EE and full detector are shown as function of a static crystal zero-suppression
threshold applied to all readout channels. In this scenario a threshold higher then 3.5σnoise must be applied in order to
fulfill the data volume requirement (~100kB/event).
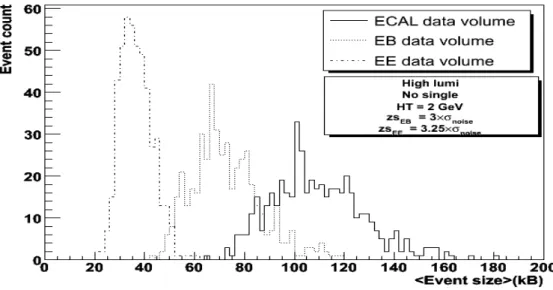
Using a SR scenario where the HTH = LTH = 2.0 GeV and applying the zero-suppression (3 σnoise in the EB and 3.25
σnoise in the EE) to the data from low interest trigger towers that do not belong to the neighborhood of high interest
trigger towers (3×3 region), an average data size matching the data volume requirement is obtained. The contributions from the EB and EE to the event size are shown in Figure 6 while the contribution by DCC is shown in Figure 7.
Figure 5: Data volumes as function of the crystal zero-suppression.
Figure 6: Data volume distributions in the EB, EE and full ECAL detector.
8
5 Conclusions
The CMS data acquisition system limits the average data acquired per link to 2kB for each L1A, which implies that a data reduction factor of almost 20 must be applied. This is achieved by using a selective readout algorithm based on the trigger tower transversal energy and its proximity to high energetic trigger towers. The algorithm dictates the level of suppression applied to the crystal data for each readout channel and has been validated with an experimental study of the data collected in the first electromagnetic calorimeter supermodule during the 2004 H4 test beam. Different scenarios of the selective readout algorithm have been studied with a full detector simulation. It was concluded that the suppression factor is achieved with relatively low energy thresholds and that the average data size is uniformly distributed by the data acquisition links. With these thresholds no performance degradation is expected in the physics reconstruction analysis [16] [17].
List of Acronyms
ADC Analog to Digital Converter CCS Clock and Control SystemCERN European Organization for Particle Physics CMS Compact Muon Solenoid
DAQ Data Acquisition DCC Data Concentrator Card ECAL Electromagnetic Calorimeter EB ECAL Barrel
EE ECAL Endcaps FE Front End
FIFO First In First Out FIR Finite Impulse Response HTH High Threshold LHC Large Hadron Collider LTH Low Threshold L1A Level-1 Accept L1 Level-1
SR Selective Readout
SRP Selective Readout Processor TDC Time to Digital Converter TCC Trigger Concentrator Card
References
[1] CMS Collaboration, CERN/LHCC 94-38.
[2] CMS Collaboration, CMS ECAL Technical Design Report, CERN/LHCC 97-33. [3] CMS Collaboration, Data Acquisition & High Level Trigger, CERN/LHCC 2002-26.
[4] R.Alemany et al., Overview of the ECAL off-detector electronics of the CMS experiment, IEEE JNL Vol.52, Issue 5, Part 3, pag.:1918-1924, Oct. 2005.
[5] CMS Collaboration, The Level-1 Trigger Technical Design Report, CERN/LHCC 2000-038.
[6] N.Almeida et al., Calorimeter Trigger Synchronization in the CMS Experiment, NIM Section A, Vol. 568, Issue 2 , pag. 634-641, December 2006.
[7] P.Paganini, Tests of the boards generating the CMS ECAL Trigger Primitives, from the On-Detector electronics to the Off-Detector electronics system, CMS CR 2004/066.
[8] N.Almeida et al., The Selective Readout Processor for the CMS ECAL. IEEE JNL,Vol. 52, Issue3, Part 2, pag. 772-777, June 2005.
[9] N.Almeida et al, Data Concentrator Card and Test System for the CMS ECAL readout, CMS CR 2003/056. [10] N.Almeida et al., Electromagnetic Calorimeter Raw Data Format, CMS Note 2005/021, Nov. 2005.
[11] P.Paganini et al., Pulse Amplitude Reconstruction in the CMS ECAL Using the Weights Method, CMS Note 2004/025.
[12] ECAL Collaboration, Energy resolution performance of the CMS ECAL, CMS Note 2006/140.
[13] J.Descamps et al., Periodic Position dependence of energy measured in the CMS ECAL, CMS Note 2006/045. [14] CMSSW project website:
https://twiki.cern.ch/twiki/bin/view/CMS/CMSSW
[15] R.Benetta et al., ECAL Data Volume, CMS Note 1997/059.
[16] S.Rutherford, Study of the Effects of Data Reduction Algorithms on Physics Reconstruction in the CMS ECAL, CMS Note 2003/001.
[17] N.Almeida, Data Acquisition and Filtering in the Electromagnetic Calorimeter of the CMS Experiment, CMS TS-2006/002.