HAL Id: inria-00071741
https://hal.inria.fr/inria-00071741
Submitted on 23 May 2006
HAL is a multi-disciplinary open access
archive for the deposit and dissemination of
sci-entific research documents, whether they are
pub-lished or not. The documents may come from
teaching and research institutions in France or
abroad, or from public or private research centers.
L’archive ouverte pluridisciplinaire HAL, est
destinée au dépôt et à la diffusion de documents
scientifiques de niveau recherche, publiés ou non,
émanant des établissements d’enseignement et de
recherche français ou étrangers, des laboratoires
publics ou privés.
Experiments with 802.11b in ad-hoc configurations
Dominique Dhoutaut
To cite this version:
Dominique Dhoutaut. Experiments with 802.11b in ad-hoc configurations. RR-4844, INRIA. 2003.
�inria-00071741�
ISSN 0249-6399
a p p o r t
d e r e c h e r c h e
TH `EME 1
INSTITUT NATIONAL DE RECHERCHE EN INFORMATIQUE ET EN AUTOMATIQUE
Experiments with 802.11b in ad-hoc configurations
Dominique Dhoutaut, Isabelle Gu´erin-Lassous
No 4844
Unit´e de recherche INRIA Rhˆone-Alpes
655, avenue de l’Europe, 38330 Montbonnot-St-Martin (France)
T´el´ephone : +33 4 76 61 52 00 — T´el´ecopie +33 4 76 61 52 52
Experiments with 802.11b in ad-hoc configurations
Dominique Dhoutaut, Isabelle Gu´
erin-Lassous
Th`eme 1 — R´eseaux et syst`emes Projet ARES
Rapport de recherche no 4844 — Juin 2003 — 15 pages
Abstract: Ad hoc networks are wireless and mobile networks without any fixed infras-tructure. Researches in ad hoc networks field have reached a stage where experiments have become necessary. Most of the works in this area concern the design of protocols and their evaluation with theoretical analysis or with simulations. But the evaluation by simulations is not always realistic in ad hoc context due partly to the large dependence toward environmen-tal factors. The main testbeds analyze the behavior of the studied routing protocols. But it is extremely difficult to differentiate in them the effects due to physical and MAC layers from the effects due to routing or others layers protocols. Since most of the current wireless cards implement the IEEE 802.11x standards, we investigate in this paper the services that could exactly be expected from this standard in ad hoc situations. We have developed a tool in order to deploy ad hoc scenarios and to monitor the traffic. From experiments, we extract the capacity of the radio medium, the asymmetry of the used cards, the effects of broadcast and unicast flows and the interfering range. All these parameters should enable a fine-tuning of the proposed protocols for ad hoc networks.
Exp´
erimentations avec 802.11 dans les configurations
ad-hoc
R´esum´e : Les r´eseaux ad-hoc sont des r´eseaux mobiles, sans fil, et sans infrastructure fixe. Les recherches dans le domaine des r´eseaux ad-hoc ont d´esormais atteint un point o`u les exp´erimentations deviennent n´ecessaires. En effet, la plupart des travaux dans ce do-maine concernent les protocoles de routage et leurs ´evaluations par des moyens th´eoriques ou des simulations. Mais les simulations ne fournissent pas des r´esultats toujours r´ealistes dans le contexte particulier des r´eseaux ad-hoc o`u les facteurs environnementaux sont pr´epond´erants. Les principales mesures obtenues par bancs d’essai concernent les proto-coles de routage. Mais il est extrˆemement difficile d’extraire de ces mesures les effets des couches physique et MAC, et de les s´eparer des effets des couches sup´erieures. Puisque la majeure partie des cartes r´eseau sans fil suivent les standards 802.11x, nous nous at-tachons dans ce papier `a d´eterminer quels services nous pouvons en attendre dans le cadre des r´eseaux ad-hoc. Nous avons d´evelopp´e un outil logiciel pour d´eployer des sc´enarios et analyser le trafic. A partir d’exp´erimentations, nous mesurons la capacit´e du m´edium sous diff´erentes configurations ainsi que la zone d’interf´erence, nous montrons les effets de flux diffus´es ou ´emis en mode point-`a-point sur leur voisinage, et nous montrons les probl`emes d’asym´etrie des cartes utilis´ees.
3
1
Introduction and objectives
Researches in ad hoc networks field have reached a stage where experiments have become necessary. Most of these researches concern the design of protocols (MAC, routing, mul-ticast, QoS, security) that are mainly evaluated by theoretical analysis or by simulations (on simulators like NS2, GloMoSim or Opnet). Detailed and realistic simulations are hard to conduct because of the numerous software layers to take into account and the large de-pendence toward environmental factors. The most used simulators necessarily have to make some compromises to allow researchers to rapidly test the general behavior of the protocols they are working on. At present, the community agrees on the fact that there is an obvious lack of real experiments of these protocols. A few real world testbeds have been proposed in [1, 2, 3, 4]. These works generally aim at depicting the behavior of some particular routing protocol (DSR routing protocol for [3, 4], ABR for [1] and AODV and OLSR for [2]). But it is extremely difficult to differentiate in them the effects due to physical and MAC (medium access control) layers from the effects due to routing or others layers protocols.
Nowadays, most of the used wireless cards implement the IEEE 802.11x standards [5] (802.11 for the first ones, 802.11b for the current cards and 802.11a for the new ones). Therefore, the ad hoc networks that can be deployed are based on the features of 802.11. But some works, like in [6, 7, 8, 9], claim that 802.11 is not well adapted to these networks. All these works are based on simulations.
Our main objective is to understand which services could exactly be expected from 802.11 in the context of ad hoc network. To begin, we have studied the effects of “greedy” sources, i.e. stations that may try to use full bandwidth in the network. This choice was motivated in particular by results presented in [9] and showing an inequity phenomenon in some configurations. To evaluate the effects of 802.11 on real ad hoc scenarios, we had no other choice than to develop our own measurement tool. This software enables the deployment of scenarios on real ad hoc networks and the monitoring of many parameters during the experimentations.
In Section 2, we describe this tool. In Section 3, we present the results we obtained. We investigate the communication range under different situations (depending on the distance between the mobiles and on the wireless cards orientation), the evolution of the share of the medium with the number of contending stations, the effects of broadcast on unicast flows and the interfering area.
2
Experimental software
As far as we know, there are two available environments for testing scenarios on ad hoc networks. MobiEmu is a tool for emulating ad hoc network environment with a fixed network [10]. The aim of APE is to evaluate mobile ad hoc routing protocols [11]. APE helps in performing real-world tests as easyly as possible. When we started our software, APE was not fully finalized. Moreover, APE is directed towards the evaluation of routing
4
protocols, whereas our aim is to evaluate 802.11 features in ad hoc contexts without taking into account the effects of higher layers.
Our proposed software can be seen as a toolbox which provides functions to deploy scenarios (i.e. the starting, the delivery and the stopping of flows on the network) and to monitor the packets:
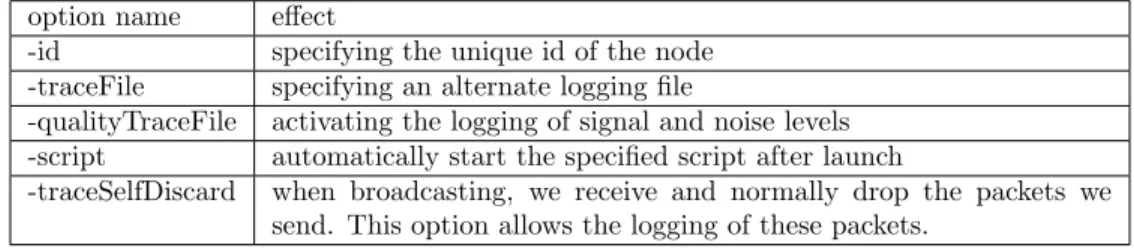
A toolbox Basically, our software runs on linux laptops, without any modification to the system. Through a simple command prompt (Table 2) and some launch time options (Table 1), it provides functions to send data packets and monitor many parameters. The actions of each node running our software are fully scriptable, and a typical measurement session begins with the writing of a script which will command the starting and stopping of flows between the computers.
No routing protocol As we want to catch the effects of 802.11 in ad hoc networks without having to worry about the side effects of the routing protocol (for example retransmissions, timeouts, etc.), we just give to the software the ability to forward packets according to simple rules, generally defined for the script lifetime. Each station maintains a table that indicates which packet should be forwarded and to which station. The modification of the table can be done at any time with functions addForwardingRule and deleteForwardingRule. The stress on the 802.11 effects Since network layer protocols such as TCP add a lot of complexity and thus are masking 802.11 effects, we have chosen to only work with UDP packets. We only implement a Constant Bit Rate (CBR) data source, but it is implemented in a way that allows to choose the sending time with an extreme precision.
Monitoring The software monitors many parameters. For each packet, the following in-formations may be provided “post mortem”: when and by which station the packet has been sent, when and by which stations the packet has been received, with which power and under which noise level. The packets are differentiated by their flow ID, their sequence number within their flow, and some other informations such as sender and last-hop identificator. Collecting, centralizing and analyzing those logs files give quite a good idea of what really happens during experimentations.
Using this tool and the precious help of “some volunteers”, we are able to enlight many phenomenons which do not appear with simulations.
3
Experimental results
3.1
Standard measurements
The first thing we have investigated is the real capacity of the medium under no contention conditions and without RTS/CTS exchange. We have measured the effective maximum
5
option name effect
-id specifying the unique id of the node -traceFile specifying an alternate logging file
-qualityTraceFile activating the logging of signal and noise levels -script automatically start the specified script after launch
-traceSelfDiscard when broadcasting, we receive and normally drop the packets we send. This option allows the logging of these packets.
Table 1: Most of used launch time options
command name description
sync[time] synchronize the clock on all nodes
setTimetime sets the local time
time displays the local current time
showReceivedPackets0 | 1 every second, shows how many packets are received (and the flows they belong to)
pingAll broadcast a ping packet, to which each
node must reply with a pong packet startCBR numSourceThread flowID
id-Source delay packetSize [destinationIP]
start a CBR flow. The sender, the packet size, the delay between packets and the flow ID must be specified. An optional IP ad-dress is used to force unicast transmission instead of broadcast.
stopCBRnumSourceThread numNode stop a CBR source (specified by node and source thread)
addForwardingRule idNode flowID ID-LastHop [destinationIP]
packet having the specified flow ID and last hop identifier will be repeated. An option-nal IP address is used to force unicast. deleteForwardingRule idNode flowID
IDLastHop
deletes a rule set by the previous function. execScriptscriptName execute the specified script
execCommandshellCommand execute the specified shell command Table 2: Most of used commands
6
throughput between two computers close to each other. The experience consists in sending UDP packets of growing size (50 bytes increase at each step) as fast as possible.
Ethernet fragmentation is the first thing we notice when looking at Figure 1, through the abrupt decrease in throughput when the packet size is larger than 1500 bytes. Even if 802.11b accepts much larger packets (2346 bytes in [5]), the network layer is not aware of that and fragments the packets in order to optimize the performances for what it thinks to be an ethernet card. Note that before the fragmentation breakpoint the throughput increases with the packets size and the maximum rate of 5.87 Mb/s is achieved with UDP packets of 1432 bytes payload.
Huge WEP effect is the second thing we can notice for packets of 1000 bytes and more, but only at 11Mbit/s. At lower rates WEP does not seem to have any visible impact. It should be noted that most applications sending large amounts of data (FTP, web, etc.) are using large packets, and will thus suffer a lot from this effect.
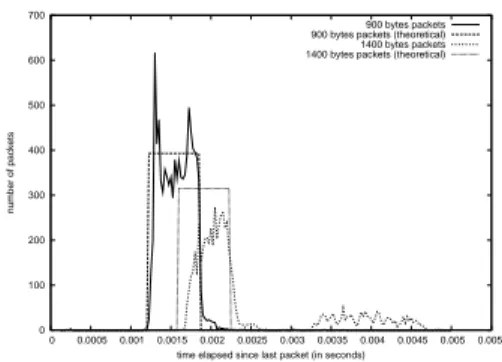
We precisely measured the time between each packet reception, and as we use full band-width, this is almost equivalent to the transmission time. On Figure 2, we present the distribution of the measured and theoretical transmission times of 15 seconds burst of 900 and 1400 bytes packets. From Figure 1 we recall that the problem with WEP does not occur for 900 bytes packets, and their theoretical and measured transmission times distributions in Figure 2 are indeed quite close. But many 1400 bytes packets are delayed of a time corresponding to the transmission time of a packet (from 1592 to 2212 µs depending of the random backoff), what leads us to think that those packets have been lost and retransmit-ted. It seems that the card firmware takes a long time for WEP deciphering and sometimes times out on acknowledgement.
Moreover this behavior has been noticed at 11Mbit/s for Lucent’s Orinoco and Wavelan Silver cards as well as Orinoco Gold cards. Orinoco Gold cards perform even worse when using 128bit WEP encryption, even if packets transmission time analysis does not show the same pattern. This problem seems to be closely tied to the firmware, so we have chosen to not use WEP anymore in the rest of our measurements. Note that the measured results without the use of WEP are in concordance with theory.
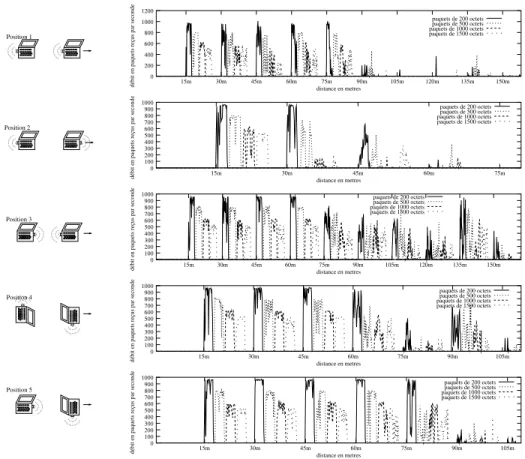
Effective communication range is another parameter we are interested in, because of its importance for routing protocols efficiency. Even if some laptops have integrated antennas, most of them don’t have such facilities and have to rely on the less efficient ones provided by the PCMCIA wireless cards themselves. Using the default 15 dBm transmission power of our Lucent’s Wavelan silver card, we measured the throughput for different cards dispositions (Figure 3 on the left). In order to catch the characteristics of the cards, we worked in open space, still using only two computers. We had a computer sending packets as fast as possible, and moving away from the receiver by 15 meters increment. At each step, to catch eventual effects of the packet size we successively sent 20 seconds bursts of
7 0 100000 200000 300000 400000 500000 600000 700000 800000 0 500 1000 1500 2000 2500 3000
debit en octets par seconde
taille des paquets UDP
11MBit/s avec WEP 11MBit/s sans WEP 5.5MBit/s 2MBits/s 1MBits/s
Figure 1: Throughput depending on packet size 0 100 200 300 400 500 600 700 0 0.0005 0.001 0.0015 0.002 0.0025 0.003 0.0035 0.004 0.0045 0.005 0.0055 number of packets
time elapsed since last packet (in seconds) 900 bytes packets 900 bytes packets (theoretical) 1400 bytes packets 1400 bytes packets (theoretical)
Figure 2: Effect of WEP on transmission delay
200, 500, 1000 and 1400 bytes packets. The throughputs for each position are presented on Figure 3.
When cards are on opposite sides, after a couple of meters we can observe a strong de-crease of throughput (position 2 on Figure 3). At the contrary, in almost optimal conditions (cards facing each other, position 3 on Figure 3), until 60 meters we obtain full bandwidth, and then begin to suffer from a throughput reduction.
It should be noted that transmitter orientation is important (see differences between positions 1 and 2 on Figure 3), as well as receiver orientation (see differences between positions 1 and 3. Positions 4 and 5 may be considered as intermediate.
At some points, we observe a throughput greater than that measured for a shorter range (at 135 meters for position 3 and 90 meters for position 4). This phenomenon is probably caused by radio channel properties; even in open space, it’s difficult to totally avoid multipath and fading.
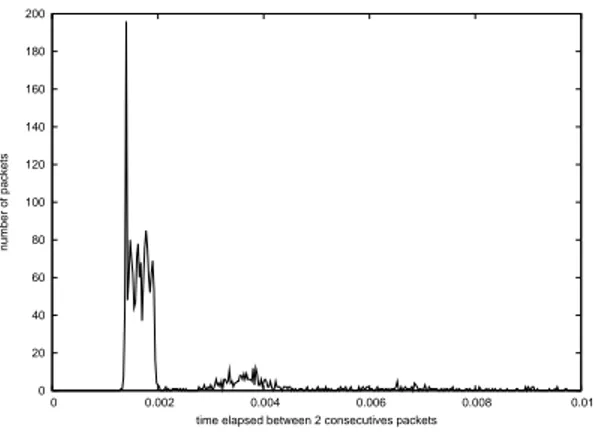
It’s important to note that during all these measurements, the cards stayed in 11Mbit/s mode. Figure 4 shows the distribution of the transmissions times of 1000 bytes packets for position 3 at 120 meters. Our 1000 bytes application data packets should theoretically be transmitted in a range from 1296 to 1916 µs, depending on random backoff. The first (and highest) peak almost exactly corresponds to this. The second peak corresponds to packets that suffered a single retransmission. If the cards had switched to 5.5 or 2Mbit/s mode, the first peak would have been between 2091-2711 and 4876-5496 µs respectively.
We recall that Figure 4 shows in reality the distribution of the time between two suc-cessfull receptions. The presence of the two peaks at places where we would have expected them in optimal transmission conditions thus clearly indicates a bursty behavior.
8 Position 1 0 200 400 600 800 1000 1200 15m 30m 45m 60m 75m 90m 105m 120m 135m 150m
débit en paquets reçus par seconde distance en metres
paquets de 200 octets paquets de 500 octets paquets de 1000 octets paquets de 1500 octets Position 2 0 100 200 300 400 500 600 700 800 900 1000 15m 30m 45m 60m 75m
débit en paquets reçus par seconde
distance en metres paquets de 200 octets paquets de 500 octets paquets de 1000 octets paquets de 1500 octets Position 3 0 100 200 300 400 500 600 700 800 900 1000 15m 30m 45m 60m 75m 90m 105m 120m 135m 150m
débit en paquets reçus par seconde distance en metres
paquets de 200 octets paquets de 500 octets paquets de 1000 octets paquets de 1500 octets Position 4 0 100 200 300 400 500 600 700 800 900 1000 15m 30m 45m 60m 75m 90m 105m
débit en paquets reçus par seconde distance en metres
paquets de 200 octets paquets de 500 octets paquets de 1000 octets paquets de 1500 octets Position 5 0 100 200 300 400 500 600 700 800 900 1000 15m 30m 45m 60m 75m 90m 105m
débit en paquets reçus par seconde
distance en metres
paquets de 200 octets paquets de 500 octets paquets de 1000 octets paquets de 1500 octets
Figure 3: Measured throughput in function of distance and antennas orientation
9 0 20 40 60 80 100 120 140 160 180 200 0 0.002 0.004 0.006 0.008 0.01 number of packets
time elapsed between 2 consecutives packets
Figure 4: transmission times distribution for position 3 at 120 meters
Any major difference between small (200 bytes) and large (1400 bytes) packets can not be noticed. They seem to be altered in the same way when the distance increases. This could be explained by the bursty behavior noticed above.
These measurements clearly indicate that real world radio wireless cards present a strong asymmetry in their coverage range, or at least that the radio coverage around a laptop equipped with one of these cards is not a circle at all, as often assumed in simulators. This can have a strong impact on ad hoc routing protocols where few links may be recognized as symmetric links as in usual simulations. The measurements of the signal and noise levels (Figure 5 and 6) confirm this problem since the signal level when the cards are not facing each other is clearly lower than when they are.
This also means that even in outdoor environment, as soon as some mobility, including simple rotation of the mobiles, is considered, the connectivity becomes quite unstable.
3.2
Share of the medium
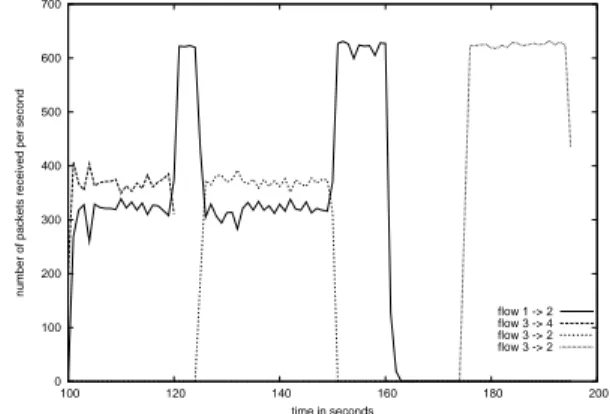
As second type of experiments, we measure the share of the radio medium with 802.11 in presence of two stations. First, two stations try to send as many packets as possible to two other stations, then the two emitters try to send to the same station and next one single station sends data to its associated receiver (see Figure 7). The results are given in Figure 8. Note that there are notable differences in the rates of the two flows: one flow has a ten percent greater rate. This can be explained by the heterogeneousness of the stations (but not the wireless cards), but you can notice that the maximum throughputs of each pair when they are isolated are exactly the same! It is also interesting to note that the total throughput (sum of the throughput of the two pairs) are higher than the maximal throughput of one
10 -100 -90 -80 -70 -60 -50 -40 -30 0 100 200 300 400 500 600 700 dBm time (seconds) signal level noise level
Figure 5: Signal and noise levels for posi-tion 2 -100 -90 -80 -70 -60 -50 -40 -30 0 200 400 600 800 1000 1200 1400 dBm time (seconds) signal level noise level
Figure 6: Signal and noise levels for posi-tion 3
isolated pair. This can be explained by the radio medium access of 802.11: when a station that wants to access the radio medium is interrupted by a communication during its silent period (backoff), it uses its remaining backoff and not a new one in the following process of medium access (i.e. when the interrupting communication is over). This feature leads to the overlapping of the silence periods of the different sending stations, and thus to an increase of the medium capacity compared to the single pair scenario (Section 3.1).
3 −> 2 1 −> 2 3 −> 4 3 −> 2 1 2 1 2 1 2 2 3 3 4 3 time in seconds 0 120 125 150 165 175 195
Figure 7: Two pairs in communication
range 0 100 200 300 400 500 600 700 100 120 140 160 180 200
number of packets received per second
time in seconds
flow 1 -> 2 flow 3 -> 4 flow 3 -> 2 flow 3 -> 2
Figure 8: Throughputs when two pairs are in communication range
11 2 3 4 5 6 7 8 1 301 201 301 401 501 601 701 801 time 201 401 501 601 701 801
Figure 9: Growing number of contending flows 0 200 400 600 800 1000 1200 1400
1 flow 2 flows 3 flows 4 flows 5 flows 6 flows 7 flows
throughput in packets received per second
number of simultaneous flows
Figure 10: Measured throughput in the growing number of contending flows exper-iment 0 200 400 600 800 1000 1200 1400 1600 1800 2000 0 0.0005 0.001 0.0015 0.002 0.0025 0.003 0.0035 0.004 number of packets
time elapsed between 2 consecutives packets
Figure 11: Distribution of the time elapsed between two consecutive packets with 7 con-tending flows
In order to analyze the sharing of the medium between a larger number of contending stations, we realized the experiment presented on Figure 9. One laptop is configured as receiver. At the beginning, only one laptop is allowed to transmit. As usual we use CBR bursts of 200, 500, 1000, 1400 and 2000 bytes. At each step we add one more transmitter, until we reach seven emitters. The results are shown on Figure 10. As more and more stations contend for the medium, and as they are able to decrement their backoff all at the same time, this results in a reduction of the mean time of inactivity between two packets on the medium. This causes the increase in total throughput seen on Figure 10.
12
2
1 3
4
Figure 12: Position of the 2 pairs - 2 pairs scenario Unicast Unicast Unicast Broadcast Broadcast temps en secondes 0 15 20 35 40 5560 75 1 −> 2 3 −> 4
Figure 13: Communication pattern in the 2 pairs scenario 0 100 200 300 400 500 600 700 trŁs proches 25.5m 58m 94.5m 119.75m 159.75m 189.75m
nombre de paquets recus par seconde
distance en metres
unicast 1 -> 2 broadcast 1 -> 2 broadcast 3 -> 4
Figure 14: Received packets for mobile 2 in the 2 pairs scenario
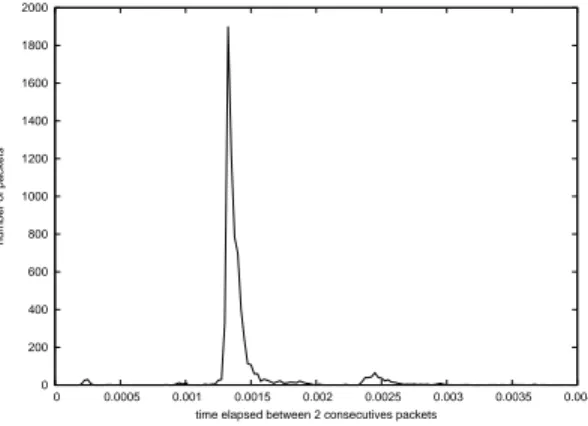
Figure 11 presents the time elapsed between two consecutive 1000 bytes packets recep-tions when all the seven transmitters are active. As previously explained, in the condirecep-tions of the experiment, this time is equivalent to the transmission time of the packets. We can observe a first peak, mostly between 1300 and 1500 µs, which gives a good graphical representation of the reduction of the ’perceived’ backoff. The second peak represents re-emissions of packets (most probably due to collisions). 93.25 percents of the packets have a transmission time below 2000 µs. For this packet size, the collision rate is 6.25 percents at maximum.
3.3
Broadcast and interfering range
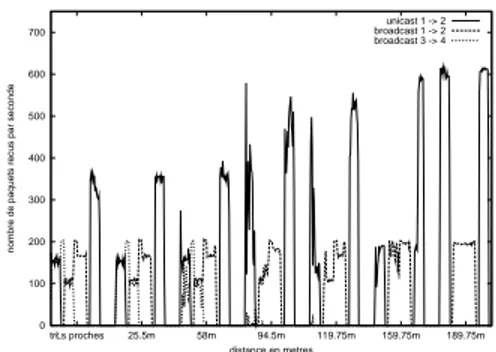
Using 4 mobiles and a maximum of two simultaneous flows, we try to evaluate the inter-ferences a sender can cause in its direct and indirect neighborhood. For that purpose, we put the mobiles in the configuration shown on Figure 12, the wireless cards positions cor-responding to position 4 in Figure 3. At the beginning, all the mobiles are very close. At each step, we move them away from each other of a few meters. Each step lasts for 100 seconds. During each step, 1000 bytes packets are used in the data flows, and we alternate between a unicast 11Mbit/s flow and a broadcast 2Mbit/s flow as shown on Figure 13. The results presented on Figure 14 are the packets received at the mobile number 2 from the senders. This figure gives a lot of informations and we will consider different parts from it. The x-axis is in reality a time axis, but it is easier to read the figure the way it is presented, provided we remember a step lasts for 100 seconds.
We begin with the period corresponding the first two steps (almost 0 and 25 meters). Here, all mobiles are in direct communication range of each other. During seconds 0-20 of these steps, one 11Mbit/s flow competes with the broadcast 2Mbit/s flow. As expected from
13
802.11b, the effective throughput is the same for all flows; even if the 2Mbit/s one gets a larger share of the time. It means that the unicast flow has a smaller throughput with a concurrent broadcast flow than with a unicast one ([12]). During seconds 20-35, the two 2Mbit/s flows compete, and each gets half of the bandwidth. During seconds 40-55, the situation is the symmetric to the one in seconds 0-15. Of course, as this figure shows what the mobile number 2 receives, we can not see the unicast flow between 3 and 4, but it can still be indirectly perceived because the flows coming from 1 do not get the full bandwidth. The second period of interest goes from the third to the sixth step. Here we are in what we can call the “interference range”. Not all packets sent by the other pair are successfully received by mobile 2, but the carrier sense mechanism still detects foreign activity on the medium; and thus the stations are forced to postpone their sending. One point of particular interest can be highlighted from steps 4, 5 and 6 results. As the broadcasts are done at 2 Mbit/s, they have a greater range than the unicast flows at 11Mbit/s. In ad hoc network, it may lead to what is called the “gray zone”, as mentioned in [13]. Packets broadcasted by routing protocols to detect the neighborhood and to compute the routes are received in that zone, but data packets sent at higher speed may not be received anymore. This “gray zone” can not be seen directly in this scenario (we would have needed an additional unicast flow coming from 3 to 2), but the interference areas are subject to the same phenomenon. It is mostly visible during the 0-15 and 60-75 periods of the 159 meters step. At the beginning (0-20), our “local” unicast flow has obviously to share the medium with a broadcast flow sent by the other pair, but it is not the case anymore at the end (60-75), when there is an unicast flow in the other pair.
Finally, the two pairs go out of interference range of each other. This is the third period (189 meters and beyond), and each flow gets the whole bandwith.
From this scenario we can see that the interference range is at least two times larger than the communication range, which is fairly consistent with the results given by simulators. But the great variance in throughput even with static stations and the impact of the “gray zone” are lacking in simulators (especially NS2), and thus many routing protocols unfortunately do not take them into account.
4
Conclusion
In this article, we describe a tool to deploy scenarios (i.e. the starting, the delivery and the stopping of flows on the network) and to monitor the packets on ad hoc networks. The aim of this tool is to measure and understand the effects of 802.11b (standard widely used in most of the wireless cards) in ad hoc networks without worrying about any routing protocol. With the presented results, we can extract the capacity of the radio medium in different configurations (different number of stations, different orientations of the wireless cards, with and without WEP), the notable asymmetry of the radio propagation with the used cards (never implemented in most of the simulators), the slowdown of the unicast flows in presence of broadcast flows and the interfering range. The main conclusions that can be drawn from these results are:
14
• The maximal throughput obtained for one station is 5.87 MB/s with packets of 1432 bytes payload at 11 MB/s.
• The overall throughput increases with the number of contending stations, due to the silent periods covering in the 802.11 MAC protocol.
• Few collisions have been detected, even with 7 contending flows.
• There is an “acceptable” equity between the contending flows in the tested scenario. • The communication range fully depends on the wireless cards orientation (emitters
and receivers).
• Beyond the communication range, there exists an unstable area where the communic-ation is unpredictable .
• The broadcasted flows reduce the throughput of the unicast flows. • The “gray zone” has been perceived.
• The interference range is at least two times larger than the communication range in open space.
We hope these results will help in the design of more accurate protocols for ad hoc networks.
In the following, we intend to intensify our experiments and to investigate the inequity problem that has appeared on different simulations on one hand and the multi-hops features of ad hoc networks on the other hand.
References
[1] C.-K. Toh, Richard Chen, Minar Delwar, and Donald Allen. Experimenting with an ad hoc wireless network on campus: insights and experiences. ACM SIGMETRICS Performance Evaluation Review, 28(3):21–29, December 2000.
[2] H. Lundgren, D. Lundberg, J. Nielsen, E. Nordstrom, and C Tschudin. A large-scale testbed for reproducible ad hoc protocol evaluations. In Proceedings of the IEEE Wire-less Communications and Networking Conference, Orlando, USA, March 2002. [3] David A. Maltz, Josh Broch, and David B Johnson. Quantitative lessons from a
full-scale multi-hop wireless ad hoc network testbed. In Proceedings of IEEE Wireless Communications and Network Conference 2000, September 2000.
[4] David A. Maltz, Josh Broch, and David B Johnson. Experiences designing and building a multi-hop wireless ad hoc network testbed. Technical report, School of Computer Science, Carnegie Mellon University, 1999.
15
[5] Wireless Lan Media Access Control (MAC) and Physical Layer (PHY) Specifications, 1999.
[6] T. Nandagopal, T.-E. Kim, X. Gao, and V. Bharghavan. Achieving MAC Layer Fairness in Wireless Packets Networks. In Proceedings of MOBICOM, 2000.
[7] Y. Wang and B. Bensaou. Achieving Fairness in IEEE 802.11 DFWMAC with Variables Packet Lengths. In Proceedings of IEEE GLOBECOM, November 2001.
[8] S. XU and T. Saadawi. Does the IEEE 802.11 MAC Protocol Work Well in Multihop Wireless Ad Hoc Networks. IEEE Communications Magazine, 2001.
[9] D. Dhoutaut and I. Gu´erin Lassous. Impact of Heavy Traffic Beyond Communication Range in Multi-Hops Ad Hoc Networks. In Third International Network Conference, Plymouth, Angleterre, 2002.
[10] Zhang Yongguang and Li Wei. An Integrated Environment for Testing Mobile Ad-Hoc Networks. In Proceedings of the Third ACM International Symposium on Mobile Ad Hoc Networking and Computing (MobiHoc’02), Lausanne, Switzerland, July 2002. [11] H. Lundgren, D. Lundberg, J. Nielsen, E. Nordstr¨om, and C. Tschudin. A Large-scale
Testbed for Reproducible Ad hoc Protocol Evaluations. In Proceedings of the IEEE Wireless Communications and Networks Conference, Orlando, FL., USA, March 2002. [12] M. Heusse, F. Rousseau, G. Berger-Sabbatel, and A. Duda. Performance anomaly of
802.11b. In Proceedings of INFOCOM 2003.
[13] Henrik Lundgren, Erik Nordstr¨om, and Christian Tschudin. Coping with commu-nication gray zones in IEEE 802.11b based ad hoc networks. In The Fifth Interna-tional Workshop on Wireless Mobile Multimedia, WOWMOM 2002, Atlanta, Georgia, September 2002.
Unit´e de recherche INRIA Rhˆone-Alpes
655, avenue de l’Europe - 38330 Montbonnot-St-Martin (France)
Unit´e de recherche INRIA Futurs : Domaine de Voluceau - Rocquencourt - BP 105 - 78153 Le Chesnay Cedex (France) Unit´e de recherche INRIA Lorraine : LORIA, Technopˆole de Nancy-Brabois - Campus scientifique
615, rue du Jardin Botanique - BP 101 - 54602 Villers-l`es-Nancy Cedex (France)
Unit´e de recherche INRIA Rennes : IRISA, Campus universitaire de Beaulieu - 35042 Rennes Cedex (France) Unit´e de recherche INRIA Rocquencourt : Domaine de Voluceau - Rocquencourt - BP 105 - 78153 Le Chesnay Cedex (France)
Unit´e de recherche INRIA Sophia Antipolis : 2004, route des Lucioles - BP 93 - 06902 Sophia Antipolis Cedex (France)
´ Editeur
INRIA - Domaine de Voluceau - Rocquencourt, BP 105 - 78153 Le Chesnay Cedex (France)
http://www.inria.fr