Exp Brain Res (2005) 160: 141–153 DOI 10.1007/s00221-004-1995-x
R E S E A R C H A RT I C L E S
Philippe Vindras . Paolo Viviani
Planning short pointing sequences
Received: 4 August 2003 / Accepted: 30 May 2004 / Published online: 17 July 2004
# Springer-Verlag 2004
Abstract An experiment tested the hypothesis that fast, short sequences of movements are planned as a whole, before movement inception. The experimental task con-sisted of pointing to either one (one-step condition), or two (two-step condition) visual targets aligned along the mid-sagittal axis in a horizontal plane. There were nine possible arrangements of the targets resulting from all combinations of three distances (5, 10, 15 cm), and two trial orders (blocked or random). Performances were characterised by reaction time (RT), movement kinemat-ics, and spatial accuracy. Compared with one-step trials, the first movements of two-step trials had longer RTs (length effect), particularly in random sessions, and when the sequences included short-distance targets. There were also differences in duration (one-target advantage), velocity profile and spatial accuracy that did not depend on the characteristics of the second movement. The results are inconsistent with the assumption that two-step sequences are planned as a whole. Instead, they are in keeping with the alternative hypothesis that part of the preparation of the second step takes place during the execution of the first step.
Keywords Context effect . Motor planning . Movement sequences. . One-target advantage . Visuo-manual pointing
Introduction
The term holistic planning refers to the notion that movements in which several components have to be sequenced in a precise spatio-temporal order are generated
on the basis of an internal representation of the totality of the to-be-executed gesture, sometimes referred to as motor template. Because movement planning is supposed to have access to a bird’s view of the template, the way earlier components of the motor sequence are executed may depend on the way later components will be executed.
Several observations are generally cited as evidence of this mode of motor planning: 1) context effect, which is a term sometimes used to refer to any situation in which the kinematics of one motor component is influenced by the context in which the entire gesture is executed. In particular, it can be argued that also the so-called “one-target advantage”, i.e. the fact that movement times are shorter when movements are performed alone rather than in a sequence, is a form of context effect (Adam et al.
2000). However, we adopt here a stricter definition, by referring to context effects only to denote those situations where the cinematic parameters of an earlier phase of the movement are found to depend on the specific nature of the later phases (Marteniuk et al. 1987; Rand et al.1997; Rosenbaum 1991). The best known examples of these effects are found in speech, in which the articulatory manoeuvres for uttering a syllable depend on subsequent syllables (cf Hardcastle and Hewlett 1999); 2) in some highly skilled motor tasks such as touch typing (Engel et al.1997; Terzuolo and Viviani1980; Viviani and Laissard
1996), and Morse coding (Bryan and Harter1897,1899), the set of ratios between the duration of the movement components are invariant across variations of the total duration (homothetic behaviour); 3) direct evidence that the timing of the sequence is dictated by a template. For instance, such evidence has been provided in the case of typing, by showing that there are pairs of words (e.g. daughter and laughter) which differ by only one letter, and whose entire timing pattern is distinctly different (Viviani and Laissard 1996); 4) positive correlations between velocities in sequences of hand movements (e.g. Weiss et al.1997); and 5) the constant and variable errors at the end of a sequence component depend on the accuracy constraints on later components (Sidaway et al.1995). P. Vindras . P. Viviani (*)
Faculty of Psychology and Educational Sciences, University of Geneva,
40 Boulevard du Pont d’Arve, 1205 Geneva, Switzerland e-mail: [email protected] P. Viviani
Faculty of Psychology, UHSR University, Milan, Italy
The concept of holistic planning is often associated with that of advance planning, i.e. the notion that the executive plan is ready before the execution of the first component. Specific support in favour of advance planning comes from reaction time studies, in particular from the so-called length effect. It has long been observed that the time to initiate a sequence of discrete movements (RT) increases with the number of elements in the sequence (Henry and Rogers 1960). This finding has been replicated for many different motor sequences, such as hand movements (Klapp et al. 1974; Sternberg et al. 1978), and utterance of syllables (Klapp et al.1973; Sternberg et al.1980). It is debated whether the RT increase reflects the time to set up an increasingly large motor program (Klapp et al. 1973), or to read it out (cf. Keele1981). In either case, however, a clear separation is assumed between processes pertaining the programming and the execution of the movement.
Evidence for advance holistic planning comes mostly from the analysis of motor sequence corresponding to an underlying code, as in typing, or in the presence of strong biomechanical constraints that need to be taken into account in advance, and incorporated in the plan, as in speaking. However, although this is seldom stated clearly, there seems to be a consensus that this mode of planning is also the default solution for any fast, short sequence of movements in which the spatial constraints are indicated in advance. The validity of this generalisation is not obvious. To begin with, the length effect is not ubiquitous. Under some choice conditions the reaction time to begin a response sequence actually decreases with the length of the sequence (Rosenbaum et al. 1987). This seemingly paradoxical result suggests that advance planning is not the only available option. Instead, it is possible that, whenever the available moving time is sufficiently long, the sequences are planned piece-wise with the specifica-tion of later components being carried out on-line, during the execution of the earlier components. Indeed, variants of this idea were advocated by Chamberlin and Magill (1989) and by Adam et al. (2000) to account for the one-target advantage phenomenon. Along the same line of thinking, one may suspect that piece-wise planning is actually the only sensible solution whenever the task prevents the motor control system from securing reliable information on the state of the moving limb at the end of each step of the sequence. In such cases, in fact, it would seem inevitable that the planning of one step is achieved only after its initial conditions have been sufficiently specified in the course of the execution of the previous step.
We designed an experiment to demonstrate that piece-wise planning can be a sensible solution even in the case of very simple (two-step) motor sequences involving targets that are fully identified in advance. The task consisted in either one pointing movement to a visual target placed at different distances, or two successive movements with different extent. We predicted that adding a second step might alter both the reaction time and the spatio-temporal parameters of the first movement. How-ever, contrary to what one would expect if the sequence
were planned in advance as a whole, we also predicted that these changes are independent of the characteristics of the second step.
Both for one- and two-step movements, it may be relevant to distinguish between an earlier planning phase in which visual information is used to set up the general outline of the to-be-performed movement and a subse-quent planning phase in which this outline is specified on the basis of the contingencies of the execution. For this reason, the experiment included two different schedules for presenting the stimuli. In the first schedule, all repetitions for a given set of targets were administered in blocks. Presumably, this schedule opens the possibility of using the same standard outline for all trials in the block (Ghez et al.1997). In the second schedule repetitions were administered in a random order, thus forcing the participant to create a new outline on each trial. By comparing the results obtained with the two schedules, one may be able to substantiate the distinction mentioned above between planning and specification.
Methods
Participants
Six female and three male right-handed individuals participated for payment. Their age ranged between 19 and 41 years (average 25). Participants had normal or corrected-to-normal vision. Informed consent was obtained from all participants. The experimental protocol was approved by the Ethical Committee of the University of Geneva.
Apparatus
Participants were seated in front of a digitising table (Numonics Corporation, Montgomeryville, PA, USA; model 2200–2436; size: 110×80 cm; nominal accuracy: 0.025 mm; sampling frequency: 200 samples/s) mounted horizontally. The relative position of the participant with respect to the table was controlled by adjusting individually height and position of an orthopaedic seat that provided stable and comfortable support both to the buttocks and to the knees. During the testing, the right elbow was supported by the table in a comfortable writing posture (Fig. 1). Holding the recording pen (20 cm long, 1 cm in diameter, weight: 20 g) with the right hand, participants could point without effort to any location on the table within a distance of about 60 cm from the chest. The position of the pen’s tip could be recorded continuously as long as it remained within 1 cm of the table surface. The starting point and the position of the targets were indicated by 4-mm-wide laser spots controlled by galvanometric mirrors (General Scanning Inc., Watertown, MA, USA; G300DT with CX660 amplifier). The spot was projected on a translucid screen placed horizontally 60 cm above the digitising table. A half-tan mirror placed horizontally halfway between the screen and the table reflected the spot, providing a virtual image on the table surface. The digitising table was covered by a sheet of glazed paper on which were drawn a small circle (radius: 2 mm) and six larger circles with a 10-mm radius (Fig.1). The small circle was 10 cm in front of the participants’ sternum, and was used as the starting position for all movements. The centres of the larger circles were spaced by 5 cm along the sagittal axis, and served as targets. Each target was characterised by an index of difficulty (ID) defined as ID = log2(2 × A/W) where A is the distance from the starting position and W is the diameter of the circle (Fitts1954). The ID of targets 1–6 was 2.32, 3.32, 3.91, 4.32, 4.64, and 4.91, respectively.
The apparatus was enclosed in a lightproof box with just a hole in the front side for fitting the participant’s face. The working space between the table and the half-tan mirror was dimly illuminated, so that the spot, the target circles, and the hand were clearly visible by the participant. A computer controlled all phases of the experiment and provided the experimenter with a real-time preview of the data being acquired.
Task and experimental procedure
Participants were tested in two sessions on different days. Sessions differed by the order in which target distance varied from trial to trial. In RND sessions, different combinations of target distance alternated randomly. In BLK sessions, different combinations were administered in blocks. Each session comprised two conditions. In the first (one-step) condition (C1), the sequence of the events within a trial was the following: 1) the laser spot appeared on the starting position; 2) the participant moved the stylus to the starting position, and an acoustic signal was delivered when the accuracy of the positioning (tolerance: 4 mm) had remained stable for 400 ms; 3) the laser spot moved to one of the three proximal targets (1, 2 or 3 in Fig. 1) and remained there for a time varying randomly between 1,500 and 2,500 ms—during this time, the participant was asked to keep a stable fixation on the spot, which was flickering at 20 cps; 4) at the end of this period, another flickering spot (20 cps) appeared in the centre of a second circle, more distal than the first one—this was the Go signal for a movement from the initial position to the centre of the first circle; and 5) a second acoustic signal indicated that the target had been reached correctly. Then, the two flickering spots disappeared and the continuous one reappeared on the starting position, marking the beginning of the next trial. Because of the required fixation on the first target, the second spot appeared always in the periphery of the visual field. However, the exact position of the second spot was irrelevant in this condition. Pointing movements were considered correct if the final position of the stylus was within the circle. When this criterion was not met, the trial was aborted. Aborted trials were repeated without interruption either at the end of the session (RND sessions), or immediately after the trial (BLK sessions).
In the second (two-step) condition (C2), the initial part of the trial was identical to that in the first condition. After reaching the first target, the participant was required to make a second pointing movement from the first to the second target (i.e. the one that
prompted the first movement). In both conditions participants were instructed to perform uncorrected, ballistic movements at a velocity compatible with the required accuracy (see above). In the two-step condition it was emphasised that the two successive movements should be separated by a clear stop on the intermediate location. The accuracy of the performance was monitored in three ways. In addition to verify the spatial accuracy of the landing within the first circle, as in condition 1, the computer also checked that the second pointing ended within less than 10 mm from the centre of the second target, and that the velocity remained below 2 cm/s during at least 20 ms when the pen was within the first via-point target. Trials that failed to comply with any of these three conditions were aborted and repeated (see above).
In each condition, participants were administered 108 trials (12 repetitions × 9 target pairs). The distance from the starting position to the first target was 5 cm (target pairs 1–3 in Fig.1), 10 cm (pairs 4–6), or 15 cm (pairs 7–9). The distance from the first to the second target was 5 cm (pairs 1, 4, and 7; ID = 2.32), 10 cm (pairs 2, 5, and 8; ID = 3.32) or 15 cm (pairs 3, 6, and 9; ID = 3.91). In random sessions, the 108 trials were administered in a random order by sequencing blocks of nine trials, within each of which the nine target pairs occurred in a different order. A different pseudo-random order was chosen for each participant. In blocked sessions, the 12 repetitions for each combination of target distances were administered in nine successive blocks. The distribution of the stimuli within the session was counterbalanced by drawing the order of the nine blocks for each of participant from a 9×9 magic square. Each condition was preceded by nine successful practice trials, one for each combination of step length.
Data analysis
Movement coordinates were recorded for 1.5 s (condition C1) or 2.5 s (condition C2) beginning at target onset. Before computing tangential velocity and acceleration, the samples were filtered (cut-off frequency: 8 Hz) with a 15-point digital convolution algorithm (Rabiner and Gold1975). Movement onset was defined as the first time the tangential velocity exceeded 2 cm/s, and remained above this threshold for at least 50 ms. The end of the trial was defined as the first time the tangential velocity remained for more than 100 ms below a 2 cm/s threshold. Note that the stop criterion for the intermediate target (20 ms) was shorter than this final stop value. In fact, preliminary tests with the same 100 ms value showed that some participants tended to stop for a shorter time, while others remained on the via-point target for a much longer time, so that the entire movement could no longer be construed as an integrated sequence. With the adopted 20-ms threshold, the percentage of rejected trials in condition C2 remained acceptable (17%), albeit higher than in condition C1(6%). In all cases, recorded trials were inspected after the experiment before being accepted. On the basis of graphical interpolations of the velocity profiles, we corrected manually the final time and the final position of the first movement in 16 out of the 1,944 C2 trials (11 in RND sessions and 5 in BLK sessions). Twenty-seven final stop times were also modified, 17 of which from random sessions. Moreover, a screening of the data outliers and of the associated velocity profiles, led us to correct nine movement times (five of which were second movement times in condition C2), and eight reaction times (seven of which were in condition C1). One trial was lost in condition C1. All performance parameters for that trial were replaced by their average values computed over the 11 other similar trials from the same participant.
The independent variables were the number of steps (conditions C1/C2), the order of the trials (sessions RND/BLK), the size of the first and second step, and the index of difficulty of the second target (because step sizes are not independent of the ID of the second target, these variables were not included simultaneously in the ANOVAs). For the last three variables, the analyses considered only the linear contrasts. The dependent variables were reaction time (RT), movement time (MT) and maximal velocity (Vmax) of the first step, and spatial errors for the first and second target (by convention, Fig. 1 Workspace and description of the sequences. Six targets
(circles 1–6, radius: 1 cm) positioned every 5 cm along the mid-sagittal direction were permanently displayed on the digitising table. Targets were selected by a laser spot appearing at the centre of the circle. Left: schematic representation of the nine sequences tested in the experiment
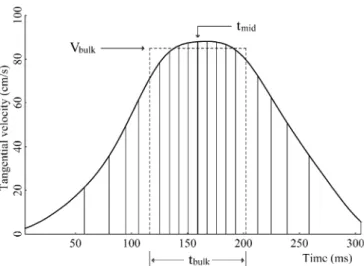
the x and y components of the error were positive if the final position was to the right of the target or further away, respectively). We also computed the time of occurrence of the maximal acceleration (tamax), maximal velocity (tvmax), and maximal decel-eration (tamin) with respect to movement onset. The average velocity Vavewas obtained by dividing the movement extent by its duration. We also considered three additional cinematic variables defined as follows (Fig. 2). tmidis the time for covering the first half of the trajectory. tbulk is the duration of the segment where most of the displacement is concentrated. This parameter was computed by considering all segments of the trajectory whose length was half of the total length and selecting the minimum value of the corresponding duration. The beginning and the end of the interval defining tbulk( dashed vertical lines in Fig.2) are not necessarily symmetrical instants with respect to tmid. Finally, Vbulk is the average velocity between these two instants. tbulk and Vbulk are robust estimates of movement duration and average velocity, which are insensitive to the sub-movements that are often present at the onset and at the end of the movement.
The average velocity profile across a set of trials was computed after a normalisation procedure. First, the velocity data for each trial was divided by the corresponding Vbulkand multiplied by the group-averaged Vbulk. Second, the duration of each trial was divided by the corresponding tbulk and multiplied by the group-averaged tbulk. Finally, we aligned all velocity profiles using tmidas a reference.
Results
Table 1 summarises the timing of the events during one-and two-step movements, both in RND one-and BLK sessions. The table also reports the peak values of the velocity (Vmax) during the first step. Movement times increased with the length of the steps. However, in keeping with the well-known phenomenon of isochrony, the increase was far less than proportional. The degree of isochrony, as measured by the exponent of the relation between the average velocity and the distance, was roughly equivalent for the two steps (exponent = 0.60). Instead, on average,
movement times were longer for the second than for the first step. Pause times were not significantly different across sessions (paired t -test, t8=−1.40, p =.19; in six out of nine participants times were longer in RND than in BLK sessions). In BLK sessions pause times increased slightly as a function of first step length, but the effect did not reach significance. This slight trend was absent in RND sessions. In the following, the results concerning RT and MT1 are analysed further in relation to the specific issues for which they are relevant.
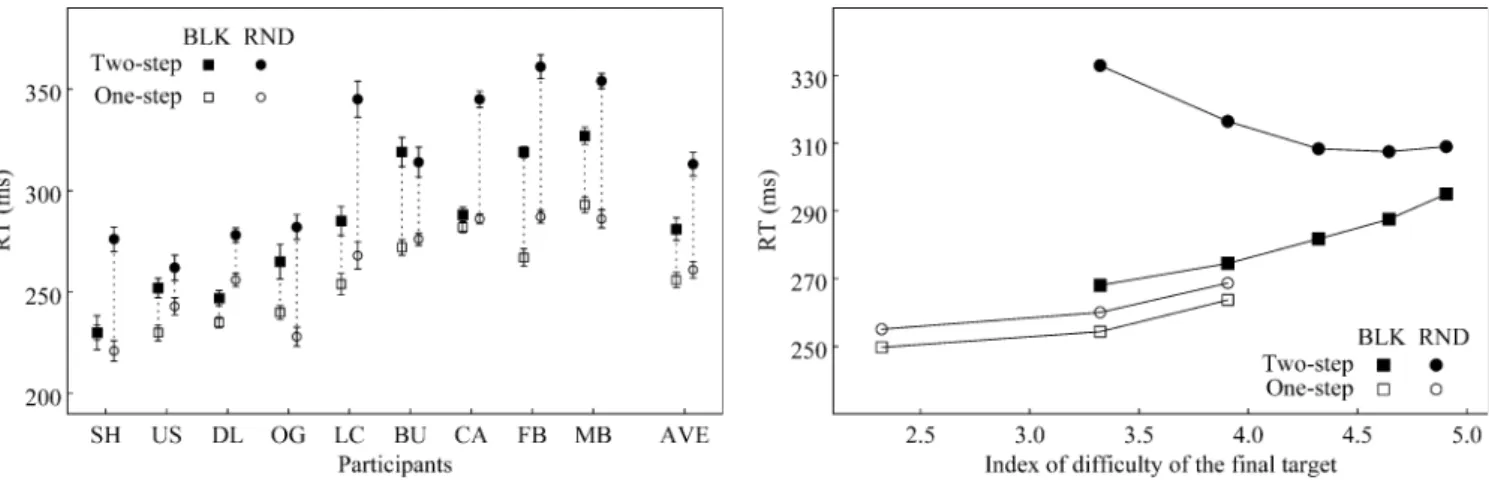
Reaction time, length effect, and movement difficulty Figure 3 shows the RTs for all participants in both one-(C1) and two-step (C2) conditions, and in both RND and BLK sessions. The results confirmed the presence of a length effect. The mean RT across sessions was longer for sequences (C2: 297 ms) than for single movements (C1: 259 ms, F(1,8)=53.29, p <.0001). In RND sessions the effect was significant in each participant. In BLK sessions the effect failed to reach significance in only two participants (SH and CA, p >.35). The difference between conditions was larger in RND sessions (52 ms) than in BLK sessions (25 ms, F(1,8)=10.87, p =.0109), and was Fig. 2 Definition of bulk time (tbulk) and bulk velocity (Vbulk).
Velocity profile of one trial ( thick line). The thin vertical lines divide the area under the velocity profile in 20 sectors with equal surface. The thick vertical line identifies the halfway time tmid. Bulk time is defined as the shortest time required to cover half of the path (distance between vertical dashed lines). Bulk velocity is the average velocity over this time interval (height of the vertical dashed lines). By definition, the surface of the dashed box is half of that under the velocity curve, which is equal to movement amplitude
Table 1 Reaction times ( RT), movement times of the first ( MT1) and second (MT2) step, pause time ( PT), and maximum velocity of the first step ( Vmax). In parenthesis the values for single-step trials (times: ms, velocity: cm/sec)
Blocked sessions L1/L2 RT MT1 PT MT2 Vmax 5/5 268 (244) 219 (199) 138 237 40.4 (50.5) 5/10 263 (254) 209 (206) 134 306 43.2 (49.8) 5/15 287 (251) 212 (203) 137 351 42.9 (49.3) 10/5 286 (255) 277 (278) 140 234 69.3 (74.2) 10/10 277 (252) 285 (277) 130 308 68.2 (71.2) 10/15 290 (256) 292 (278) 144 378 65.3 (71.9) 15/5 281 (260) 324 (325) 146 239 85.8 (90.7) 15/10 285 (262) 315 (315) 141 322 87.2 (93.9) 15/15 295 (269) 327 (333) 157 384 85.4 (92.0) Mean 281 (256) 273 (268) 141 306 65.3 (71.5) Random sessions L1/L2 RT MT1 PT MT2 Vmax 5/5 333 (255) 232 (230) 155 244 38.3 (43.1) 5/10 320 (253) 229 (224) 161 319 40.0 (44.2) 5/15 309 (257) 232 (222) 158 375 40.2 (42.5) 10/5 313 (258) 308 (303) 149 248 59.9 (65.0) 10/10 303 (260) 308 (299) 148 322 59.8 (66.8) 10/15 303 (262) 309 (302) 148 387 59.8 (65.2) 15/5 313 (265) 352 (325) 160 241 79.5 (88.3) 15/10 312 (269) 350 (329) 154 326 78.5 (87.7) 15/15 309 (272) 348 (329) 157 392 79.2 (88.5) Mean 313 (261) 296 (285) 155 317 59.5 (65.7)
significant for all participants (individual ANOVAs, F(1,138)>10 and p <.0002).
RT differences between one- (C1) and two-step (C2) movements (length effect) were not due to the fact that the final target in two-step sequences had a higher average index of difficulty (ID). This was demonstrated by a three-factor ([number of steps] × [trial order] × [ID]) ANOVA of the RT for one- and two-step movements ending on targets 2 or 3 (ID = 3.32 and 3.91, respectively). The first two factors had significant effects on RT, and their interaction was equally significant ( F(1,8)>28 and p <.001 for factors and interaction). Instead, neither the ID effect (F(1,8)=1.18, p >.30), nor any interaction involving ID ([number of steps] × [ID]: F(1,8)=4.48, p >.05; [trial order] × [ID]: F(1,8)=4.78, p >.05; [number of steps] × [trial order] × [ID]: F(1,8)=3.37, p >.10) were found to be significant. Note that the interactions involving ID barely missed significance not because RT tended to increase, but because it actually tended to decrease with ID (see below). A more articulate picture emerges by plotting RT as a function of ID separately for each condition and each session (Fig. 4). In condition C1 RT increased with ID in both BLK and RND sessions (ANOVA [trial order] × [ID], F(1,8)=22.94, p <.002 for ID factor; p >.20 and p >.75 for the trial order factor and for the interaction, respectively). In condition C2, there was the expected large difference between random and blocked sessions (average = 281 and 313 ms, respectively; F(1,8)=28.76, p <.001). More importantly, the ID had opposite effects in these two sessions. In fact, there was a significant interaction between the trial order and the ID factors ( F (1,8)=12.27, p =.008). The two opposite trends compensated almost perfectly because the effect of the ID factor was not significant when random and blocked sessions were pooled ( F (1,8)=0.04, p >.85).
For two-step movements, the structure of the sequence had an effect in RND, but not in BLK sessions. This is shown in Fig. 5where we plotted the population mean of
the difference between the RTs for each two-step move-ment and the RTs for the one-step movemove-ment driven by the same pair of stimuli. In BLK sessions (Fig.5a), neither the first ( F(1,8)=0.00, p >.95) nor the second ( F(1,8)=0.84, p >.35) step size had a significant effect. By contrast, in RND sessions (Fig. 5b), RT differences decreased with both the first ( F(1,8)=25.85, p <.001) and the second step size ( F(1,8)=5.82, p =.042). Additional tests showed that the quadratic contrast was significant for the first step size (F(1,8)=7.55, p <.025), but not for the second one (F(1,8)=0.04, p >.85). In summary, in RND sessions the additional time required to plan two-step sequences with respect to single movements (length effect) decreased with increasing ID of the final target. This rather counter-intuitive result suggests that larger (and, therefore, longer) movements can be initiated before their planning has been completed, using part of the movement time to do so. Fig. 3 Reaction times ( RT). Abscissa: the nine participants
(initials) ranked in increasing order of their average RT. AVE group averages. Ordinate: averages within conditions and sessions. Whiskers encompass two standard deviations of the mean. In RND sessions, RTs for two-step sequences were consistently longer than those for single movements
Fig. 5a, b Difference between RTs in condition C1(one-step) and C2(two-step). Differences are plotted as a function of the second step size in BLK ( a) and RND ( b) sessions. Differences in RND sessions were larger than in BLK sessions and decreased with both the first and second step size
Fig. 4 RT as a function of the index of difficulty (ID). Note the large, ID-dependent difference between RT in BLK and RND sessions in two-step sequences
Movement times, context effect, and one-target advantage
As specified in the introduction, we distinguish the effects of the kinematics of the first step that are due to the characteristics of the second step (context effect) from the effects due to the mere existence of a second step. As a first attempt to detect an interaction between the two steps, we tested whether the duration of the first movement (MT1) depends on the size of the second step. We found no evidence of such an effect. Averaged across sessions and participants, MT1 in condition C2 amounted to 285, 283, and 287 ms when the second step was 5, 10, and 15 cm long, respectively (tbulk 88, 88, and 89 ms, respectively). The absence of context effect was confirmed by the results of a three-factor ANOVA of MT1 (Table2). Neither the linear contrast of the second target distance nor its interactions with trial order and number of steps were significant. The context effect was generally absent in individual performances. We also tested the so-called “one-target advantage” hypothesis that movement times are shorter when movements are performed alone rather than in a sequence. The difference in MT1 was small (9 ms) and non significant. However, a significant difference (83.0 and 88.1 ms for one- and two-step movements, respectively) emerged when considering the more robust estimate tbulk (Table 2). The only other significant effect on movement duration was whether trials were blocked (MT1 = 271 ms, tbulk = 82.2 ms) or randomised (MT1 = 291 ms, tbulk= 88.9 ms).
Intra-sequence correlations
In two-step sequences, correlations between the kinemat-ics in the first and second movement are generally taken to suggest an interaction between the planning and/or execution of the steps. We tested the presence of such correlations by using the cinematic parameter Vbulk defined in the Method section, which is more robust than either the maximum or the average velocity. The first two columns in Table3report the Vbulklinear correlation coefficients for each sequence and both sessions (averaged across participants). Among the 81 individual correlations (9 [participant] × 9 [sequence]), only three in RND
sessions, and none in BLK sessions were significant (.05 level, corrected for multiple comparisons). However, two features of the results suggested the need of a more detailed analysis before drawing a conclusion: 1) the correlation coefficients in RND sessions were all positive and uniformly higher than in BLK sessions; 2) the correlation coefficients appeared to increase with the total extent of the movements.
As for point 1 above, we recall that in RND sessions the repetitions for a given sequence were spread all along the duration of the experiment, whereas in BLK sessions, they were all concentrated within a short period. Thus, a drift of the average velocity in the course of the experiment might have generated a spurious positive correlation in the former but not in the latter case. The presence of such an artefact was tested by correlating normalised Vbulkvalues for pairs of successive trials (serial correlation). In RND sessions, the serial correlation ranged from .034 to .484 across participants (population average: .270) for the first step, and from−.070 to .489 (population average: .267) for the second step. By contrast, about 70% of the correlations in BLK sessions were negative (population averages were equal to −.077 and −.060 for the first and second step, respectively). The hypothesis that correlations in random sessions were inflated because velocity drifted in the course of the session is illustrated by the data in Fig. 6
from one participant with typical serial correlations (.247 and .394 for the first and second step, respectively). The figure plots Vbulkvalues normalised to the average for all similar sequences as a function of the trial rank number (the continuous lines are spline interpolation of the data points). Clearly, the velocity increased in fairly similar fashion in the first and second step.
To quantify the importance of the velocity and duration drift, we divided every random experimental session of 108 trials into 12 groups of nine consecutive trials (each comprising exactly one token of each sequence). Then we carried out individual [sequence] × [group] analyses of variance of Vbulk and tbulk in the first and second component of sequence trials. As expected, the sequence factor was significant for all participants and all components (all p <.0001), and it explained on average 89% of Vbulkvariance (70% for tbulk). More interestingly, the group factor had a significant effect on Vbulkin both
Table 2 ANOVA results on context effect and one-target advantage
MT1 tbulk
Factors F p F p
Second step size 0.36 .566 0.26 .623
Trial order 6.55 .034 7.19 .028
Number of steps 2.47 .155 5.46 .048
Second step size × trial order 3.97 .082 1.90 .205
Second step size × number of steps 0.00 .999 0.05 .835
Trial order × number of steps 0.48 .509 0.67 .435
Triple interaction 0.01 .911 0.02 .892
Table 3 First and second col-umn: correlations between nor-malised bulk velocity of the first and second step computed in blocked (BLK) and random (RND) sessions with actual data. Third column: correlations for RND sessions computed after correcting for the slow velocity drift. Results averaged across participants Target pair Vbulk BLK Vbulk RND Corr. V bulkRND 1 −.103 .152 −.025 2 −.102 .121 −.100 3 .021 .350 .151 4 .078 .270 .202 5 .011 .312 .135 6 .279 .464 .247 7 .236 .343 .188 8 .009 .197 .167 9 .253 .428 .262 Mean .076 .293 .136
the first and second component for seven participants, and no effect in the data of the two remaining participants (the results for tbulk were similar except for one subject in which the effect on the first component did not reach the .05 threshold). On average, the group factor explained 32.1% and 33.8% of the residual variance of Vbulk and tbulk, respectively. The average percent explained for Vbulk (32.1%) is similar to that of the data shown in Fig. 6
(24.7% and 37.5% in the first and second components, respectively).
In order to remove the influence of velocity drift in RND sessions, we recomputed the correlations between Vbulkin the first and second step after dividing both values by the spline interpolations shown in Fig.6. As expected, the new correlations (rightmost column in Table 3) were smaller than those computed on uncorrected velocities. Moreover, none of the individual correlations reached significance. As for point 2 above, a tendency for correlations to increase with the total extent of the movement was still present after eliminating the effect of the velocity drift, but was not statistically significant (F(1,8)=4.2, p =0.074). In summary, the analysis of the intra-sequence correlation of velocity did not provide any evidence of interaction between the planning or execution of the two steps.
Velocity profiles and cinematic landmarks
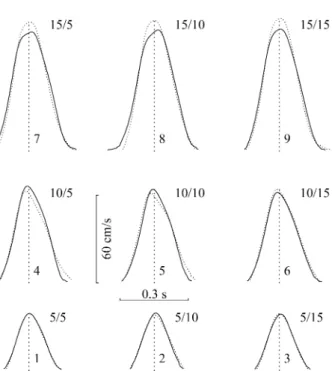
We explored whether the velocity profile of the first step was modified by the presence of a second step. The main finding was that the velocity of the first step was different in condition C1and C2, but the difference was independent of the size of the second step. This is illustrated in Fig.7
by the average profiles of a typical subject (US) for all possible sequences in a RND session. Differences between velocity profiles were quantified by analysing four tem-poral landmarks, namely the times to maximal
accelera-tion, maximal velocity, and maximal deceleraaccelera-tion, as well as the stop time. In the left panel of Fig.8are shown the four landmarks averaged over step lengths and partici-pants. All landmarks were shifted in RND sessions with respect to BLK sessions, and also in the two-step condition with respect to the one-step condition (compare dotted and continuous lines), reflecting the fact that MT1 was longer in the former case. More importantly, the presence of a second step altered the temporal structures of the velocity profiles. In particular, the shift of the maximum deceleration time was larger than the shift of the stop time. This is shown in the right panel of Fig. 8
where landmarks were normalised with respect to MT1, averaged over sessions, and plotted as a function of the size of the second step.
We performed a three-factor ANOVA ([second-step size] × [trial order] × [number of steps]) of each time interval between normalised landmarks. The number of steps had a significant effect on the interval from maximal acceleration to maximal velocity ( F(1,8)=24.73, p <.002), and on the interval from maximal deceleration to move-ment outset ( F(1,8)=14.16, p <.006). No other factor had a Fig. 7 Average velocity profiles in the random session. Data from one typical participant ( US). The figure compares the velocity of the first step in one- ( dotted lines) and two-step movements (continuous lines). Profile were computed by averaging the 12 normalised velocities for trials with the same pair of stimuli (sequences identified as in Fig. 1). Profiles were normalised by modifying the x and y scales so as to make the tbulkand Vbulkof each trial equal to the respective averages over all trials with the same pair of stimuli. The curves were aligned by superposing the lines ( dashed) that divide evenly the surfaces under the curves. Profiles depended on both the first (5 cm: 1–3; 10 cm: 4–6; 15 cm: 7–9) and the second step size (5 cm: 1, 4, 7; 10 cm: 2, 5, 8; 15 cm: 3, 6, 9). Note that differences between one- and two-step trials (e.g. peak velocity) depended on the first ( rows), but not on the second step size (columns)
Fig. 6 Drift of bulk velocity during the two-step condition in a typical random session. The relative velocity ratio of a movement (ordinate) is defined as the bulk velocity divided by the average bulk velocity of the corresponding movements in the 12 repetitions of the same sequence. Continuous lines: spline interpolation of the data points. A concurrent velocity drift in the first and second step induced a spurious correlation
significant effect on any of the time intervals, and there was no significant interaction. Although movements were faster in BLK than in RND sessions, the ratios of the intervals between landmarks remained constant (in all cases F(1,8)<0.11, p >.75 for the trial order factor).
Spatial accuracy
We investigated whether the constant and variable components of the spatial error at the first target differed between one- and two-step trials, and whether they depended on the size of the second step. First, we performed a four-factor ANOVA of the horizontal and vertical components of the spatial error, using as factors the number of steps, the trial order, and the size of the steps. There were three significant results: 1) in BLK sessions, the final position drifted towards the left when the size of the first step increased from 5 to 15 cm (drift: 1.3 mm; [first-step size]: F(1,8)=23.53, p =.0013; interac-tion with [trial order]: F(1,8)=29.87, p =.0006); 2) for both one- and two-step trials the final position drifted towards the starting position when the first step size increased from 5 to 15 cm (range effect, drift: 1.3 mm; F(1,8)=11.21, p =.0101); 3) the final position was more distal for one- than for two-step movements (difference: 1.4 mm; F(1,8)=17.94,
p =.0029). These effects are summarised in the lower panel of Fig. 9 by the average final position for one-(empty symbols) and two-step ( filled symbols) trials. Note that the sagittal shift of the average position between the two conditions was independent of either step size.
As for the variable errors, we computed the 324 confidence ellipses corresponding to all combinations of 9 [participant] × 9 [sequence] × 2 [number of steps] × 2 [trial order]. The orientation of the 192 more elongated ellipses (major semi-axis at least twice as long as the minor semi-axis) were all comprised in the interval [−49deg, +47 deg] centred on the sagittal direction. In addition, the proportion of elongated ellipses was fairly constant across participants (range: 17/36 to 27/36), condition (96/162 for both), and sessions (106 and 86/162 for BLK and RND sessions, respectively). Finally, because the size of the major semi-axis was also fairly Fig. 9 Confidence ellipses for pointing errors (sequences identified as in Fig. 1). Results pooled over participants and sessions. Lower panel: Data for the first target. Dotted and continuous ellipses are relative to one- and two-step trials, respectively. Upper panel: Data for the second target. Numbers on the upper left side of each ellipse indicate the distance of the first and second target, respectively (in one-step trials, the appearance of the second target was the“Go” signal). Ellipses were scaled so that the final position of a trial has the same probability to be within the ellipse (about 0.46) than to have simultaneously both coordinates within one standard error from their mean if these coordinates were independent Gaussian variables
Fig. 8a, b Effect of number of steps, trial order and second-step size on temporal landmarks. Population averages for the first step in a sequence of two ( filled circles), and for the same step executed in isolation ( empty circles). a Time of occurrence of peak acceleration, peak velocity, peak deceleration, and final stop (data averaged over step size). In RND sessions all temporal landmarks were shifted forward with respect to BLK sessions. b The same temporal landmarks shown in a averaged over the indicated second-step size and normalised to the total MT (data averaged over sessions). The temporal structure of the movement depends on the number of steps, but not on the second step size
constant across participants, we ipsitised the individual data to obtain the 18 confidence ellipses in the lower panel of Fig. 9. The transversal variability increased with the first step size ( F(1,8)=45.70, p <.0001), and was higher for one-step than for two-step movements (F(1,8)=5.47, p =.0476). By contrast, the sagittal variability increased with the first step size only for one-step movements ([first-step size]: F(1,8)=4.23, p >.05; [number of steps]: F(1,8)=1.76, p >.30; interaction: F(1,8)=6.85, p =.0308). Also, there was no effect of the session, and of the second step size.
The analogous results for the final accuracy in the case of two-step sequences are shown in the upper panel of Fig. 9. Globally, overshoots dominated especially for sequences with a first step longer that the second step. Comparing the corresponding filled data points in the two panels of Fig.9shows a tendency to over-compensate the undershoots of the first steps. Finally, Fig. 10 illustrates the motor behaviour in trials that were rejected because either the first ( lower panel), or the second target ( upper panel) was missed. Notice that in almost all cases, targets were missed because of amplitude errors, whereas
directional errors remained small. For two-step sequences ( filled circles), the predominance of undershooting in the first step and overshooting in the second step is consistent with the final positions of valid trials (Fig.9). These biases suggest that undershoots in the first step result from a general strategy for minimising the risk of overshooting the second target. In summary, the analyses of the constant and variable errors confirmed the conclusions from the study of the velocity profiles, i.e. a significant effect of the presence of a second step, but no effect of the size of the second step.
Discussion
The experiment tested the hypothesis that short sequences of similar movements are generally planned as a whole, before the inception of the movement. Context effects— i.e. variations in the kinematics of one step that depend on the properties of subsequent steps—are supposed to be a characteristic feature of movement sequences planned with a holistic strategy. Thus, we begin by discussing the results concerning this point.
Context effect
Several characteristics of the first step were modified when the task required a second movement. On average, the duration of the first step in a sequence of two was 9 ms longer than that of a single step. The temporal structure of the first step was also changed by a reduction of the interval between the point of maximum deceleration and the end of the movement (Fig.8). Finally, the end-point of the first step drifted toward the body (Fig.9). However, all these changes were independent of the size of the second step. In other words, we did not find any evidence of a context effect in the restricted sense of the term adopted here.
Biomechanical factors could be one reason for the discrepancy between these results and those reported in the literature. Context effects were observed in drawing line segments with acute angles (Rand and Stelmach 2000; Rand et al. 1997; Weiss et al. 1997), and in those tasks where reaching a target (Short et al.1996; Sidaway1991; Sidaway et al.1995) or picking up an object (Gentilucci et al. 1997; Marteniuk et al. 1987) implied either a sharp change in direction, or an impact on a surface. In all these cases the initiation of one step may be facilitated by a timely use of the elastic energy stored in the muscles while braking the previous step (Guiard1993, see also Adam et al.1993; Meulenbroek and Thomassen1993). Indeed, the extension component of an elbow extension-flexion sequence between two targets produces a different EMG activity (Lajoie and Franks 1997; Savelberg et al. 2002), and may be made faster than a ballistic extension between the same targets (Adam et al.1993,1995). These dynamic factors, which have to be reckoned when generating a sequence of movements, may account for the backward Fig. 10 Error distributions for rejected trials (sequences identified
as in Fig. 1). Final position for all trials that were rejected because either the first ( lower panel) or the second target ( upper panel) was missed. Empty and filled symbols are relative to one- and two-step trials, respectively. Small dots in the upper panel show the (correct) intermediate positions on the first target. In almost all cases, targets were missed because of amplitude rather than directional errors
influence of later segments on earlier ones (Adam et al.
1995). Our task minimised all these potential sources of biomechanical effects: 1) targets were reached by sliding along a surface (no impact); 2) movements were towards increasingly distal targets, rather than back and forth movements; and 3) the end of the first movement had to be marked by a clear stop (more than 20 ms at a speed less than 2 cm/s). In fact, pause times (cf. Table 1) were considerably longer than those reported previously (e.g. Table 2in Adam et al.2000).
Biomechanical couplings, however, are not a necessary condition for context effects to arise because these effects are also well documented in tasks such as Morse coding (Bryan and Harter 1897, 1899), typing (Terzuolo and Viviani 1980; Viviani and Laissard 1996) and piano playing (Engel et al.1997), where the moving masses are far smaller than in arm movements. In all these cases, holistic planning, and the associated context-dependent modulation of the kinematics of the movement, is likely to be the consequence of the fact that the motor sequences are used to convey a message that has its own structure. This was not the case of our sequences. It should also be stressed that Morse coding, typing and piano playing all involve very fast movements and require extensive training. Instead, our task did not impose stringent temporal constraints, and did not require any significant training. In conclusion, the absence of context effects in our task suggests that holistic planning is a strategy that is adopted only in response to specific circumstances. Very simple sequences do not necessarily lead to the adoption of such a strategy, even when information for planning the movement is fully available in advance, as in the blocked sessions of our experiment.
Intra-sequence correlation of velocity
Some authors (e.g. Viviani and Laissard1996; Weiss et al.
1997) have argued that evidence of holistic planning can be obtained by showing that corresponding cinematic parameters are correlated across the steps of a sequence. In RND sessions (but not in BLK sessions) we did find significant correlations between the velocities of the first and second step (Table3). However, because the average movement velocity drifted in the course of the session (Fig.6), we suspected these correlations to be an artefact. Indeed, after eliminating the long-term velocity drift, correlations in random sessions became as small as in blocked sessions. These drifts are not uncommon (e.g. Vindras and Viviani1998). Thus, one cannot exclude that they are responsible also for some of the correlations reported previously (Weiss et al.1997). In conclusion, also the analysis of the cinematic parameters failed to support the hypothesis that sequences were planned as a whole.
One-target advantage
As remarked above, movement time for the first step was shorter in one-step than in two-step trials—the so-called one-target advantage (Adam et al.1993,2000; Chamberlin and Magill 1989; Christina and Rose1985; Helsen et al.
2001; Lavrysen et al.2002,2003). To explain this effect, it has been suggested that the first target has a different status depending on whether it is the final one or a via-point on the way to a second target. Specifically, during the approach phase to the first target, the limb would be more restrained in the second than in the first case (Christina and Rose1985; Fischman and Reeve1992). In fact, we did find a marginal reduction of the spread of the landing points on the intermediate target when this target was the initial point for a second step (Fig.9, see below). However, the timing data do not support the hypothesis that moving both rapidly and accurately calls for a more energetic restraint of the limb as it approaches the intermediate target. Indeed, within the first step, the last interval between cinematic landmarks (from peak decel-eration to the stop) was the only one that was not lengthened when a second step had to be executed (it was even significantly shortened). This finding calls for alternative accounts of the one-target advantage. One idea, supported by several studies (Burton 1987; Cham-berlin and Magill 1989; Klapp and Wyatt 1976; Norrie
1974; Rosenbaum et al. 1984, 1987), is that movement duration increases because some computational resources during the execution of the first step are engaged for programming later steps. The idea has been specified further by Adam et al. (2000) who suggest that the interference arises at the implementation rather than at the planning level (movement integration hypothesis). Still another possibility is that the lengthening of the first step results instead from a different planning strategy for one-and two-step movements (Lavrysen et al. 2002). Specifi-cally, it is possible that the first step is lengthened intentionally in order to secure a more stable and predictable initial condition for the second step. This shift of emphasis from the implementation to the planning phase is in keeping with the interpretation of the RT data to be discussed next.
Reaction time, length effect, and movement difficulty Both in RND and BLK sessions, the presence of a second step increased the RT by 52 and 25 ms, respectively, much more than in similar experimental conditions. In a simple reaction time task, Fischman (1984) measured an increase of 9 ms between one- and two-step sequences. The targets in that study were larger (6 cm in diameter) than ours (2 cm) and, on average, placed at the same distance (10 cm). Moreover, the average velocity was twice as high as those we observed. Thus, the unusually large effect of the number of steps in BLK sessions could be the indirect consequence of the stronger accuracy demands, through the well-known negative relation between average velocity
and RT (Falkenberg and Newell 1980). However, this hypothesis cannot account for the additional RT increase induced by the randomised schedule (52 ms − 25 ms = 27 ms).
The reason why RT is longer in two-step than in one-step sequences is debatable. Sidaway (1991) took issue with the notion that the number of steps per se is the decisive factor. Instead, he suggested a direct role of the constraints that the task places on directional accuracy, which he defined as the smallest angle subtended by the targets to be reached, as measured from the initial position. His results showed that this angle had a more powerful effect on RT than the number of movements in the sequence, suggesting that a more complex—and therefore more time consuming—plan has to be set up when the final target has a smaller angular extent. Our data did not confirm fully this view. As shown in Fig.4, RTs for single movements toward the 15-cm target (subtended angle = 0.13 radians) were shorter than RTs for two-step sequences with a final position at 10 cm (subtended angle = 0.20 radians; RT differences = −4 and −64 ms, t =−0.58 and t =−5.12, p >.50 and p <.001 with paired Student tests for BLK and RND sessions, respectively). In addition, statistical analysis showed that RT differences between one- and two-step movements either decrease (random schedule) or remain constant (blocked schedule) with the second step size (see Fig.5), whereas they should increase if planning time was positively correlated with the required directional accuracy (Sidaway 1991).
An alternative hypothesis to account for the large and ID-dependent effect on RT of the number of steps in RND sessions is that movement programming and control is completed after movement onset (Ghez et al. 1997; Pélisson et al. 1986; cf. also the so-called “cascade model”, McClelland 1979). The hypothesis that we are entertaining calls for a distinction between a planning phase, in which the major cinematic parameters of the two steps are evaluated on the basis of visual information, and a fine tuning phase, which updates the parameters on the basis of the ongoing movement. The fact that the velocity of the first step increases very regularly as a function of its length—the so-called isochrony phenomenon—strongly suggests that the planning of the first step is achieved before movement onset. Moreover, because the initial conditions of the movement (i.e. the hand position and the state of the neuromuscular system) are fully specified in advance, the amount of fine tuning required after move-ment onset is likely to be small. In keeping with the piece-wise planning hypothesis suggested by the absence of context effects, we assume that also the second step begins to be planned during the RT. However, this phase continues after movement onset, overlapping partially with the execution of the first step. In addition, a more extensive fine tuning is likely to be required for the second than for the first step because the initial conditions for the second movement are more variable. By necessity, this fine-tuning phase can only begin after the onset of the second movement. The key assumption upon which our line of reasoning rests is that both the planning of the
second step, and the associated fine-tuning phase must be completed a fixed time before the onset and the end of the second movement, respectively. Thus, if the duration of the second step is too short to accommodate an extensive tuning phase, the advance planning phase must be more refined, and therefore longer. Likewise, if the required planning becomes too long relative to the duration of the first step, an increasing portion of the plan must take place before movement onset, which results into an increased RT. Note that the amount of second step planning that spills over the execution of the first step does not interfere with its duration, which, as argued above, is likely to be specified during the RT.
This tentative explanation fits nicely with the results in Fig.5, showing that when the first step is short (231 ms for 5-cm first target, dotted line), the additional time required to prepare the second step is quite large (on average, 66 ms), implying that most of the planning for the second step precedes movement onset. As the execution of the first step gets longer (308 and 350 ms for intermediate targets at 10 and 15 cm, respectively), an increasing amount of planning can take place after movement onset. Moreover, the additional time required to prepare the second step decreases (by 18 ms) when the second step increases from 5 to 15 cm, suggesting that because the longest movement provides sufficient time for an extensive tuning, the planning phase need not to be too accurate. Therefore, it can be completed within MT1, without extending the RT.
In BLK sessions the presence of a second step produced a smaller increase of the RT than in RND sessions. More importantly, there was no differential step-size effect. Both these findings are congruent with the explanation suggested above. On the one side, the additional burden of planning two movements rather than one is alleviated by the fact that in the BLK schedule the processing of visual information is strongly simplified. On the other hand, repeating over and over the same sequence may simply require the retrieval of memorised plans, and is also likely to reduce the uncertainty about the initial conditions for the second step. Thus, even in the case of the shortest sequences, there would always be sufficient time to complete the required controls, without increasing the RT.
The hypothesis that some phases of the control of movement may extend after movement initiation has received independent support from studies of hand movement sequences (Sidaway et al. 1999; Smiley-Oyen and Worringham1996), finger tapping (Piek et al.1993, Rosenbaum et al. 1987), typewriting (Brown and Carr
1989), and handwriting (Hulstijn and van Galen1983). In particular, Rosenbaum found that the RT to begin a sequence of rapid finger movements decreased with the length of the sequence under some choice conditions. He argued that a continuous processing mode would be not only a way to avoid saturation of a memory buffer when a long sequence has to be made, or when time has to be saved in performing a movement, but also a synchronising
strategy to succeed in making an initially uncertain movement sequence (Rosenbaum et al.1987).
Spatial errors and the accuracy constraints effect
The distribution of the spatial errors confirmed the pattern emerging from the analysis of the time data. The mere presence of a second target modified the distribution of the errors on the first target, but the distance of the second target had no specific effect. With respect to the final position in one-step trials, the intermediate position in two-step sequences was closer to the starting position, and less variable (Fig. 9). In addition, there were more trials rejected for undershooting. We suggest that all three differences have a common origin, namely the attempt to reduce the risk of missing the second target. In fact, the reduction of the sagittal variability emerged only when the first target was most distant, i.e. the condition in which the probability of over-reaching the second target was highest (Fig. 10). Likewise, the tendency to undershoot the first target—which is clear for the two largest first step sizes— may be interpreted as an attempt to compensate for the excessive amplitude of the second movement, which, for sequences with a second step smaller than the first one, is responsible both for the constant error in valid trials (Fig.9), and for most of the rejected trials (Fig.10).
In a study that shared several features with ours, the constant and variable errors on the first target were found to depend on the directional accuracy constraints imposed by the second target (Sidaway et al. 1995). Specifically, when the size of the second target was reduced, the contact positions on the first target were less dispersed and were on average closer to the second target. We did not confirm these findings. When the directional accuracy demands increased, along with the second target distance, both constant and variable errors with respect to the centre of the first target remained almost constant. Moreover, the analysis of the rejected trials (Fig. 10) confirmed that errors affected mostly the amplitude, rather than the direction of the movements.
The analysis of the variability is consistent with the idea that the intermediate point is more spatially constrained when it is the initial point for a second step than in the one-step condition. However, as argued before, this does not imply that the movement has a more constrained kinematics as it approaches the intermediate target. Finally, the fact that in two-step sequences the spatial variability increased only with the size of the first step, but was unaffected by the size of the second step, is further evidence against the hypothesis that sequences are planned as a whole.
Concluding remarks
Taken together, the results of the experiment do not support the view that holistic planning is the default solution for any fast and short motor sequences. Instead,
experimental evidence is compatible with the hypothesis that an on-line planning strategy is an available option even when executing the simplest sequence composed of just two steps. We have already mentioned above two factors that may be relevant in the selection of these two competing planning strategies, namely the intervention of biomechanical factors and the fact that the motor sequences are related to an underlying code. To conclude, we would like to suggest that the ultimate reason why the holistic strategy is abandoned in favour of the more conservative on-line strategy has to do with the accuracy with which the motor control system is able to specify the initial conditions for each successive step, which include time, position, velocity and muscle tension information. Indeed, in most circumstances where context effects provide convincing evidence of holistic planning, the required accurate specification is secured either by extensive training or by confirmatory sensory inputs. For example, in all musical performances proficiency requires years of training. Moreover, tactile inputs are likely to provide both a confirmatory clue that one step is accomplished successfully, and a triggering signal for the release of impending commands. Instead, in the vast majority of everyday gestures one cannot assume that the initial conditions are well defined. In all these cases, it seems logical that the planning of one component cannot be finalised until the execution of the previous component has provided a sufficiently reliable prediction on its own initial conditions. If our conclusion is correct, caution is in order before making the inference that a lack of context effects in neurological patients is evidence of an impaired planning ability (Rand et al.2002; Weiss et al. 1997). In fact, the deficit could well concern the ability to secure reliable proprioceptive information, or to execute a motor plan with a predictable timing, rather the mechanisms that use this information to set up the plan.
Acknowledgements This research was supported by FNRS (Swiss National Research Fund) Grant 31-55620.98 to P.V.
References
Adam JJ, Van der Bruggen DPW, Bekkering H (1993) The control of discrete and reciprocal target-aiming responses: Evidence for the exploitation of mechanics. Hum Mov Sci 12:353–364 Adam JJ, Paas FGWC, Eyssen ICJM, Slingerland H, Bekkering H,
Drost M (1995) The control of two-element, reciprocal aiming movements: evidence for chunking. Hum Mov Sci 14:1–11 Adam JJ, Nieuwenstein J, Huys R, Paas F, Kingma H, Willems P,
Werry M (2000) Control of rapid aimed hand movements: the one-target advantage. J Exp Psychol Hum Percept Perform 26:295–312
Brown TL, Carr TH (1989) Automaticity in skill acquisition: mechanisms for reducing interference in concurrent perfor-mance. J Exp Psychol Hum Percept Perform 15:686–700 Bryan WL, Harter N (1897) Studies in the physiology and
psychology of the telegraphic language. Psychol Rev 4:27–53 Bryan WL, Harter N (1899) Studies on the telegraphic language. The acquisition of a hierarchy of habits. Psychol Rev 6:345– 375
Burton AW (1987) The effect of number of movement components on response time in children. J Hum Mov Stud 13:231–247 Chamberlin CJ, Magill RA (1989) Preparation and control of rapid,
multisegmented responses in simple and choice environments. Res Q Exerc Sport 60:256–267
Christina RW, Rose DJ (1985) Premotor and motor reaction time as a function of response complexity. Res Q Exerc Sport 56:306– 315
Engel KC, Flanders M, Soechting JF (1997) Anticipatory and sequential motor control in piano playing. Exp Brain Res 113:189–199
Falkenberg LE, Newell KM (1980) Relative contribution of movement time, amplitude, and velocity to response initiation. J Exp Psychol Hum Percept Perform 6:760–768
Fischman MG (1984) Programming time as a function of number of movements parts and changes in movement direction. J Mot Behav 16:405–423
Fischman MG, Reeve TG (1992) Slower movement times may not necessarily imply on-line programming. J Hum Mov Stud 22:131–144
Fitts P (1954) The information capacity of the human motor system in controlling amplitude of movement. J Exp Psychol 47:381– 391
Gentilucci M, Negrotti A, Gangitano M (1997) Planning an action. Exp Brain Res 115:116–128
Ghez C, Favilla M, Ghilardi MF, Gordon J, Bermejo J, Pullman S (1997) Discrete and continuous planning of hand movements and isometric force trajectories. Exp Brain Res 115:217–233 Guiard Y (1993) On Fitt’s and Hooke’s laws: simple harmonic
movement in upper-limb cyclical aiming. Acta Psychol 82:139–159
Hardcastle WJ, Hewlett N (1999) Coarticulation. Theory, Data and Techniques. Cambridge University Press, Cambridge
Helsen WF, Adam JJ, Elliott D, Buekers MJ (2001) The one-target advantage: a test of the movement integration hypothesis. Hum Mov Sci 20:643–674
Henry FM, Rogers DE (1960) Increased response latency for complicated movements and a “memory drum” theory of neuromotor reaction. Res Q 31:448–458
Hulstijn W, van Galen GP (1983) Programming in hand-writing: reaction time and movement time as a function of sequence length. Acta Psychol 54:23–49
Keele SW (1981) Behavioral analysis of movement. In: Brooks VB (ed) Handbook of physiology, Section 1: the nervous system, vol 2: Motor control. Williams and Wilkins, Baltimore, pp 1391–1414
Klapp ST, Wyatt EP (1976) Motor programming within a sequence of responses. J Mot Behav 8:19–26
Klapp ST, Anderson WG, Berrian RW (1973) Implicit speech in reading, reconsidered. J Exp Psychol 100:368–374
Klapp ST, Wyatt EP, Lingo WM (1974) Response programming in simple and choice reactions. J Mot Behav 6:263–271 Lajoie JM, Franks IM (1997) The control of rapid aiming
movements: variation in response accuracy and complexity. Acta Psychol 97:289–305
Lavrysen A, Helsen WF, Elliott DJ, Adam JJ (2002) The one-target advantage: advance preparation or online processing? Motor Control 6:230–245
Lavrysen A, Helsen WF, Tremblay L, Elliott D, Adam JJ, Feys P, Buekers MJ (2003) The control of sequential aiming move-ments: the influence of practice and manual asymmetries on the one-target advantage. Cortex 39:307–325
Marteniuk RG, MacKenzie CL, Jeannerod M, Athenes S, Ducas C (1987) Constraints on human arm movement trajectories. Can J Psychol 41:365–378
McClelland JL (1979) On the time relations of mental processes: an examination of systems of processes in cascade. Psychol Rev 86:287–330
Meulenbroek RGJ, Thomassen AJWM (1993) Exploitation of elasticity as a biomechanical property in the production of graphic stroke sequences. Acta Psychol 82:313–327
Norrie ML (1974) Effects of movement complexity on choice reaction and movement times. Res Q 45:154–161
Pélisson D, Prablanc C, Goodale MA, Jeannerod M (1986) Visual control of reaching movements without vision of the limb. II. Evidence of fast unconscious processes correcting the trajectory of the hand to the final position of a double-step stimulus. Exp Brain Res 62:303–311
Piek JP, Glencross DJ, Barrett NC, Love GL (1993) The effect of temporal and force changes on the patterning of sequential movements. Psychol Res 55:116–123
Rabiner LR, Gold R (1975) Theory and application of digital signal processing. Prentice-Hall, Englewood Cliffs
Rand MK, Stelmach GE (2000) Segment interdependency and difficulty in two-stroke sequences. Exp Brain Res 134:228–236 Rand MK, Alberts JL, Stelmach GE, Bloedel JR (1997) The influence of movement segment difficulty on movements with two-stroke sequence. Exp Brain Res 115:137–146
Rand MK, van Gemmert AWA, Stelmach GE (2002) Segment difficulty in two-stroke movements in patients with Parkinson’s disease. Exp Brain Res 143:383–393
Rosenbaum DA (1991) Human motor control. Academic Press, San Diego
Rosenbaum DA, Inhoff AW, Gordon AM (1984) Choosing between movement sequences: a hierarchical editor model. J Exp Psychol Gen 113:372–393
Rosenbaum DA, Hindorff V, Munro EM (1987) Scheduling and programming of rapid finger sequences: tests and elaborations of the hierarchical editor model. J Exp Psychol Hum Percept Perform 13:193–203
Savelberg HHCM, Adam JJ, Verhaegh RHJ, Helsen WF (2002) Electromyographic pattern in fast goal-directed arm move-ments. J Hum Mov Stud 43:121–133
Short MW, Fischman MG, Wang YT (1996) Cinematographical analysis of movement pathway constraints in rapid target-striking task. J Mot Behav 28:157–168
Sidaway B (1991) Motor programming as a function of constraints on movement initiation. J Mot Behav 23:120–130
Sidaway B, Sekiya H, Fairweather M (1995) Movement variability as a function of accuracy demand in programmed serial aiming responses. J Mot Behav 27:67–76
Sidaway B, Yook D, Russell D (1999) Distributed control in rapid sequential aiming responses. J Mot Behav 31:367–379 Smiley-Oyen AL, Worringham CJ (1996) Distribution of
program-ming in a rapid sequential movement. Q J Exp Psychol 49A: 379–397
Sternberg S, Monsell S, Knoll RL, Wright CE (1978) The latency and duration of rapid movement sequence: comparison of speech and typewriting. In: Stelmach GE (ed) Information processing in motor control and learning. Academic Press, New-York, pp 117–152
Sternberg S, Wright CE, Knoll RL, Monsell S (1980) Motor programs in rapid speech: additional evidence. In: Cole RA (ed) Perception and production of fluent speech. Erlbaum, Hillsdale, NJ
Terzuolo CA, Viviani P (1980) Determinants and characteristics of motor patterns used for typing. Neuroscience 5:1085–1103 Vindras P, Viviani P (1998) Frames of reference and control
parameters in visuo-manual pointing. J Exp Psychol Hum Percept Perform 24:569–591
Viviani P, Laissard G (1996) Motor templates in typing. J Exp Psychol Hum Percept Perform 22:417–445
Weiss P, Stelmach GE, Hefter H (1997) Programming of a movement sequence in Parkinson’s disease. Brain 120:91–102