HAL Id: hal-00301312
https://hal.archives-ouvertes.fr/hal-00301312
Submitted on 3 May 2005HAL is a multi-disciplinary open access
archive for the deposit and dissemination of sci-entific research documents, whether they are pub-lished or not. The documents may come from teaching and research institutions in France or abroad, or from public or private research centers.
L’archive ouverte pluridisciplinaire HAL, est destinée au dépôt et à la diffusion de documents scientifiques de niveau recherche, publiés ou non, émanant des établissements d’enseignement et de recherche français ou étrangers, des laboratoires publics ou privés.
Comparison of the levels of organic, elemental and
inorganic carbon in particulate matter in six urban
environments in Europe
M. Sillanpää, A. Frey, R. Hillamo, A. S. Pennanen, R. O. Salonen
To cite this version:
M. Sillanpää, A. Frey, R. Hillamo, A. S. Pennanen, R. O. Salonen. Comparison of the levels of organic, elemental and inorganic carbon in particulate matter in six urban environments in Europe. Atmospheric Chemistry and Physics Discussions, European Geosciences Union, 2005, 5 (3), pp.2719-2747. �hal-00301312�
ACPD
5, 2719–2747, 2005
Carbonaceous aerosols in six European cities
M. Sillanp ¨a ¨a et al.
Title Page Abstract Introduction Conclusions References Tables Figures J I J I Back Close
Full Screen / Esc
Print Version Interactive Discussion
EGU
Atmos. Chem. Phys. Discuss., 5, 2719–2747, 2005 www.atmos-chem-phys.org/acpd/5/2719/
SRef-ID: 1680-7375/acpd/2005-5-2719 European Geosciences Union
Atmospheric Chemistry and Physics Discussions
Comparison of the levels of organic,
elemental and inorganic carbon in
particulate matter in six urban
environments in Europe
M. Sillanp ¨a ¨a1, A. Frey1, R. Hillamo1, A. S. Pennanen2, and R. O. Salonen2
1
Finnish Meteorological Institute, Air Quality Research, Sahaajankatu 20 E, FIN-00880 Helsinki, Finland
2
National Public Health Institute, Department of Environmental Health, Neulaniementie 4, FIN-70210 Kuopio, Finland
Received: 17 February 2005 – Accepted: 23 March 2005 – Published: 3 May 2005 Correspondence to: M. Sillanp ¨a ¨a (markus.sillanpaa@fmi.fi)
ACPD
5, 2719–2747, 2005
Carbonaceous aerosols in six European cities
M. Sillanp ¨a ¨a et al.
Title Page Abstract Introduction Conclusions References Tables Figures J I J I Back Close
Full Screen / Esc
Print Version Interactive Discussion
EGU
Abstract
A series of 7-week sampling campaigns were conducted in urban background sites in the six European cities as follows: Duisburg 4 October–21 November 2002 (autumn), Prague 29 November 2002–16 January 2003 (winter), Amsterdam 24 January–13 March 2003 (winter), Helsinki 21 March–12 May 2003 (spring), Barcelona 28 March–19
5
May 2003 (spring) and Athens 2 June–21 July 2003 (summer). The campaigns were scheduled to include seasons of local public health concern due to high PM concen-trations or findings in previously conducted epidemiological studies. Aerosol samples were collected in parallel with two identical virtual impactors (VI), which divide air PM into two size fractions, PM2.5 and PM2.5−10. The filter samples were analysed with a
10
microbalance, an energy dispersive X-ray fluorescence (ED-XRF), an ion chromato-graph (IC) and a thermo-optical carbon analyser (TOA). The PM2.5and PM2.5−10 cam-paign means ranged 8.3–29.6 µg m−3and 5.4–28.7 µg m−3, respectively. The “wet and cool” seasons favoured low coarse PM concentration and high fine PM concentration, whereas the spring and summer led to low fine and high coarse PM concentrations.
15
The contribution of particulate organic matter (POM) to PM2.5−10 was highest (27%) in Prague and the lowest (10%) in Barcelona, while those to PM2.5 were generally higher, ranging from 21% in Barcelona to 54% in Prague. The contribution of elemen-tal carbon (EC) to PM2.5−10 were relatively low (1–6%) in all the six European cities but it contributed somewhat higher (5–9%) to PM2.5. The differences are most likely
20
due to variable contributions of local emission sources and seasonal factors such as domestic heating, vehicle exhausts and photochemical reactions. Carbonate, which interferes with carbon analysis by evolving stage at 900◦C, was detected in the coarse particles of Athens and Barcelona and it could be separated reliably from OC by a sim-ple integrating method. The calcium carbonate in Athens and Barcelona accounted for
25
56% and 11% of coarse PM masses, respectively. Carbonate was not found in other cities or in PM2.5. The mean PM2.5 mass portions of five OC thermal fractions (OC1, OC2, OC3, OC4 and OCP) varied in the range 26–33%, 6–10%, 7–10%, 9–22% and
ACPD
5, 2719–2747, 2005
Carbonaceous aerosols in six European cities
M. Sillanp ¨a ¨a et al.
Title Page Abstract Introduction Conclusions References Tables Figures J I J I Back Close
Full Screen / Esc
Print Version Interactive Discussion
EGU
29–50%, respectively, in six cities. The differences in the mass portion profiles were relatively small between the cities.
1. Introduction
Urban aerosol is a complex mixture of primary particulate emissions (from industry, transportation, power generation and natural sources) and secondary material formed
5
by gas-to-particle conversion mechanisms. Tropospheric aerosols contain sulphate, ammonium, nitrate, sea salt, trace metals, carbonaceous material, crustal compounds and water. Carbonaceous constituents such as elemental carbon (EC) and organic compounds usually have large contributions to the mass of all PM10 subfractions. EC (sometimes referred to as black carbon or graphitic carbon) is a primary pollutant
10
formed in combustion processes, but particulate organic matter (POM) is a complex mixture of many groups of compounds originating from a large variety of processes (Seinfeld and Pandis, 1998).
Recent epidemiological studies have shown consistent associations of mass con-centration of urban air thoracic particles (PM10–50% cutoff point at 10 µm), and its
sub-15
fraction fine particles (PM2.5–50% cutoff point at 2.5 µm), with mortality and morbidity among cardiorespiratory patients (WHO, 2003). There are still relatively few epidemi-ological studies with chemical speciation of the collected particulate samples, but one recent US time-series study (Metzger et al., 2004) has reported that the EC and POM concentrations in PM2.5were significantly associated with emergency department
vis-20
its in hospitals due to cardiovascular conditions. EC causes tissue irritation and the release of toxic chemical intermediates from scavenger cells in laboratory studies as well as acts as an carriers for various organic compounds. Volatile and semi-volatile or-ganic chemicals associated with the particles can act as irritants and allergens. Many aromatic compounds are suspected mutagens and carcinogens and some them may
25
also acute effects (Lighty et al., 2000).
ACPD
5, 2719–2747, 2005
Carbonaceous aerosols in six European cities
M. Sillanp ¨a ¨a et al.
Title Page Abstract Introduction Conclusions References Tables Figures J I J I Back Close
Full Screen / Esc
Print Version Interactive Discussion
EGU
particles as well as their EC and POM contents from particulate sampling campaigns in six European cities. The specific objective of our work has been to characterise the differences in these particulate constituents between purposefully selected contrast-ing air pollution caused by variations in emission sources, geographical location and season. Moreover, the campaigns were scheduled to include seasons of local
pub-5
lic health concern due to high PM concentrations or findings in previously conducted epidemiological studies.
2. Experimental methods
2.1. Sampling sites
A series of 7-week sampling campaigns were conducted in six European cities. The
10
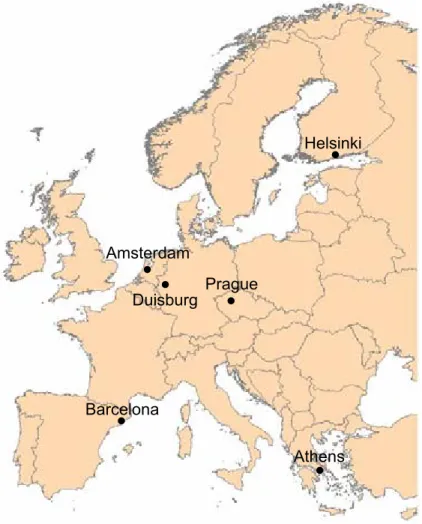
sampling sites (Fig. 1) were located in urban background areas and were influenced by variable contribution of traffic depending on the density of short-haul traffic and the local topography of site. The sites are described in detail including the additional local emission sources:
Duisburg (51◦260N, 6◦450E). The sampling site was located near the city centre at a
15
distance of 280 m from the nearest major street. The site was surrounded by three to five-storey buildings. The major local emission sources were traffic (e.g. diesel trucks) and metal industry. The sampling campaign was carried out between 4 October and 21 November 2002 (autumn) when the mean±SD ambient temperature and total pre-cipitation were 9±3◦C and 90 mm.
20
Prague (50◦50N, 14◦260E). The sampling station was located on the open field of Czech Hydrometeorological Institute in an uptown residential area. The nearest road was at a distance of 150 m with an average traffic density of 5000 vehicles/day, while the nearest major road was at a distance of 1 km. Traffic, domestic heating with solid fuels and energy production were the main local emission sources. The samplings
25
ACPD
5, 2719–2747, 2005
Carbonaceous aerosols in six European cities
M. Sillanp ¨a ¨a et al.
Title Page Abstract Introduction Conclusions References Tables Figures J I J I Back Close
Full Screen / Esc
Print Version Interactive Discussion
EGU
mean±SD ambient temperature and total precipitation were −2±5◦C and 50 mm. Amsterdam (52◦210N, 4◦540E). The site was located near the city centre at a dis-tance of 50 m from the nearest major street with an average traffic volume of 10 000 vehicles/day. The site was surrounded by multi-storey buildings. Traffic and sea were the main local emission sources. The samplings were carried out between 24
Jan-5
uary and 13 March 2003 (winter) when the mean±SD ambient temperature and total precipitation were 4±4◦C and 60 mm.
Helsinki (60◦100N, 24◦580E). The site was located near the city centre at a distance of 300 m from the nearest street with an average traffic volume of 30 700 vehicles/day. The site had multi-storey buildings on one side, but faced an open-air sports field on
10
the other side. Traffic and ships in harbour were the main local emission sources. The samplings were carried out between 21 March and 12 May 2003 (spring) when the mean±SD ambient temperature and total precipitation were 4±5◦C and 48 mm.
Barcelona (41◦230N, 2◦90E). The site was located on a car park near the city centre. The nearest road was at a distance of 100 m with an average traffic density of 17 000
15
vehicles/day. On one side there was a multi-storey building and the canopy of a railway station whilst on the other side there was a park enclosing a zoo. The main local emissions originated from traffic and harbour as well as the zoo to some extent. The samplings were carried out between 28 March and 19 May 2003 (spring) when the mean±SD ambient temperature and total precipitation were 15±2◦C and 10 mm.
20
Athens (37◦580N, 23◦430E). The site was located near the city centre at a distance of 100 m from the nearest road with an average traffic density of 30 000 vehicles/day. The site was spaciously enclosed with three- or four-storey buildings. The main lo-cal sources were traffic and construction work to some extent. The samplings were carried out between 2 June and 21 July 2003 (summer) when the mean±SD ambient
25
temperature and total precipitation were 29±4◦C and 0 mm.
The sampling durations were 3 or 4 days in alternation, with sample exchange usu-ally in Mondays and Thursdays between 10 and 12 a.m. The total number of samplings was 14 in each city. The automatic valve, that was programmed to switch on and off in
ACPD
5, 2719–2747, 2005
Carbonaceous aerosols in six European cities
M. Sillanp ¨a ¨a et al.
Title Page Abstract Introduction Conclusions References Tables Figures J I J I Back Close
Full Screen / Esc
Print Version Interactive Discussion
EGU
the cycles of 15 min, was set into the pump line of virtual impactors (VI) in Barcelona and Athens to avoid an overloading of the filters.
2.2. Aerosol sampling instruments
Aerosol particle samples were collected in parallel with two identical virtual impactors (VI; Loo and Cork, 1988). The VI divided airborne particulate matter into two size
frac-5
tions: PM2.5 and PM2.5−10. Particles were collected on polytetrafluoroethylene (PTFE) filters (diameter 47 mm, pore size 3 µm, type FS, Millipore, Ireland) for gravimetric anal-ysis and on preheated quartz fibre filters (Pallflex Tissuquartz 2500QAT-UP) for carbon analysis. In the latter VI, a tandem filter collection method (two quartz fibre filters from the same lot in series) was applied to estimate and correct for the positive sampling
10
artefacts, i.e. the absorption of organic gases. The total sampling flow rates of the VIs were 16.7 l min−1 and the upper cut-off sizes of the coarse fraction was established with a low volume PM10-inlets similar to the design of Liu and Pui (1981).
2.3. Gravimetric and chemical analysis
After sampling, the filters were placed in petrislides and those containing the quartz
15
fibre filters were wrapped inside aluminium foil. All the samples were frozen and sent via express delivery service to a central laboratory of the project for further analyses.
The PTFE filters were weighed with a Mettler M3-microbalance (Mettler Instrumente AG, Zurich, Switzerland) before sampling and before any chemical analysis. The sam-ples were allowed to become stabilized in the weighing room for 15–60 min before
20
weighing. Weighings were considered valid if duplicate mass readings were within 2 µg of each other. The relative humidity (RH) and temperature in the weighing room were 22±7% and 23±2◦C, respectively, with the exception of RH being 49±8% during the weighings of Barcelona- and Athens-samples. Regardless of different RH, the del-iquescence points of the abundant atmospheric inorganic salts were reached neither
25
ACPD
5, 2719–2747, 2005
Carbonaceous aerosols in six European cities
M. Sillanp ¨a ¨a et al.
Title Page Abstract Introduction Conclusions References Tables Figures J I J I Back Close
Full Screen / Esc
Print Version Interactive Discussion
EGU
frozen) were melted and then stabilized at the prevailing condition of weighing room. The scale and the reading of the microbalance were checked daily by using internal and standard weights, respectively. The electrostatic charges of filters and substrates were eliminated by using a Po-210 radioactive source.
The quartz fibre filters were analysed using a thermal-optical carbon analyser (TOA;
5
Sunset Laboratory Inc., Oregon). This analysis proceeds in two stages. In the first stage, organic carbon (OC) and carbonate carbon are volatilized in pure helium atmo-sphere at four temperature steps. During the second stage of the analysis, the carbon remaining on the filter is heated in the mixture of oxygen and helium (1:49, V-%) by using six temperature steps. The temperature program is shown in Table 1. A part
10
of OC is pyrolysed into compounds resembling the EC during the heating. An optical correction, i.e. a measurement of the transmittance of laser light through the filter, is applied to identify the pyrolysed OC from the EC that is determinated to be the fraction of carbon that comes out after the transmittance has reached its initial value. The POM is obtained by summing the OC peaks and pyrolysed OC and multiplying the sum by a
15
factor of 1.4 (Turpin et al., 2000 and Russell, 2003). An analogous method has been described in detail by Viidanoja et al. (2002).
The carbonaceous material is divided into six thermal fractions (Fig. 4). Hereafter in this paper, those thermal fractions are labelled as follows: OC1 (310◦C), OC2 (480◦C), OC3 (615◦C), OC4 (900◦C), OCP (pyrolysed OC) and EC (sum of EC thermal
frac-20
tions). C(CO3) refers to the carbonate carbon. The water-solubility of OC thermal fractions increases from left to right.
The total concentration and water-soluble fraction of calcium was determined from the PTFE filters by using an energy dispersive x-ray fluorescence (ED-XRF; Tracor Spectrace 5000) and an ion chromatography (IC; Dionex DX500, Dionex Corporation,
25
Sunnyvale, USA). The ED-XRF method has been described in detail by Spolnik et al. (2004) and the data analysis code has been published by Vekemans et al. (1994). The accuracy and precision of the present ED-XRF analysis are on average 14% and 4%, respectively. The IC method is described by Teinil ¨a et al. (2000) and its uncertainty
ACPD
5, 2719–2747, 2005
Carbonaceous aerosols in six European cities
M. Sillanp ¨a ¨a et al.
Title Page Abstract Introduction Conclusions References Tables Figures J I J I Back Close
Full Screen / Esc
Print Version Interactive Discussion
EGU
for calcium is estimated at 10%.
The CaCO3 concentrations were converted from those of CO2−3 and Ca2+ – based on the TOA and the ED-XRF analysis, respectively – by using the following equations:
[CaCO3]TOA=M(CaCO3)
M(C(CO3))[C(CO3)]=8.334 × [C(CO3)] (1)
[CaCO3]XRF=M(CaCO3)
M(Ca) [Ca]=2.497 × [Ca], (2)
5
where [C(CO3)] and [Ca] are the mass concentration of carbonate carbon and calcium, respectively.
The area of carbonate peak in TOA thermograms was manually integrated by setting the integral start to 210–225 s and the integral end to 250–275 s.
3. Results and discussion
10
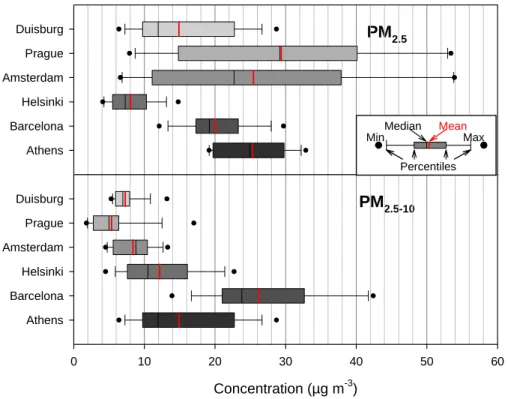
3.1. PM2.5and PM2.5−10mass concentrations
The mean mass concentrations of PM2.5 and PM2.5−10 during the 7-week campaigns in the six European cities are shown in Fig. 2. The concentrations were 14.7 and 7.2 µg/m3 in Duisburg, 29.6 and 5.4 µg/m3 in Prague, 25.4 and 8.4 µg/m3 in Ams-terdam, 8.3 and 12.8 µg/m3 in Helsinki, 20.0 and 26.3 µg/m3 in Barcelona, and 25.3
15
and 28.7 µg/m3 in Athens, respectively. The highest mean PM2.5 concentration was measured in Prague during winter and the highest mean PM2.5−10 concentration was measured in Athens during summer, whereas the corresponding lowest values were in Helsinki during spring and in Prague during winter. For comparison (data from lo-cal authorities), the annual mean PM2.5 and PM2.5−10 mass concentrations in 2001
20
were, respectively, as follows: 23.0 and 6.8 µg/m3 in Duisburg, 7.8 and 7.9 µg/m3 in Helsinki, and 28.0 and 13.0 µg/m3in Barcelona. These two PM size fractions were not
ACPD
5, 2719–2747, 2005
Carbonaceous aerosols in six European cities
M. Sillanp ¨a ¨a et al.
Title Page Abstract Introduction Conclusions References Tables Figures J I J I Back Close
Full Screen / Esc
Print Version Interactive Discussion
EGU
measured in the other three cities but the annual mean PM10 mass concentrations in 2001 were 24.5 µg/m3in Prague, 28.9 µg/m3in Amsterdam and 55.5 µg/m3in Athens. Our sampling campaign means were clearly higher than the corresponding annual means for Prague-PM10 (43%), Amsterdam-PM10(17%), Helsinki-PM2.5−10(62%) and Barcelona-PM2.5−10 (100%), confirming special episodes/seasons in these cities
dur-5
ing the campaigns. No difference with the historical annual mean value was found for Duisburg-PM2.5−10 (5.9%), Helsinki-PM2.5 (6.4%) and Athens-PM10 (−2.7%), but our campaign means were clearly lower than the annual means of 2001 for Duisburg-PM2.5 (−36%) and Barcelona-PM2.5(−29%).
The mean PM2.5−10 to PM2.5 ratios were significantly lower in Duisburg (0.58),
10
Prague (0.20) and Amsterdam (0.54) than in Helsinki (1.57), Barcelona (1.36) and Athens (1.14). According to their mass size fractions, the sampling campaigns could be roughly divided into two groups: one with dominating fine fraction and the other with dominating coarse fraction. The variations were most likely explained by di ffer-ences in season, local emission sources and geographical location. The first three
15
sampling campaigns were carried out during the ‘wet’ and cool season favouring low coarse PM concentration (due to low resuspension) and high fine PM concentration (additional local and regional energy production for heating). The sampling campaigns in Barcelona and Athens were conducted during warmer and drier seasons leading to lower fine PM concentration (semivolatiles in gas phase) and high coarse PM
concen-20
tration (resuspension). Road dust episodes, typical phenomena in springtime, are the reason for elevated coarse PM concentration in Helsinki. More detailed data on the PM mass concentrations, meteorology and air quality during these sampling periods will be reported elsewhere.
3.2. Mass concentrations of EC and POM in six cities
25
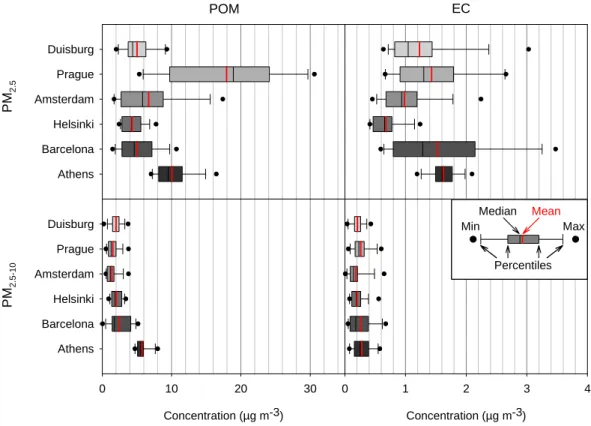
The mean POM and EC mass concentrations in PM2.5 and PM2.5−10 of the six-city samples are shown in Fig. 3. The POM mean (±SD) concentrations in PM2.5
ACPD
5, 2719–2747, 2005
Carbonaceous aerosols in six European cities
M. Sillanp ¨a ¨a et al.
Title Page Abstract Introduction Conclusions References Tables Figures J I J I Back Close
Full Screen / Esc
Print Version Interactive Discussion
EGU
varied profoundly between 3.8(±1.4) µg m−3 in Helsinki and 15.7(±7.2) µg m−3 in Prague, while the corresponding EC concentrations varied much less, i.e. between 0.68(±0.25) µg m−3in Helsinki and 1.6(±0.2) µg m−3in Athens. The mean POM (cor-rected for carbonate, see 3.3.1) and EC mass concentrations in PM2.5−10varied in the range 1.2–6.8 µg m−3and 0.18–0.28 µg m−3, respectively. The lowest mean POM and
5
EC in PM2.5−10were observed in Amsterdam, while the corresponding highest concen-trations were in Athens. The mean OC concenconcen-trations on PM2.5 and PM2.5−10backup filters varied in the range 0.32–1.31 and 0.12–0.33 µg m−3, contributing 5.7–19% and 5.8–14% of the OC on the front filter, respectively. The corresponding EC contribu-tions were about one tenth of those of OC, which was also anticipated because of the
10
nonvolatile nature of elemental carbon.
In this study, the POM of both fine and coarse fractions was obtained by multiply-ing organic carbon with a factor of 1.4 in each city. The conversation was applied to estimate the sum of mass concentration of organic compounds (POM), not only their carbonaceous content (OC) (Turpin et al., 2000 and Russell, 2003). Although in reality
15
the POM to OC ratio alters between the different samples, this factor was used due to the limitations of present instruments (e.g. FTIR spectroscopy or GC/MS).
Querol et al. (2004) reported in their European multi-city study that the annual mean PM2.5mass concentrations of total carbon (TC; sum of OC and EC) varied in the range of 2–8 µg m−3 in the urban background sites. Our campaign-mean TC concentrations
20
of PM2.5 fell into this range everywhere except in Prague (12.6 µg m−3), where the ex-ceedance was most likely due to the emissions from additional local residential heating with solid fuels (coal, biomass) and additional regional energy production during winter season. In Querol et al. (2004), the annual mean TC mass concentrations of PM2.5−10 (PM2.5−10=PM10–PM2.5) varied in the range of 0–1 µg m−3, while our campaign-mean
25
TC were between 1.0 and 1.9 µg m−3, except that it was as high as 3.9 µg m−3 in Athens.
ACPD
5, 2719–2747, 2005
Carbonaceous aerosols in six European cities
M. Sillanp ¨a ¨a et al.
Title Page Abstract Introduction Conclusions References Tables Figures J I J I Back Close
Full Screen / Esc
Print Version Interactive Discussion
EGU
the method used in thermal-optical carbon analysis. Chow et al. (2001) showed that the NIOSH and IMPROVE methods (Table 1) are equivalent for total carbon but the EC-NIOSH (usually a smaller fraction of TC) typically gives less than half of the values of the EC-IMPROVE. A reasonable estimation for EC lies between these two methods (Sciare et al., 2003). The method used in this study was a NIOSH method with minor
5
modifications, and therefore the EC concentrations could be underestimated.
The contributions of carbonaceous materials to PM2.5and PM2.5−10are shown in Ta-ble 2. As expected, the EC contributions to PM2.5−10(1–6%) were lower than to PM2.5 (5–9%) in all the six European cities. The POM contribution to PM2.5−10 was highest (27%) in Prague and lowest (10%) in Barcelona, while those to PM2.5 were generally
10
higher, ranging from 21% in Barcelona to 54% in Prague. The differences are most likely due to variable contributions of local emission sources and seasonal factors such as residential heating with solid fuels, vehicle exhausts and photochemical reactions. Putaud et al. (2004) averaged out the mean annual black carbon (BC) and POM contri-butions based on the measurements in eight European cities (urban background sites).
15
The mean BC contributions to PM2.5 and PM2.5−10(=PM10–PM2.5) were 8% and 3%, respectively, which agreed well with our results. In contrast, their annual mean POM contributions to PM2.5 and PM2.5−10were 22% and 8%, being similar to the minimum values of our campaign-means and only about one-third to one-half of our maximum values.
20
The mean (±SD) PM2.5 to PM10 proportions of elemental carbon varied between 78(±6)% and 86(±6)%. These high percentages indicate that EC existed mainly in fine particulate fractions, which was expected since EC is produced only in combus-tion processes. The mean PM2.5 to PM10 ratios of POM varied more than those of EC. The mean POM percentages (±SD) were 56±4% in Athens, 65±6% in Barcelona,
25
68±8% in Helsinki, 71±11% in Duisburg, 81±6% in Amsterdam and 92±4% in Prague. The proportions increased with the decreasing mean ambient temperature during the sampling campaigns, which could be explained by e.g. the fact that during warm sea-sons traffic-derived semivolatile organics favour appearance mainly in the gas phase,
ACPD
5, 2719–2747, 2005
Carbonaceous aerosols in six European cities
M. Sillanp ¨a ¨a et al.
Title Page Abstract Introduction Conclusions References Tables Figures J I J I Back Close
Full Screen / Esc
Print Version Interactive Discussion
EGU
energy production for heating decreases and there are higher natural emissions of coarse POM.
The OC to EC ratios of fine particulate size fraction varied in the range of 2.1–4.3 in Barcelona, Duisburg, Athens, Helsinki and Amsterdam, whereas it was apparently higher (8.7) in Prague. Na et al. (2004) have reviewed some reported OC/EC ratios.
5
The low OC/EC ratio has been associated with traffic sources (2.2 and 0.8 for light-duty gasoline and heavy-light-duty diesel vehicles, respectively), whereas residential heat-ing (residential wood combustion 4.15 and natural gas home appliance 12.7), forest fire (14.5) and paved road dust (13.1) have caused remarkably higher ratios. On the other hand, it is noteworthy that the analysis method is critical for the division between OC
10
and EC. In view of the ratios above, residential heating could have a significant impact on the high OC in Prague, whereas traffic played an important role in other cities.
The Pearson’s correlation coefficients between particulate mass concentration, POM, and EC in both PM2.5 and PM2.5−10 are shown in Table 3. The PM2.5 mass concentration had a strong correlation (r=0.84–0.99) with fine POM in all the cities
ex-15
cept in Barcelona (r=0.57) where the POM had a small contribution to PM2.5. However, fine POM correlated well (r=0.95) with fine EC in Barcelona, which together with the low OC/EC (2.1) suggests that they had a common dominant source different from the other cities, e.g. oil combustion in ship engines at the large harbour. The coarse POM correlated well (r≥0.90) with coarse particulate mass in both Prague and Helsinki, and
20
with both fine POM and coarse EC in Amsterdam. 3.3. Analysis of thermal fractions
3.3.1. Carbonates in atmospheric particles
Carbonate can interfere with the carbon analysis by evolving during the OC4 step (900◦C; Fig. 4), thus causing a positive artefact to the OC concentration (Sciare et
25
al., 2003). In this study, the carbonate could be quantified in PM2.5−10 of Barcelona and Athens but it could not be detected neither in PM2.5−10of the other four cities nor
ACPD
5, 2719–2747, 2005
Carbonaceous aerosols in six European cities
M. Sillanp ¨a ¨a et al.
Title Page Abstract Introduction Conclusions References Tables Figures J I J I Back Close
Full Screen / Esc
Print Version Interactive Discussion
EGU
in PM2.5of any city. The C(CO3) to OC ratio in coarse particles was on average 0.17 in Barcelona and 0.53 in Athens, which shows that the OC (or POM) concentration would have been largely overestimated without the exclusion of C(CO3). The concentration of carbonate carbon (C(CO3) was subtracted from the sum of the OC total area for the POM results shown in Sect. 3.2.
5
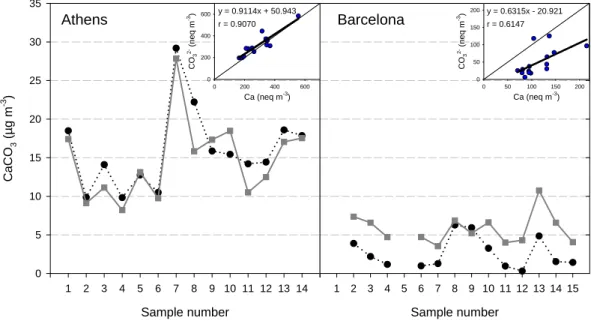
The time series of CaCO3concentrations in PM2.5−10from Athens and Barcelona are shown in Fig. 5. The campaign mean (range), based on Eq. (1), was 15.9 (9.8–29.2) µg m−3 in Athens whereas the corresponding value in Barcelona was 2.6 (0.3–6.3) µg m−3. These concentrations accounted for 56(±9)% and 11(±9)% of the coarse partic-ulate mass in Athens and Barcelona, respectively. The [CaCO3]T OA and [CaCO3]X RF
10
(based on Eqs. 1 and 2) match up well in Athens (Pearson’s r= 0.91), as well as there is a trend in Barcelona (Pearson’s r=0.61) but the molar equivalent concentration of CO2−3 was lower than that of Ca2+. This indicates that the coarse calcium exists exclu-sively as carbonate in Athens, whereas the coarse calcium in Barcelona partly exists also in other forms (e.g. as oxide). The similar conclusion was also drawn by
Bar-15
douki et al. (2003) who discovered according to ion balance that the calcium in coarse mode was strongly associated with carbonate (a molar ratio of unity) in the Eastern Mediterranean in summertime.
Figure 6 depicts the occurrence and proportions of crustal elements in six cities. Cal-cium had a major contribution in Barcelona and Athens, whereas aluminium or silicon
20
dominated in other four cities. In addition, based on the mass size distribution measure-ments by Berner low pressure impactor and on the IC analysis (data not shown), the PM10 calcium existed almost exclusively in PM2.5−10 in both Barcelona (93±4%) and Athens (89±2%) as well as in other cities (75–86%). The contribution of watersoluble fraction to the total amount of calcium was determined by comparing the concentration
25
measured by the IC (soluble fraction) to that measured by the ED-XRF (total amount). Low coarse Ca concentration together with its high water-solubility in Duisburg, Prague and Amsterdam indicate that calcium exists as water-soluble compounds (e.g. as oxide or sulphate) and calcium carbonate had an exiguous contribution to particulate mass.
ACPD
5, 2719–2747, 2005
Carbonaceous aerosols in six European cities
M. Sillanp ¨a ¨a et al.
Title Page Abstract Introduction Conclusions References Tables Figures J I J I Back Close
Full Screen / Esc
Print Version Interactive Discussion
EGU
On the contrary, high coarse Ca suggested to the presence of calcium carbonate in Barcelona and Athens; in the latter city main fraction of calcium was water-insoluble. The poor water-solubility of calcium in Helsinki indicated to the presence of calcium carbonate or calcium silicates, though carbonate could not be detected most likely due to its low concentration.
5
These results indicate that in the thermal-optical carbon analysis the carbonate can be reliably excluded from the OC and therefore this integration method can be used as an alternative for the HCl pre-treatment method (Cachier et al., 1989).
3.3.2. Thermal fraction of OC in PM2.5
The thermograms, i.e. the output of EC/OC analysis, are commensurate between the
10
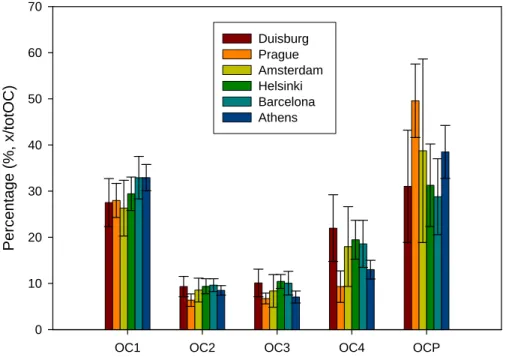
six-city samples, since the results were produced by following the identical sampling and analytical methods. The mean PM2.5 mass portions of the five OC thermal frac-tions, labelled OC1, OC2, OC3, OC4 and OCP, varied in the range 26–33%, 6–10%, 7–10%, 9–22% and 29–50%, respectively, in the six cities (Fig. 7). The differences in the mass portion profiles were relatively small between the cities. However, a distinct
15
observation was that the pyrolysed fraction of total OC was higher (50%) in Prague than in the other cities (29–41%) and, vice versa, the OC peaks at temperature steps of 480, 615 and 900◦C were smaller in Prague than in the other cities. In addition, the OC1 fraction (at 310◦C) was 33% for both Barcelona and Athens while it was somewhat lower (26–29%) for the other cities.
20
The fine OC correlated inversely with OC1 (r=−0.32–0.75), OC2 (r=−0.022–0.58), OC3 (r=−0.51–0.69) and OC4 (r=−0.31–0.94) in any city, whereas the OCP correlated well with OC (r=0.70–0.93). This is more likely due to an insufficiently long residence time at each temperature step of the TOA method, which increases the charring of OC (Yu et al., 2002) than due to the different composition of organic species. The
transmit-25
tance of laser light through the filter decreased gradually during each OC temperature step (OC1-OC4), which suggests that OC pyrolysed all along the helium stage.
ACPD
5, 2719–2747, 2005
Carbonaceous aerosols in six European cities
M. Sillanp ¨a ¨a et al.
Title Page Abstract Introduction Conclusions References Tables Figures J I J I Back Close
Full Screen / Esc
Print Version Interactive Discussion
EGU
the OC2-OC4 (10–16%) and the OCP were equally found only in minor amounts (0– 3%). The thermogram profiles were congruent between the cities and irrespective of geographical location or season. In this study, the OC on the backup filter is supposed to be comprised of the absorption of organic gases, but some part of it may have been formed from the evaporation of the particles collected on the front filter (Turpin et al.,
5
2000). Regardless of its origin (positive or negative artefact), the OC on backup filter should be easily volatile, which can be also seen in our results.
The advantages of this study were that 1) all the samples were collected by following a uniform protocol and they were analysed by using the same thermo-optical method, which allowed us to take a comparative look at the six-city results and 2) the long
sam-10
pling time and the use of filters from one manufacturing lot improved the accuracy of the tandem quartz filter subtraction method (Kirchstetter et al., 2001). Nevertheless, only very limited conclusions can be drawn from the chemical content of thermal frac-tions, because the evolution of organic components depends on the several factors: First, the presence of some catalytically active inorganic salts such as Na+ and K+
15
(Novakov and Corrigan, 1996) or ammonium sulphate and phosphate (Yu et al., 2002) can increase the combustion rate of certain compounds (Novakov and Corrigan, 1996) or the charring of insoluble organic materials (Yu et al., 2002). Second, as mentioned above, the too short steps of temperature program cause the overlapping of OC peaks and increase the OC charring. Third, organic gases can be adsorbed on quartz filter
20
with more than a single binding energy (Kirchstetter et al., 2001) which results in the evolution of single compound to the various thermal fractions.
4. Summary and conclusions
A series of 7-week sampling campaigns were carried out during selected seasons at the different locations in Europe: Duisburg (autumn), Prague (winter), Amsterdam
25
(winter), Helsinki (spring), Barcelona (spring) and Athens (summer). The PM2.5 and PM2.5−10samples were collected simultaneously with two identical virtual impactor and
ACPD
5, 2719–2747, 2005
Carbonaceous aerosols in six European cities
M. Sillanp ¨a ¨a et al.
Title Page Abstract Introduction Conclusions References Tables Figures J I J I Back Close
Full Screen / Esc
Print Version Interactive Discussion
EGU
they were analysed with a microbalance, energy dispersive X-ray fluorescence, an ion chromatograph and a thermal-optical carbon analyser.
We showed large differences in PM2.5and PM2.5−10concentrations between the se-lected urban air pollution situations in Europe. The “wet and cool” seasons favoured low coarse PM concentration and high fine PM concentration, whereas the spring and
5
summer led to low fine and high coarse PM concentrations. There were additional dif-ferences in the POM to mass ratio in both PM2.5 and PM2.5−10, suggesting variations in local emission sources and seasonal factors such as domestic heating, vehicle ex-hausts and photochemical reactions. The high fine POM in Prague was most likely due to the emissions from additional local residential heating with solid fuels (coal, biomass)
10
and additional regional energy production during winter season.
Carbonates have been known to interfere the thermal carbon analysis by releasing CO2 at high temperatures. To our knowledge, the integration method, which provides for the exclusion of carbonate from OC in the thermal-optical carbon analysis, is not published earlier. Calcium carbonate had a significant contribution to PM2.5−10
con-15
centration in Athens (56%) and Barcelona (11%). This study showed that a simple integration method is a reliable and quantitative tool for the determination of calcium carbonate.
The mean PM2.5mass portions of five OC thermal fractions (OC1, OC2, OC3, OC4 and OCP) varied in the range 26–33%, 6–10%, 7–10%, 9–22% and 29–50%,
respec-20
tively, in six cities. The differences in the mass portion profiles were relatively small between the cities. The inverse correlation between OC and OC1-OC4 and the good correlation between OC and OCP indicated that the temperature steps of the TOA method used in this study were too short for the 3- or 4-days PM2.5samples.
The on-going toxicological studies will clarify the health significance of these findings.
25
Acknowledgements. This study was conducted within the framework of the project ‘Chemical
and biological characterisation of ambient air coarse, fine, and ultrafine particles for human health risk assessment in Europe’ (PAMCHAR) co-ordinated by the National Public Health Institute of Finland (http://www.pamchar.org/). The financial support of the EC-FP5 Quality of
ACPD
5, 2719–2747, 2005
Carbonaceous aerosols in six European cities
M. Sillanp ¨a ¨a et al.
Title Page Abstract Introduction Conclusions References Tables Figures J I J I Back Close
Full Screen / Esc
Print Version Interactive Discussion
EGU
Life and Management of Living Resources Programme (Contract QLK4-CT-2001-00423), the Academy of Finland (FINE-contract 201701) and the Centre of Excellence Programme 2002-2007 of the Academy of Finland (Contract 53307) and the National Technology Fund (TEKES, Contract 40715/01) is also highly appreciated.
References
5
Bardouki, H., Liakakou, H., Economou, C., Sciare, J., Smol´ık, J., ˇZd´ımal, V., Eleftheriadis, K., Lazaridis, M., Dye, C., and Mihalopoulos, N.: Chemical composition of size-resolved atmo-spheric aerosols in the eastern Mediterranean during summer and winter, Atmos. Environ., 37, 195–208, 2003.
Cachier, H., Br ´emond, M. P., and Buat-M ´enard, P.: Determination of atmospheric soot carbon 10
with a simple thermal method, Tellus, 41B, 379–390, 1989.
Chow, J. C., Watson, J. G., Crow, D., Lowenthal, D. H., and Merrifield, T.: Comparison of IMPROVE and NIOSH carbon measurements, Aerosol Sci. Technol., 34, 23–34, 2001. Kirchstetter, T. W., Corrigan, C. E., and Novakov, T.: Laboratory and field investigation of the
absorption of gaseous organic compounds onto quartz filters, Atmos. Environ., 35, 1663– 15
1671, 2001.
Lighty, J. S., Veranth, J. M., and Sarofim, A. F.: Combustion aerosols: factors governing their size and composition and implications to human health, J. Air & Waste Manage. Assoc., 50, 1565–1618, 2000.
Liu, B. Y. H. and Pui, D. Y. H.: Aerosol sampling inlets and inhalable particles, Atmos. Environ., 20
15, 589–600, 1981.
Loo, B. W. and Cork, C. P.: Development of high efficiency virtual impactor, Aerosol Sci. Tech-nol., 9, 167–176, 1988.
Metzger, K. B., Tolbert, P. E., Klein, M., Peel, J. L., Flanders, W. D., Todd, K., Mulholland, J. A., Ryan, P. B., and Frumkin, H.: Ambient air pollution and cardiovascular emergency 25
department visits, Epidemiology, 15, 46–56, 2004.
Na, K., Sawant, A. A., Song, C., and Cocker III, D. R.: Primary and secondary carbonaceous species in the atmosphere of Western Riverside County, California, Atmos. Environ., 38, 1345–1355, 2004.
ACPD
5, 2719–2747, 2005
Carbonaceous aerosols in six European cities
M. Sillanp ¨a ¨a et al.
Title Page Abstract Introduction Conclusions References Tables Figures J I J I Back Close
Full Screen / Esc
Print Version Interactive Discussion
EGU
Novakov, T. and Corrigan, C. E.: Cloud condensation nucleus activity of the organic component of biomass smoke particles, Geophys. Res. Lett., 23, 2141–2144, 1996.
Putaud, J.-P., Raes, F., Van Dingenen, R., Br ¨uggemann, E., Facchini, M.-C., Decesari, S., Fuzzi, S., Gehrig, R., H ¨uglin, C., Laj, P., Lobbeer, G., Maenhaut, W., Mihalopoulos, N., M ¨uller, K., Querol, X., Rodriguez, S., Schneider, J., Spindler, G., ten Brink, H., Torseth, K., 5
and Wiedensohler, A.: A European aerosol phenomenology – 2: chemical characteristics of particulate matter at kerbside, urban, rural and background sites in Europe, Atmos. Environ., 38, 2579–2595, 2004.
Querol, X., Alastuey, A., Ruiz, C. R., Artinano, B., Hansson, H. C., Harrison, R. M., Buringh, E., ten Brink, H. M., Lutz, M., Bruckmann, P., Straehl, P., and Schneider, J.: Speciation and 10
origin of PM10 and PM2.5 in selected European cities, Atmos. Environ., 38, 6547–6555, 2004.
Russell, L. M.: Aerosol organic-mass-to-organic-carbon ratio measurements, Environ. Sci. Technol., 37, 2982–2987, 2003.
Sciare, J., Cachier, H., Oikonomou, K., Ausset, P., Srada-Est `eve, R., and Mihalopoulos, N.: 15
Characterization of carbonaceous aerosols during the MINOS campaign in Crete, July– August 2001: a multi-analytical approach, Atmos. Chem. Phys., 3, 1743–1757, 2003,
SRef-ID: 1680-7324/acp/2003-3-1743.
Seinfeld, J. H. and Pandis, S. N.: Atmospheric chemistry and physics: From air pollution to climate change, John Wiley, New York, 1998.
20
Spolnik, Z., Worobiec, A., Injuk, J., Neilen, D., Schellen, H. L., and Van Grieken, R.: Chemical characterization of airborne particles in St. Martinus Cathedral in Weert, The Netherlands, Mikrochim. Acta, 145, 223–227, 2004.
Teinil ¨a, K., Kerminen, V.-M., and Hillamo, R.: A study of size-segregated aerosol chemistry in the Antarctic atmosphere, J. Geophys. Res., 105, 3893–3904, 2000.
25
Turpin, B. J., Saxena, P., and Andrews, E.: Measuring and simulating particulate organics in the atmosphere: problems and prospects, Atmos. Environ., 34, 2983–3013, 2000.
Vekemans, B., Janssens, K., Vincze, L., Adams, F., and Van Espen, P.: Analysis of X-ray spectra by iterative least squares (AXIL): New developments, X-Ray Spectrom, 23, 278– 285, 1994.
30
Viidanoja, J., Sillanp ¨a ¨a, M., Laakia, J., Kerminen, V.-M., Hillamo, R., Aarnio, P., and Koskentalo, T.: Organic and black carbon in PM2.5and PM10: 1 year of data from an urban site in Helsinki,
ACPD
5, 2719–2747, 2005
Carbonaceous aerosols in six European cities
M. Sillanp ¨a ¨a et al.
Title Page Abstract Introduction Conclusions References Tables Figures J I J I Back Close
Full Screen / Esc
Print Version Interactive Discussion
EGU
WHO (World Health Organization): Health aspects of air pollution with particulate matter, ozone and nitrogen dioxide, Report on a WHO Working Group; Bonn, Germany 13–15 January 2003,http://www.euro.who.int/document/e79097.pdf, 2003.
Yu, J. Z., Xu, J., and Yang, H.: Charring characteristics of atmospheric organic particulate matter in thermal analysis, Environ. Sci. Technol., 36, 754–761, 2002.
ACPD
5, 2719–2747, 2005
Carbonaceous aerosols in six European cities
M. Sillanp ¨a ¨a et al.
Title Page Abstract Introduction Conclusions References Tables Figures J I J I Back Close
Full Screen / Esc
Print Version Interactive Discussion
EGU
Table 1. Experimental parameters of the thermal-optical carbon analysis (TOA) method used
in this study and those of two well-known methods (NIOSH and IMPROVE).
Carrier gas This study NIOSHa IMPROVEa
He-1 (OC1) 310◦C, 60 s 310◦C, 60 s 250◦C, 150 s He-2 (OC2) 480◦C, 60 s 475◦C, 60 s 450◦C, 150 s He-3 (OC3) 615◦C, 60 s 615◦C, 60 s 615◦C, 250 s He-4 (OC4) 900◦C, 90 s 870◦C, 90 s He/Ob2 550◦C, 60 s 550◦C, 45 s 550◦C, 200 s He/Ob2 625◦C, 60 s 625◦C, 45 s He/Ob2 700◦C, 45 s 700◦C, 45 s 700◦C, 160 s He/Ob2 775◦C, 45 s 775◦C, 45 s He/Ob2 850◦C, 45 s 850◦C, 45 s 850◦C, 200 s He/Ob2 920◦C, 60 s 890◦C, 120 s a Sciare et al. (2003) b
ACPD
5, 2719–2747, 2005
Carbonaceous aerosols in six European cities
M. Sillanp ¨a ¨a et al.
Title Page Abstract Introduction Conclusions References Tables Figures J I J I Back Close
Full Screen / Esc
Print Version Interactive Discussion
EGU
Table 2. The relations between total particulate and carbonaceous fractions in PM2.5 and
PM2.5−10.
POM/PM (%) EC/PM (%) OC/EC BU/F-OCa(%)
Mean (SD) Min Max Mean (SD) Min Max Mean (SD) Min Max Mean±SD
PM2.5 Duisburg 31 (6) 21 38 9.0 (3.1) 4.7 15 2.7 (0.9) 1.7 5.2 16±7 Prague 54 (4) 48 60 5.7 (2.7) 1.3 11 8.7 (6.0) 3.6 27 6±2 Amsterdam 23 (4) 19 29 5.4 (3.4) 1.7 13 4.3 (2.6) 1.2 9.8 12±5 Helsinki 46 (6) 34 57 8.4 (1.8) 4.5 11 4.0 (0.9) 2.8 6.3 14±3 Barcelona 21 (11) 8.9 49 7.6 (4.5) 3.1 18 2.1 (0.5) 1.5 3.1 17±3 Athens 35 (4) 30 47 6.8 (1.4) 4.9 9.4 3.9 (0.9) 2.7 5.4 19±3 PM2.5−10 Duisburg 24 (8) 3.4 37 2.9 (1.2) 0.48 5.05 9.1 (9.8) 0.7 39 14±19 Prague 27 (7) 16 41 5.5 (2.6) 2.2 11 3.9 (1.5) 2.0 7.3 10±5 Amsterdam 15 (8) 5.6 28 2.3 (1.5) 0.06 5.4 11 (21) 3.4 84 12±3 Helsinki 15 (4) 11 25 1.6 (0.6) 0.84 2.7 7.1 (2.3) 3.8 13.6 8±3 Barcelona 10 (6) 2.7 23 1.1 (0.9) 0.15 3.2 9.0 (5.5) 4.1 18.1 9±4 Athens 24 (3) 19 30 1.0 (0.4) 0.23 1.9 24 (17) 9.5 62 6±1 a
ACPD
5, 2719–2747, 2005
Carbonaceous aerosols in six European cities
M. Sillanp ¨a ¨a et al.
Title Page Abstract Introduction Conclusions References Tables Figures J I J I Back Close
Full Screen / Esc
Print Version Interactive Discussion
EGU
Table 3. Pearson’s correlation coefficients (r) between the PM mass, POM, and EC in PM2.5
and PM2.5−10.
Duisburg Prague Amsterdam Helsinki Barcelona Athens
PM2.5 vs. PM2.5–10 0.280 0.554 −0.128 0.584 0.295 0.717 EC(2.5) vs. EC(2.5–10) 0.524 0.379 0.875 0.810 0.884 0.348 POM(2.5) vs. POM(2.5–10) 0.542 0.661 0.897 0.498 0.824 0.800 PM2.5 vs. EC(2.5) 0.553 0.360 0.664 0.722 0.341 0.405 PM2.5 vs. POM(2.5) 0.844 0.987 0.959 0.897 0.567 0.860 EC(2.5) vs. POM(2.5) 0.672 0.436 0.762 0.790 0.945 0.517 PM2.5–10 vs. EC(2.5–10) 0.352 0.822 0.208 0.696 −0.087 0.470 PM2.5–10 vs. POM(2.5–10) 0.651 0.935 0.263 0.904 −0.073 0.831 EC(2.5–10) vs. POM(2.5–10) 0.198 0.828 0.926 0.813 0.870 0.659
ACPD
5, 2719–2747, 2005
Carbonaceous aerosols in six European cities
M. Sillanp ¨a ¨a et al.
Title Page Abstract Introduction Conclusions References Tables Figures J I J I Back Close
Full Screen / Esc
Print Version Interactive Discussion EGU Helsinki ● Amsterdam ●
Figure
1.
Duisburg ● Prague● Barcelona ● Athens ●Fig. 1. The locations of six sampling sites in Europe (Map © Genimap).
ACPD
5, 2719–2747, 2005
Carbonaceous aerosols in six European cities
M. Sillanp ¨a ¨a et al.
Title Page Abstract Introduction Conclusions References Tables Figures J I J I Back Close
Full Screen / Esc
Print Version Interactive Discussion EGU PM2.5 Athens Barcelona Helsinki Amsterdam Prague Duisburg PM2.5-10 Concentration (µg m-3) 0 10 20 30 40 50 60 Athens Barcelona Helsinki Amsterdam Prague Duisburg Min Max Percentiles Mean Median Figure 2.
Fig. 2. The mean, median and range as well as percentiles of fine and coarse particulate
matter in six cities.
ACPD
5, 2719–2747, 2005
Carbonaceous aerosols in six European cities
M. Sillanp ¨a ¨a et al.
Title Page Abstract Introduction Conclusions References Tables Figures J I J I Back Close
Full Screen / Esc
Print Version Interactive Discussion EGU Athens Barcelona Helsinki Amsterdam Prague Duisburg Concentration (µg m-3) 0 10 20 30 Athens Barcelona Helsinki Amsterdam Prague Duisburg Concentration (µg m-3) 0 1 2 3 4 POM PM 2.5 PM 2.5-10 EC Min Max Percentiles Mean Median
Figure 3.
Fig. 3. The mean, median and range as well as percentiles of fine and coarse particulate
organic matter and black carbon in six cities.
ACPD
5, 2719–2747, 2005
Carbonaceous aerosols in six European cities
M. Sillanp ¨a ¨a et al.
Title Page Abstract Introduction Conclusions References Tables Figures J I J I Back Close
Full Screen / Esc
Print Version Interactive Discussion EGU Time (sec) 0 100 200 300 400 500 600 700 FID signal 0 1000 2000 3000 4000 5000 6000 T emperat u re (C) 0 200 400 600 800 1000 FID1 temperature laser OC4 OC3 OC2 OC1 He 2% O2/He carbonate OCP EC Figure 4.
Fig. 4. The temperature program of TOA method used in this study and the manually integrated
carbonate peak (coarse sample #14 of Athens).
ACPD
5, 2719–2747, 2005
Carbonaceous aerosols in six European cities
M. Sillanp ¨a ¨a et al.
Title Page Abstract Introduction Conclusions References Tables Figures J I J I Back Close
Full Screen / Esc
Print Version Interactive Discussion EGU Athens Sample number 1 2 3 4 5 6 7 8 9 10 11 12 13 14 CaC O3 (µg m -3 ) 0 5 10 15 20 25 30 35 Barcelona Sample number 1 2 3 4 5 6 7 8 9 10 11 12 13 14 15 Ca (neq m-3 ) 0 200 400 600 CO 3 2- (neq m -3) 0 200 400 600 y = 0.9114x + 50.943 r = 0.9070 Ca (neq m-3 ) 0 50 100 150 200 CO 3 2- (neq m -3) 0 50 100 150 200 y = 0.6315x - 20.921 r = 0.6147 Figure 5.
Fig. 5. The concentration of coarse CaCO3in PM2.5−10from Athens and Barcelona. The black
dotted line is based on the CO2−3 analysed by the TOA, and grey line on the Ca2+ analysed by the ED-XRF. The trendline for the molar equivalent concentrations of calcium (x axis) and carbonate (y axis) are shown in the right upper corner.
ACPD
5, 2719–2747, 2005
Carbonaceous aerosols in six European cities
M. Sillanp ¨a ¨a et al.
Title Page Abstract Introduction Conclusions References Tables Figures J I J I Back Close
Full Screen / Esc
Print Version Interactive Discussion
EGU
Duisburg Prague Amsterdam Helsinki Barcelona Athens
Percentage (% ) 0 20 40 60 80 100 120 Ti Fe Si Al K Ca Soluble Ca2+ 1.4 1.5 1.2 4.2 5.6 8.8 Figure 6.
Fig. 6. The proportions of crustal elements (Ca, Ti, Fe, Si, Al and K) in the coarse soil particles.
The value above the bar indicates to the sum of mean concentrations (µg m−3) of crustal elements. The portion of water-soluble calcium is shown as striped bars.
ACPD
5, 2719–2747, 2005
Carbonaceous aerosols in six European cities
M. Sillanp ¨a ¨a et al.
Title Page Abstract Introduction Conclusions References Tables Figures J I J I Back Close
Full Screen / Esc
Print Version Interactive Discussion
EGU
OC1 OC2 OC3 OC4 OCP
Per c entage (%, x/totOC ) 0 10 20 30 40 50 60 70 Duisburg Prague Amsterdam Helsinki Barcelona Athens Figure 7.
Fig. 7. The mean PM2.5mass portions of five OC thermal fractions in the six-city samples.