HAL Id: hal-03108291
https://hal.sorbonne-universite.fr/hal-03108291
Submitted on 13 Jan 2021
HAL is a multi-disciplinary open access archive for the deposit and dissemination of sci-entific research documents, whether they are pub-lished or not. The documents may come from teaching and research institutions in France or abroad, or from public or private research centers.
L’archive ouverte pluridisciplinaire HAL, est destinée au dépôt et à la diffusion de documents scientifiques de niveau recherche, publiés ou non, émanant des établissements d’enseignement et de recherche français ou étrangers, des laboratoires publics ou privés.
cattle-transport networks
Frederik Schirdewahn, Hartmut Lentz, Vittoria Colizza, Andreas Koher,
Philipp Hövel, Beatriz Vidondo
To cite this version:
Frederik Schirdewahn, Hartmut Lentz, Vittoria Colizza, Andreas Koher, Philipp Hövel, et al.. Early warning of infectious disease outbreaks on cattle-transport networks. PLoS ONE, Public Library of Science, 2021, 16 (1), pp.e0244999. �10.1371/journal.pone.0244999�. �hal-03108291�
RESEARCH ARTICLE
Early warning of infectious disease outbreaks
on cattle-transport networks
Frederik Schirdewahn1, Hartmut H. K. Lentz2, Vittoria Colizza3, Andreas Koher1, Philipp Ho¨ vel1,4¤, Beatriz VidondoID5*
1 Institut fu¨r Theoretische Physik, Technische Universita¨ t Berlin, Berlin, Germany, 2 Institute of Epidemiology, Friedrich-Loeffler-Institut, Greifswald - Insel Riems, Germany, 3 Sorbonne Universite´ s, UPMC Univ Paris 06, INSERM, Institut Pierre Louis d’e´pide´miologie et de Sante´ Publique, Paris, France, 4 School of Mathematical Sciences, University College Cork, Cork, Ireland, 5 Veterinary Public Health Institute, University of Bern, Bern-Liebefeld, Switzerland
¤ Current address: School of Mathematical Sciences, University College Cork, Cork, Ireland *beatriz.vidondo@gmx.ch
Abstract
Surveillance of infectious diseases in livestock is traditionally carried out at the farms, which are the typical units of epidemiological investigations and interventions. In Central and West-ern Europe, high-quality, long-term time series of animal transports have become available and this opens the possibility to new approaches like sentinel surveillance. By comparing a sentinel surveillance scheme based on markets to one based on farms, the primary aim of this paper is to identify the smallest set of sentinel holdings that would reliably and timely detect emergent disease outbreaks in Swiss cattle. Using a data-driven approach, we simu-late the spread of infectious diseases according to the reported or available daily cattle transport data in Switzerland over a four year period. Investigating the efficiency of surveil-lance at either market or farm level, we find that the most efficient early warning surveilsurveil-lance system [the smallest set of sentinels that timely and reliably detect outbreaks (small out-breaks at detection, short detection delays)] would be based on the former, rather than the latter. We show that a detection probability of 86% can be achieved by monitoring all 137 markets in the network. Additional 250 farm sentinels—selected according to their risk— need to be placed under surveillance so that the probability of first hitting one of these farm sentinels is at least as high as the probability of first hitting a market. Combining all markets and 1000 farms with highest risk of infection, these two levels together will lead to a detection probability of 99%. We conclude that the design of animal surveillance systems greatly ben-efits from the use of the existing abundant and detailed animal transport data especially in the case of highly dynamic cattle transport networks. Sentinel surveillance approaches can be tailored to complement existing farm risk-based and syndromic surveillance approaches.
Introduction
The transport of animals constitutes the backbone of the bovine industry. Animals are trans-ported not only to slaughterhouses, but also between specialized rearing farms, to common
a1111111111 a1111111111 a1111111111 a1111111111 a1111111111 OPEN ACCESS
Citation: Schirdewahn F, Lentz HHK, Colizza V,
Koher A, Ho¨vel P, Vidondo B (2021) Early warning of infectious disease outbreaks on cattle-transport networks. PLoS ONE 16(1): e0244999.https://doi. org/10.1371/journal.pone.0244999
Editor: Simon Clegg, University of Lincoln, UNITED
KINGDOM
Received: July 11, 2020 Accepted: December 19, 2020 Published: January 6, 2021
Copyright:© 2021 Schirdewahn et al. This is an open access article distributed under the terms of theCreative Commons Attribution License, which permits unrestricted use, distribution, and reproduction in any medium, provided the original author and source are credited.
Data Availability Statement: The data owners are
Swiss farmers and the cantons where they live. The Swiss conferedation collects this data from all cantons on the condition of confidentiality. Therefore, data access is restricted by Swiss law. Data cannot be made publicly available for ethical or legal reasons, as public availability would compromise participant privacy. More specifically, data can only be presented in anonymized form, no reference can be made to a specific holding and no detailed geographical maps where holdings could be singled out are allowed. However, raw data can be accessed exclusively for scientific purposes, by
pastures, to markets for trade and to exhibitions for evaluation and breading purposes. For dealers that facilitate the relocation of animals between farms, every trade is a source of reve-nue. For regions and countries that can be declared free of disease, free trade agreements exist to allow a relaxation of quarantine measures for the sake of a more agile economy and trade [1].
In Europe, animal transport networks have been shown to be highly heterogeneous [2–4]. In the case of the Swiss cattle, which will be the focal point of this paper, a small percentage of holdings is responsible for a large share of all animal transports [5,6]. Furthermore, the incoming and outgoing number of contacts per holding are correlated, leading to amplifica-tions in disease spread [7]. Besides, mass gathering events such as cattle markets are the prime risk factor for the spread of contagious diseases [6] and could potentially lead to super-spread-ing events (SSE, sensu, [8]) and thus, to explosive and large outbreaks. The role of markets has been recognized both in real outbreak studies (Foot and Mouth disease outbreak in Great Brit-ain in 2001 [9]) and animal transport network studies [10–12]. The role of highly connected holdings in outbreak control has also been explored [13]. Surveillance and control programs at the national level are needed for the early detection and control of infectious diseases out-breaks. While earlier studies have pointed out the role of markets in control of outbreaks (e.g. [14,15]), in this paper we focus on early warning.
In veterinary epidemiology, two different early warning approaches have been presented coming from different fields of research. On the one hand, the surveillance of syndromes (or syndromic surveillance) has recently been subject of a systematic review [16]. On the other hand, sentinel surveillance (informed by network analysis) is based on the analysis of animal transport data [6,17,18].
Syndromic surveillance is based on the (indirect) electronic monitoring and time series analysis of cases of syndromes (neurological, respiratory, digestive, also mortality and still-births data) within a time period. Several algorithms exist to estimate thresholds in the number of cases, above which an alarm is generated. The available data sets in Switzerland were evalu-ated by [19,20] who found that data quality and reporting delays negatively affect the perfor-mance. Even though the sensitivity of the system can be maximized by fine tuning the data processing, moderate specificity (or non-negligible false alarm rates) remains [21]. The focus of this field of research seems to have shifted towards situation awareness [16].
Sentinel surveillance, on the other hand, is a direct approach based on the analysis of ani-mal transport data (or social network analysis). It focuses on the selection of premises that would act as ‘guardians’ to detect threats or disease, hence, the name of ‘sentinel surveil-lance’. Two studies [17,18] analyzed the overlap of transmission chains in the network to define clusters that reduce epidemic variability. A very small number (18 to 36) of sentinel holdings proved to detect 65% of outbreaks within 13 days in a network of about 100’000 nodes [18]. A further study [6] found that dynamic measures such as the outgoing contact chain resulted in ca. 83% median outbreak detection. In human epidemiology, two recent studies [22,23] have evaluated different network-based surveillance strategies for early warning of outbreaks in temporal networks and found promising results in terms of the time difference (lead time) between the surveillance set and whole population in reaching 1% prevalence. Given the existence of long term time series of daily contacts for Swiss and European animal husbandry populations, sentinel surveillance provides an excellent approach that can be readily be applied.
Indeed, since 1999, when mandatory reporting of bovine transports was put into place in Europe and Switzerland [24], high quality time-stamped data at the animal level (from birth to death or slaughter) exists. Based on the chronology of the transports, potential chains of transmission can be reconstructed. This valuable information allows to shift the focus of
establishing a confidentiality agreement directly with the Swiss Confederation. To establish a confidentiality agreement and gain access to the data, please contactinfo@agatehelpdesk.chand
info@identitas.chURL for more information about the Swiss animal movement database (in German, Tier Verkehr Datenbank (TVD) or French, Banque de donne´es sur le traffic des animaux (BDTA)) can be found at the internet portal Agate from the Swiss Confederation:https://www.agate.ch/portal/ web/agate/homeand the enterprise Identitas AG:
https://www.identitas.ch/.
Funding: This work was supported by Deutscher
Akademischer Austauschdienst (DAAD) within the PPP-PROCOPE scheme (grant no. 57389088). FS, AK and PH acknowledge funding by Deutsche Forschungsgemeinschaft in the framework of Collaborative Research Center 910. BV was funded by the Veterinary Public Health Institute of the University of Bern. The funders had no role in study design, data collection and analysis, decision to publish, or preparation of the manuscript.
Competing interests: The authors have declared
surveillance programs from farms and geographical regions, to transmission chains for effec-tive early warning and control [25].
Traditionally, farms are the epidemiological units where disease control is implemented as the animal owner can be held accountable. Once animal transport information becomes avail-able, de-coupling surveillance from control becomes possible. This means that surveillance can be carried out at different types of premises or events, such as markets, and not only on the farms. This is especially advantageous for non-dairy farms that keep animals on semi-free range conditions on pastures, making sampling dangerous and time consuming [5]. A cross-sectional study that compared prevalence of sleeping sickness in villages and cattle markets in three districts in Uganda revealed that markets may be used as convenient sampling central points, especially for areas with emerging epidemics [26]. They found that in endemic areas, the prevalence at markets was higher than in the villages.
In the present study, we consider the case of cattle trade in Switzerland and propose a novel surveillance approach based on markets as proof of concept for an early warning system of emergent infectious diseases. By comparing a surveillance scheme based on markets to one based on farms, the aim of this paper is to identify the smallest set of sentinel holdings that would reliably and timely detect emergent disease outbreaks in Swiss cattle. In addition, we explore combinations of both markets and farms.
Materials and methods
Data sources
The animal movement database (in GermanTierverkehrsdatenbank (TVD) or in French Ban-que de données sur le traffic des animaux (BDTA)) constitutes the nationwide registry for cattle
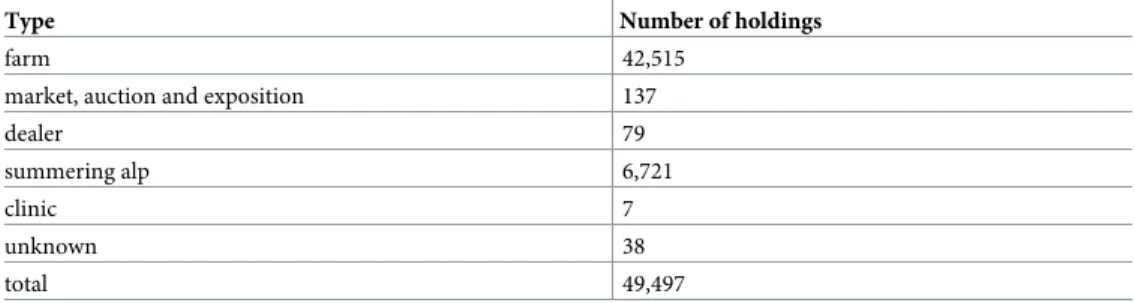
and other animals in Switzerland. Further details on this database can be found in [5–7,27]. We consider the Swiss in-country cattle transport data (excluding slaughter) over a period of four years starting at January 1 2012. The data set contains every transport of animals that occurred between two premises amounting to a total of 2,445,740 transport events and 49,497 reporting holdings. In addition to animal transport data, holding attributes are also available [28]. All holdings can be categorized by type as listed inTable 1. We focus on holdings labelled either ‘farm’ or ‘market’. The considered network is given as a directed time-dependent con-tact network with a holding of origin and a receiving holding. This time-dependent network defines a temporal, directed networkG = (V, E), consisting of a set of nodes V and
time-stamped edgesE.
Outbreak model
We evaluate the surveillance schemes by simulating disease outbreaks starting from every holding on the first Monday of every month (48 months in the considered four years time
Table 1. Number of reporting holdings and their type in the Swiss cattle-transport network 2012-2015.
Type Number of holdings
farm 42,515
market, auction and exposition 137
dealer 79 summering alp 6,721 clinic 7 unknown 38 total 49,497 https://doi.org/10.1371/journal.pone.0244999.t001
series). We opt for a data-driven simple spread model to present and evaluate network dynam-ics in a transparent way. In this sense, our study aims for a proof of concept rather than to a detailed depiction of reality.
We consider a generic SIR model at farm level, where each holding can be either susceptible S, infected I or recovered R, assuming perfect detection and ignoring within-herd dynamics. For the purpose of our study, we focused on the number of sentinel holdings required to detect an outbreak as efficient (in terms of number of farms) and timely as possible. We evaluate our surveillance schemes using three criteria: detection probability, number of days until detection and number of infected premises at detection. While a fast spreading disease would reach a sentinel node in a shorter time, it would have also infected a higher number of other premises spreading through the network.
A susceptible holding becomes infected if it has contact to an infected one with probability
β. After a fixed period τ, each infected holding becomes recovered from disease. The following
transition scheme shows the disease progression of individual farms or holdings:
S !b I !m R:
At the start of the simulation, all holdings are susceptible. The infection starts at one single holding.β denotes the probability to get infected and μ recovery probability. We set β = 1, thus assuming that a contact always leads to an infection. The number of holdings (total population size) is assumed constant (i.e. no births and deaths) during the course of the outbreak. We con-sider the recovery probability per node and time step to be 1 (μ = 1) on the seventh day after
infection, and zero otherwise. If outgoing connections from infected nodes happen within the infectious period of a holding, then the disease is transmitted to every susceptible receiving holding at each time-step. We opt to present results forτ = 7 so that the results are comparable
to previous studies [17,18]. The influence of the length of the infectious period on results was also assessed for a longer period (τ = 15) and our conclusions remained qualitatively
unchanged. Of all possible outbreaks (starting from each of the 49,497 existing holdings times at 48 possible starting points) most outbreaks are smaller than 10 infected holdings and die out before detection, thus nullifying the need of early warning (and control). Including all breaks in our results would falsely decrease both the detection probability and the median out-break size at detection. Thus, in order to calculate the detection probability, we consider only outbreaks of at least 10 infected holdings, which yields 43,842 outbreak events. We then calcu-late the detection probability as the proportion of all possible outbreaks (of at least 10 nodes) that infect at least one sentinel holding. Timeliness is measured as (1) the number of days elapsed since the start of the outbreak and (2) the number of holdings infected at time of detec-tion. Note that for the longer infectious period considered, 15 days, the number of outbreaks larger than 10 holdings increases to 177,600, which considerably increased computational time and memory.
Network metrics
We calculate the out-componentcout(vi,τ, t0) of a nodevias the set of nodes that can be
reached from a primary infected nodevi2V respecting the chronological order of the contacts
for the finite infectious periodτ equal to 7 days and for the total length of the time series
start-ing att0. This out-component corresponds to the final size of an outbreak originating from a
specific nodevi[2]. Similarly, the in-componentcin(vj,τ, t0) is the set of nodes from which a
particular nodevj2V can be infected respecting the chronological order of the contacts and
for the finite infectious time period considered. The size of the in-component is a measure of the vulnerability (risk of getting infected) of a node [2]. For each holding,t0is the time of the
primary infection. Finally, the in- and out-degree of every farm is calculated as the number of incoming and outgoing transports of a farm with some other farm, for the four years time series. The sum of in- and out-degrees of a farm provides a measure of transport activity (and thus of acquiring and spreading the disease) of that particular farm.
Surveillance schemes considered
Holdings are ranked and selected for surveillance according to (1) whether they are labelled as farms or markets, (2) largest sum of in- and out-degree, and (3) in addition, the largest vulner-ability. In this way, we define a ‘market sentinel surveillance’ as a surveillance based on mar-kets, which are ranked according to the sum of their in- and out-degree, and a surveillance based on farms or ‘farm sentinel surveillance’ based on farms only, ranked according to the sum of in- and out-degree and also according to the sum of in-degree, out-degree and vulnerability.
Results
During the four years time series (1.1.2012 to 31.12.2015) the daily number of outgoing trans-port events for markets (red dots) and all other holdings (green triangles) remains stable (Fig 1). The seasonal peaks in early summer and autumn are due to transports to and from pastures and have been described in [6].S1 Figshows a long-term increasing trend for the number of transported animals with maximum values at the end of the series of 103for markets and 105 for all other nodes. Both in terms of number of transports and number of animals transported, markets are responsible for a large share of the total traffic in spite of being in low numbers (only 137 markets during the observation period). Interestingly, traffic from the markets is fairly stable for any week and month of the time series.
Markets are active in each administrative region or canton both receiving and sending ani-mals within and/or between cantons (Fig 2andS2andS3Figs). Markets also deliver directly to slaughterhouses, usually to their own canton’s slaughterhouse. Since we excluded slaughter from the present analysis, six cantons did not show outgoing transports within their own canton.
Fig 1. Daily outgoing transports in the Swiss cattle network. From 1.1.2012 to 31.12.2015, the sum of outgoing
transport events that took place on each day for all markets (red dots) and all other holdings (green triangles) is plotted versus calendar time.
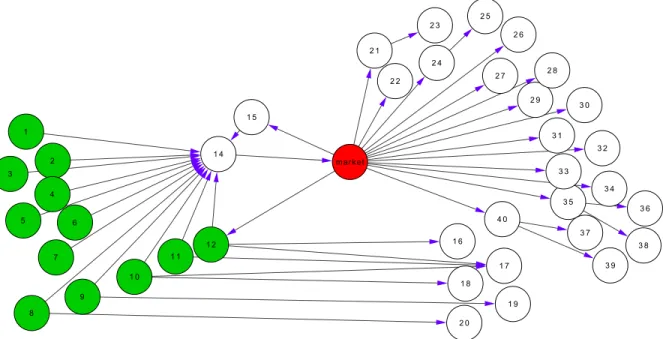
The role of markets in outbreak spread is schematically depicted inFig 3, which shows an example of a market found in the data with its in- and out-component. If an infection occurs at any of the green nodes, the market (red) will be infected early and potentially cause an explosive outbreak. Placing the market under surveillance allows early detection of the infec-tion and, provided control measures are implemented at the market, prevents the infecinfec-tion of downstream nodes via the market. Note that nodes may still be at risk via other transmission pathways. See, for instance, the five white nodes on the lower right that are reached directly from the initially infected nodes.
The in- and out-degrees (Fig 4(left)) of markets (red diamonds) and farms (with largest in-and out-degree marked by yellow stars) show a positive trend. Similarly, the vulnerability increases with the sum of in- and out-degree (Fig 4(right)). This increase is steeper for markets
Fig 2. Map of Switzerland and outgoing transports per administrative region (canton). The color gradient
indicates the sum of outgoing transports from the canton’s markets to other cantons (logarithmic scale, year 2012). The other years in the time series present a very similar pattern. The markets in the six cantons in white did not report outgoing transports to other regions (but were active otherwise). The data set excludes transport to slaughter. The map is created using publicly available information provided by opendata.swiss under BY licence [29].
https://doi.org/10.1371/journal.pone.0244999.g002
Fig 3. The role of markets in outbreak spread. Representation of one exemplary market (red node), which receives animals from 12 farms,
that is, 12 different initial locations (green nodes), even though some transports are channelled via specialized farms to the markets (node 14). Five of these initial locations have additional trade contacts besides the depicted market. The outbreaks follow the direction of the arrows.
(red dots). For the farm surveillance, farms were ranked according to the sum of in- and out-degree and also according to the sum of in-out-degree, out-out-degree and vulnerability, and selected starting from the maximum of either of these two criteria. Note that there are some blue nodes among the green group. They correspond to non-farm premises such as clinics, where tests are already performed, or summering alps that are only inhabited during the summer months and thus, are less suitable for surveillance [6].
The distributions of outbreak sizes for both farm surveillance and market surveillance are skewed towards low numbers as shown in the top and bottom panels ofFig 5, respectively. In this figure, 137 farm sentinels are selected according to the largest sum of in- and out-degree. Large outbreaks can be detected by either farm sentinels or market sentinels. The insets show the cumulative distribution of outbreak sizes. The vertical line marks an outbreak size of 10 holdings as a reference. It indicates that the vast majority of possible outbreaks (2,332,062 or equivalently 98.2%) is very small (10 holdings or less) and will not affect large parts of the net-work. In the following, we focus on outbreaks that include at least 10 holdings.
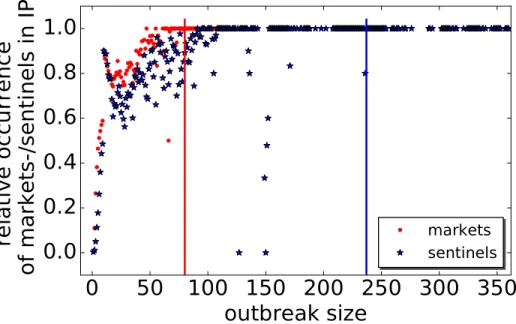
The probability of finding a node, which has been selected for monitoring, becomes larger with increasing outbreak size (Fig 6). The larger the outbreak, the more likely it is that it hits a node under surveillance. This probability increases more rapidly for markets (red dots) than for farm sentinels (blue stars). It reaches 100% for an outbreak size of 80 (red vertical line), whereas for farm sentinels the 100% mark is reached above an outbreak size of 240 (blue verti-cal line). In other words, any outbreak larger than 80 contains a market. This explains the bet-ter performance of market sentinels compared to farm sentinels.
The better performance of markets can be further explored by quantifying the time until detection. We find that a higher number of outbreaks is detected earlier and at smaller out-break sizes for the surveillance at 137 markets than for the farm surveillance with the same number of sentinels (cf.S4 Fig).
To corroborate the performance of both surveillance schemes,Fig 7depicts three measures in dependence on the number of sentinel nodes, which increases from 1 to 137: detection probability (left panel), time until detection (center panel) and outbreak size at detection (right
Fig 4. Scatter plots of degrees and vulnerability. Left panel: Positive trend of the out-degree versus the in-degree of each holding. Markets (red diamonds),
farms with largest in- and out-degree (yellow stars), all other holdings (black dots). Right panel: Positive trend of the vulnerability with the sum of the degrees. Markets (red circles), farms with the largest vulnerability and largest sum of degrees (green dots), all other holdings (blue). Both vulnerability and sum of degrees are normalized by their maximum values.
panel). We again observe that the market surveillance performs better (higher detection proba-bilities, lower detection delays and lower outbreak sizes at detection). This holds in particular for smaller numbers of nodes under surveillance. For market surveillance, the detection proba-bility reaches a high plateau at around 80% with as few as 20 markets under surveillance. The average detection delay plateaus at 7 days for both schemes above 60 sentinel nodes. The out-break sizes at detection are consistently around 25 infected nodes lower for market surveil-lance than for farm surveilsurveil-lance. The average outbreak size becomes minimal (8 vs. 31 infected nodes for market and farm sentinel surveillance, respectively) with 80 markets or more under surveillance.
Up to this point, we have considered the sum of in- and out-degree as a measure to identify adequate farm sentinels for surveillance. An alternative approach is to account for nodes with a high vulnerability. These are nodes that are infected from many sources and serve as promis-ing points of monitorpromis-ing. Thus, we explore the maximum detection probability that can be
Fig 5. Distribution of outbreak size. Histograms of sizes of all outbreaks (blue) and of outbreaks detected by farm sentinel surveillance (top panel, red) and market
surveillance (bottom panel, red). The insets show the cumulative distributions of outbreak size for all outbreaks (blue curves), farm sentinel surveillance (top panel, red curves), and market surveillance (bottom panel, red curve). The vertical lines in the insets mark the outbreak size equal to 10 infected holdings as a reference.
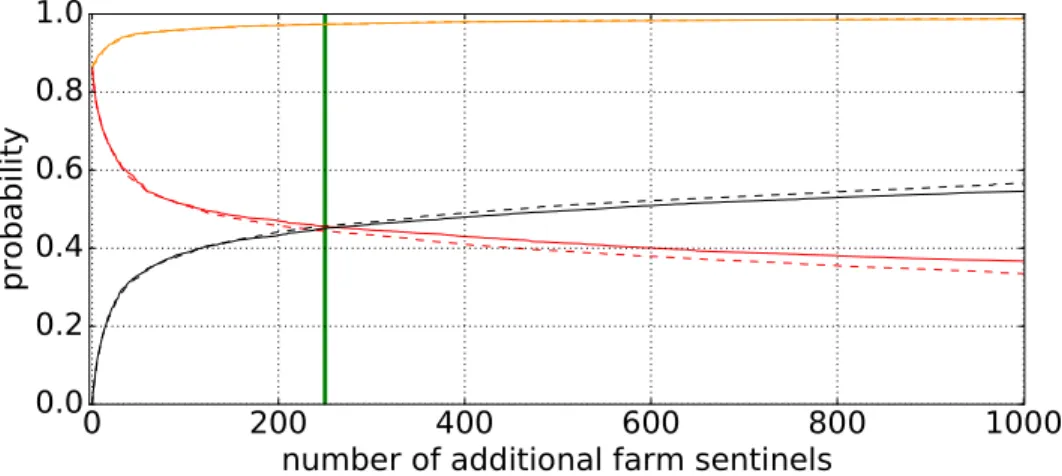
achieved by starting with 137 sentinel markets and adding—one at a time—additional sentinel farms up to 1,000 (cf.Fig 8). Placing additional sentinel farms under surveillance is done according to (i) the largest sum of in- and out-degree (solid curves) and (ii) the largest vulnera-bility as an additional criterion (dashed curves). The total detection probavulnera-bility (orange curve) increases progressively to a maximum of 99%. This means that over the course of the four years observation period, almost every possible outbreak larger than 10 farms, could have been detected with 137 markets and 1,000 additional farm sentinels. Besides, the average detection delay is reduced from 7 days (cf.Fig 7) to 4.2 days and the average outbreak size at detection is reduced from 8 (cf.Fig 7) to 3.3 holdings. An additional effect of adding farm sentinels is that the outbreaks can be detected at a farm (instead of at a market). As the number of additional farm sentinel increases, the probability of first hitting a farm (black curves) increases as well. The probability of first hitting a farm equals the probability of first hitting a market at 250 additional sentinel farms (green vertical line inFig 8).
Discussion
Our results show that surveillance placed on markets leads to an earlier detection of outbreaks compared with surveillance placed on farms—and this even with a smaller number of nodes. Moreover, the detection probability is much higher for market based surveillance, and the out-breaks are detected earlier on average, both in terms of detection delay (8 days) and outbreak size at detection (ca. 20 infected holdings) (cf.Fig 7). Since markets typically occur early in infection paths in our simulations (cf.Fig 6), they are suitable points for an effective outbreak detection. In order to assure the overall coverage of markets, we have shown that markets cover the trade network in terms of their temporal (cf.Fig 1) and spatial presence (cf.Fig 2,
S3 Fig).
The idea of using animal transport data to inform risk-surveillance programs (although not necessarily for early warning) has been discussed in Fro¨ssling et al. [30]. The authors propose to calculate the probability of disease of a particular destination herd, based on (i)
Fig 6. Probability of finding a market (red dots) and farm sentinel (blue stars) versus outbreak size. The vertical
lines indicate the outbreak size above which 100% detection is achieved (red line for markets at an outbreak size of 80 premises, blue line for farm sentinels at an outbreak size of 237 premises).
animal transports of specific (relevant) time periods, and (ii) the prevalence of disease on dif-ferent levels (typically within herd and between herds). They calculate theprobability of dis-ease ratio, as a ratio that measures the relative incrdis-ease in probability of disdis-ease. However,
these calculations assume a non-negligible prevalence and are therefore not adequate for early warning.
Fig 7. Detection probability, detection delay and outbreak size at detection. From left to right: Detection probability, average detection delay (days) and average
number of infected nodes (until detection) for an increasing number of sentinel farms and markets; market surveillance (red circles) and farm sentinel surveillance (blue stars). Both markets and farm sentinels are sorted by highest sum of in- and out-degree.
In this paper we have used node attributes from the data to label markets as such. It should be noted that the term ‘market’ as it is used here encompasses a variety of animal and animal holder gatherings for various purposes (such as expositions or auctions). Even though some European countries have abolished trade or slaughter-markets as such (e.g. Germany or Swe-den), other animal gatherings like expositions or fairs do exist in European countries. Within the trade network all the mentioned events act as markets from a topological perspective, that is, they have a similar position within the network.
Our simple epidemic model allows us to evaluate the network properties in a transparent way. Other factors like additional time delays (in reporting of the transport data, or reporting of suspected cases, or the laboratory confirmation of the suspected cases), detection compli-ance, within-herd dynamics, varying herd sizes and test efficiency have not been taken into account. A disease-specific model with within-herd dynamics and varying scenarios could address these aspects in the future.
The present work is a proof of concept and of rather theoretical nature. From a more practi-cal perspective, the role of markets as sentinels has been discussed in [26] for an Ugandan trade network. The authors found that infected animals accumulate at markets due to the fact that farmers try to repeatedly sell low-performing animals. This higher prevalence at the kets can be advantageous for early warning. Similar to risk surveillance, sampling at such mar-kets means sampling at places with a higher probability to find infected animals.
In a practical context, the selection of sentinels depends on the public health goal, the net-work topology, and the properties of the considered disease [22]. A further criterion is data availability, as it allows for the evaluation of different schemes and also determines whether a scheme is realistic or not. Our results highlight the importance of the holding categories data being available, in addition to the transport data. The public health goal chosen in the present study is early warning and we show that reliable outbreak detection at farm level (99% detec-tion probability) is possible at very low farm prevalence. This is well below the limits of the free trade agreement of 0.1% (necessary to substantiate freedom of disease, [1]) (cf. Results: average outbreak size at detection 3.3 infected holdings out of 49,497, i.e. 0.008% prevalence at detection).
Fig 8. Probability of first hitting a market or a farm sentinel. The red and black curves show the probability of
outbreaks to first hit a market or a farm sentinel, respectively. The green vertical line marks the crossover, when a farm sentinel is detected first. Schemes are based on the highest sum of in- and out-degree (solid curves) and in addition, the largest vulnerability (dashed curves). Detection probability (orange curve) starting with 137 markets and adding one farm sentinel at a time.
Conclusion
We conclude that especially in the case of highly dynamic cattle transport networks the design of animal surveillance systems would greatly benefit from the use of the abundant and detailed animal transport data available. Sentinel surveillance approaches can be tailored to comple-ment other farm risk-based and syndromic surveillance approaches. Specifically, Switzerland’s early warning system would profit from combining surveillance at farms with that at markets. Future studies should address the cost-effectiveness and practicability of surveillance based at markets for specific diseases, both emergent or production diseases.
Supporting information
S1 Fig. Daily outgoing number of animals in the Swiss cattle network. From 1.1.2012 to
31.12.2015, the total number of outgoing animals that took place in each day for all markets (red dots) and all other holdings (green triangles).
(EPS)
S2 Fig. Map of Switzerland and cattle transports per administrative region (canton).
Transports within canton (size of orange circles) and transports to other cantons (size of black arrows) from each canton’s markets (logarithmic scale—year 2012). The data set excludes slaughter. All other years follow a very similar pattern. Canton St. Gall had the largest sum and is plotted in separately inS3 Fig. The map is created using publicly available information pro-vided by opendata.swiss under BY licence [29].
(EPS)
S3 Fig. Map of Switzerland and market cattle transports, canton St. Gall. Transports within
each canton (size of orange circles) and transports to other cantons (size of black arrows) from the markets of canton St Gall (logarithmic scale—only year 2012). All other years present a similar pattern. The data set excludes transport to slaughter. The map is created using publicly available information provided by opendata.swiss under BY licence [29].
(EPS)
S4 Fig. Detection performance of market vs. farm sentinels. Heat maps of the number of
detected outbreaks in relation to outbreak size at detection and detection time in days for both surveillance schemes: 137 farm sentinels (left panel) and 137 markets (right panel).
(EPS)
Acknowledgments
We thank G. Schu¨pbach, S. Redmond and C. Beglinger and J. Bassett for helpful discussions and two anonymous reviewers for their comments on the manuscript.
Author Contributions
Conceptualization: Frederik Schirdewahn, Hartmut H. K. Lentz, Vittoria Colizza, Andreas
Koher, Philipp Ho¨vel, Beatriz Vidondo.
Data curation: Frederik Schirdewahn, Beatriz Vidondo.
Formal analysis: Frederik Schirdewahn, Vittoria Colizza, Andreas Koher, Philipp Ho¨vel, Bea-triz Vidondo.
Investigation: Frederik Schirdewahn, Hartmut H. K. Lentz, Vittoria Colizza, Andreas Koher,
Philipp Ho¨vel, Beatriz Vidondo.
Methodology: Frederik Schirdewahn, Hartmut H. K. Lentz, Vittoria Colizza, Andreas Koher,
Philipp Ho¨vel, Beatriz Vidondo.
Project administration: Philipp Ho¨vel. Resources: Vittoria Colizza, Philipp Ho¨vel. Software: Frederik Schirdewahn, Andreas Koher. Supervision: Philipp Ho¨vel, Beatriz Vidondo. Validation: Philipp Ho¨vel, Beatriz Vidondo.
Visualization: Frederik Schirdewahn, Vittoria Colizza, Philipp Ho¨vel, Beatriz Vidondo.
Writing – original draft: Frederik Schirdewahn, Philipp Ho¨vel, Beatriz Vidondo.
Writing – review & editing: Hartmut H. K. Lentz, Vittoria Colizza, Philipp Ho¨vel, Beatriz
Vidondo.
References
1. European Community. Agreement between the European Community and the Swiss Confederation on trade in agricultural products. Official Journal of the European Communities. 2002; p. L114–132.
2. Konschake M, Lentz HHK, Conraths FJ, Ho¨ vel P, Selhorst T. On the robustness of in-and out-compo-nents in a temporal network. PLoS ONE 2013; 8(2):e55223.https://doi.org/10.1371/journal.pone. 0055223
3. Dutta BL, Ezanno P, Vergu E. Characteristics of the spatio-temporal network of cattle movements in France over a 5-year period. Prev Vet Med 2014; 117(1):79–94.https://doi.org/10.1016/j.prevetmed. 2014.09.005
4. Knific T, Ocepek M, Kirbis A, Lentz HH. Implications of cattle trade for the spread and control of infec-tious diseases in Slovenia. Front Vet Sci 2019; 6:454.
5. Scha¨rrer S, Widgren S, Schwermer H, Lindberg A, Vidondo B, Zinsstag J, et al. Evaluation of farm-level parameters derived from animal movements for use in risk-based surveillance programmes of cattle in Switzerland. BMC Vet Res 2015; 11(1):149.https://doi.org/10.1186/s12917-015-0468-8PMID:
26170195
6. Vidondo B, Voelkl B. Dynamic network measures reveal the impact of cattle markets and alpine sum-mering on the risk of epidemic outbreaks in the Swiss cattle population. BMC Vet Res 2018; 14(1):88.
https://doi.org/10.1186/s12917-018-1406-3
7. Vidondo B. Amplification of the basic reproduction number in cattle farm networks. PLoS ONE 2018; 13 (4):e0191257.https://doi.org/10.1371/journal.pone.0191257
8. Lloyd-Smith JO, Schreiber SJ, Kopp PE, Getz WM. Superspreading and the effect of individual variation on disease emergence. Nature 2005; 438(7066):355.https://doi.org/10.1038/nature04153
9. Gibbens J, Wilesmith J, Sharpe C, Mansley L, Michalopoulou E, Ryan J, et al. Descriptive epidemiology of the 2001 foot-and-mouth disease epidemic in Great Britain: the first five months. Vet Rec 2001; 149 (24):729–743.https://doi.org/10.1136/vr.149.24.729PMID:11808655
10. Robinson S, Christley R. Exploring the role of auction markets in cattle movements within Great Britain. Prev Vet Med 2007; 81(1-3):21–37.https://doi.org/10.1016/j.prevetmed.2007.04.011
11. No¨remark M, Ha¨kansson N, Sternberg S, Lindberg A, Jonsson A. Network analysis of cattle and pig movements in Sweden: Measures relevant for disease control and risk based surveillance. Prev Vet Med 2011; 99:78–90.https://doi.org/10.1016/j.prevetmed.2010.12.009
12. Mweu MM, Fournie´ G, Halasa T, Toft N, Nielsen SS. Temporal characterisation of the network of Dan-ish cattle movements and its implication for disease control: 2000–2009. Prev Vet Med 2013; 110(3-4):379–387.https://doi.org/10.1016/j.prevetmed.2013.02.015
13. Natale F, Giovannini A, Savini L, Palma D, Possenti L, Fiore G, et al. Network analysis of Italian cattle trade patterns and evaluation of risks for potential disease spread. Prev Vet Med 2009; 92(4):341–350.
14. Gates MC, Woolhouse ME. Controlling infectious disease through the targeted manipulation of contact network structure. Epidemics 2015; 12:11–19.https://doi.org/10.1016/j.epidem.2015.02.008
15. Rautureau S, Dufour B, Durand B. Vulnerability of animal trade networks to the spread of infectious dis-eases: a methodological approach applied to evaluation and emergency control strategies in cattle, France, 2005. Transbound Emerg Dis 2011; 58(2):110–120.https://doi.org/10.1111/j.1865-1682.2010. 01187.x
16. Do´rea FC, Vial F. Animal health syndromic surveillance: a systematic literature review of the progress in the last 5 years (2011–2016). Vet Med 2016; 7:157.
17. Bajardi P, Barrat A, Savini L, Colizza V. Optimizing surveillance for livestock disease spreading through animal movements. J R Soc Interface 2012; 9(76):2814–2825.https://doi.org/10.1098/rsif.2012.0289
18. Schirdewahn F, Colizza V, Lentz HHK, Koher A, Belik V, Ho¨ vel P. Surveillance for outbreak detection in livestock-trade networks. In: Temporal Network Epidemiology. Springer; 2017. p. 215–240.
19. Struchen R, Reist M, Zinsstag J, Vial F. Investigating the potential of reported cattle mortality data in Switzerland for syndromic surveillance. Prev Vet Med 2015; 121(1-2):1–7.https://doi.org/10.1016/j. prevetmed.2015.04.012
20. Struchen R, Vial F, Andersson MG. Value of evidence from syndromic surveillance with cumulative evi-dence from multiple data streams with delayed reporting. Sci Rep 2017; 7(1):1191.https://doi.org/10. 1038/s41598-017-01259-5
21. Struchen R. Development of a syndromic surveillance system to enhance early detection of emerging and re-emerging animal diseases. PhD Thesis, University of Basel; 2015.
22. Herrera JL, Srinivasan R, Brownstein JS, Galvani AP, Meyers LA. Disease surveillance on complex social networks. PLoS Comput Biol 2016; 12(7):e1004928.https://doi.org/10.1371/journal.pcbi. 1004928
23. Bai Y, Yang B, Lin L, Herrera JL, Du Z, Holme P. Optimizing sentinel surveillance in temporal network epidemiology. Sci Rep 2017; 7:4804.https://doi.org/10.1038/s41598-017-03868-6
24. Anonymous. Regulation (EC) No 1760/2000 of the European Parliament and of the Council of 17 July 2000 establishing a system for the identification and registration of bovine animals and regarding the labelling of beef and beef products and repealing Council Regulation (EC) No 820/97.;. Available from:
https://eur-lex.europa.eu/homepage.html?locale=en.
25. Lentz HHK, Konschake M, Teske K, Kasper M, Rother B, Carmanns R, et al. Trade communities and their spatial patterns in the German pork production network. Prev Vet Med 2011; 98(2-3):176–181.
https://doi.org/10.1016/j.prevetmed.2010.10.011PMID:21111498
26. Fèvre EM, Picozzi K, Jannin J, Welburn S, Maudlin I. Human African trypanosomiasis: epidemiology and control. Adv Parasitol 2006; 61:167–221.https://doi.org/10.1016/S0065-308X(05)61005-6
27. Anonymous. Swiss Confederation, Internet portal Agate [Internet].;. Available from:https://www.blw. admin.ch/blw/de/home/politik/datenmanagement/agate.html.
28. Anonymous. Swiss Confederation, Federal Office for Food Safety and Veterinary Affairs [Website], Agrarpolitisches Informationssystem (AGIS);. Available from:https://www.blw.admin.ch/blw/de/home/ politik/datenmanagement/agate/agis.html.
29. Opendata.swiss. Data file:http://data.geo.admin.ch/ch.swisstopo-vd.ortschaftenverzeichnis_plz/data. zip.
30. Fro¨ssling J, Nusinovici S, No¨remark M, Widgren S, Lindberg A. A novel method to identify herds with an increased probability of disease introduction due to animal trade. Prev Vet Med 2014; 117(2):367–374.