HAL Id: hal-01136551
https://hal.archives-ouvertes.fr/hal-01136551
Submitted on 6 May 2020
HAL is a multi-disciplinary open access
archive for the deposit and dissemination of
sci-entific research documents, whether they are
pub-lished or not. The documents may come from
teaching and research institutions in France or
abroad, or from public or private research centers.
L’archive ouverte pluridisciplinaire HAL, est
destinée au dépôt et à la diffusion de documents
scientifiques de niveau recherche, publiés ou non,
émanant des établissements d’enseignement et de
recherche français ou étrangers, des laboratoires
publics ou privés.
Characterization of heat sources in the crack tip zone in
stretched NR and SBR rubbers
Jose Ricardo Samaca Martinez, Xavier Balandraud, Evelyne Toussaint,
Jean-Benoit Le Cam, Daniel Berghezan
To cite this version:
Jose Ricardo Samaca Martinez, Xavier Balandraud, Evelyne Toussaint, Jean-Benoit Le Cam, Daniel
Berghezan. Characterization of heat sources in the crack tip zone in stretched NR and SBR rubbers.
European Conference on Constitutive Models for Rubber IX, Sep 2015, Prague, Czech Republic.
�hal-01136551�
Characterization of heat sources in the crack tip zone
in stretched NR and SBR rubbers
J.R. Samaca Martinez
Clermont Université, Institut Français de Mécanique Avancée, Université Blaise Pascal, Institut Pascal, CNRS, UMR 6602, Clermont-Ferrand, France
Michelin, CERL Ladoux, Clermont-Ferrand, France
X. Balandraud & E. Toussaint
Clermont Université, Institut Français de Mécanique Avancée, Université Blaise Pascal, Institut Pascal, CNRS, UMR 6602, Clermont-Ferrand, France
J.-B. Le Cam
Université De Rennes 1, Institut de Physique de Rennes, UMR 6251, Campus de Beaulieu, Rennes, France
D. Berghezan
Michelin, CERL Ladoux, Clermont-Ferrand, France
ABSTRACT: The study deals with the experimental characterization of heat sources produced in a crack tip zone of two types of carbon black filled rubbers: a Styrene Butadiene Rubber (SBR) and a Natural Rubber (NR). For this purpose, full thermal and kinematic field measurements were performed. In NR, crystallisation increases the stiffness in the crack tip zone and consequently decreases the maxi-mum stretch ratio. For SBR specimen, the maximaxi-mum stretch ratio level at the crack tip is higher than that measured at specimen failure during homogeneous uniaxial tensile tests. During loading, the maximum temperature change is lower in NR specimen than in SBR specimen. For both materials, the heat sources in the crack tip zone remain positive during unloading. This was not observed for homogeneous tests. This phenomenon is due to the very high mechanical dissipation production, and to crystallisation at the beginning of unloading in the case of NR.
1 INTRODUCTION
Elastomers are materials that exhibit a specific ther-mal sensitivity related to numerous properties such as entropic elasticity, viscosity, stress softening, as well as strain-induced crystallisation under certain conditions. As regards fracture mechanics in rubbers, the main approach which is developed in the litera-ture is based on the tearing energy (Rivlin & Thomas 1953). However, the mechanical energy which is involved at the crack tip can be in part mechani-cally dissipated into heat because of damage, viscous effects and possibly local stress softening, which is not taken into account in the tearing energy. The local measurement of the heat sources produced or absorbed in the crack tip zone can therefore provide information of paramount importance for fracture mechanics in rubber. Such measurements can be performed using full-field measurement techniques (Le Cam 2012, Toussaint et al. 2012).
The aim of the present study was to character-ize the thermomechanical response of two types of
carbon black filled rubbers in the crack tip zone: Styrene Butadiene Rubber (SBR) and Natural Rubber (NR), this latter being crystallisable under strain. For this purpose, full thermal and kinematic field measurements were performed at constant ambient temperature.
The kinematic analysis focuses on the heterogene-ity of the strain states and on the level of maximum stretch ratio reached in the crack tip zone, as well as on possible differences between the loading phase and the unloading phase. The calorimetric analysis focuses on the localization and the intensity of the high heat sources in the crack tip zone, and on total heat produced over a mechanical cycle.
2 EXPERIMENTAL SETUP
2.1 Materials and specimen geometry
Two types of carbon black filled rubbers were tested: Styrene Butadiene Rubber (SBR) and Nat-ural Rubber (NR), both cured for 22 min at 150°C.
S02_CH008_LeCam.indd 69
S02_CH008_LeCam.indd 69 6/27/2015 12:29:34 PM6/27/2015 12:29:34 PM
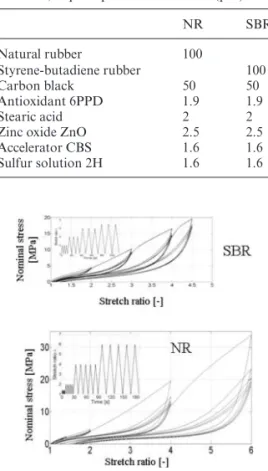
Table 1 summarizes their chemical compositions. It can be seen that, apart from the base material, their formulations were the same. In particular, they were reinforced by the same amount of carbon black fillers. Both materials are subject to viscosity, stress-softening and Mullins effect. Figure 1 shows the preliminary characterization under homogene-ous tensile tests (Samaca Martinez et al. 2014a). Note that NR is subject to strain-induced crystal-lization, leading to an increase in stiffness.
The geometry of the specimens used in the present study is presented in Figure 2. The width, height and thickness were equal to 80 mm, 13 mm and 2 mm, respectively. This corresponds to classic Pure Shear (PS) geometry. The specimens were notched at one of their sides using a razor blade prior to testing. The initial crack length was about 8 mm. This unde-formed state geometry was considered as the refer-ence configuration in the present study.
2.2 Loading conditions
A load-unload cycle was applied under imposed uniaxial displacement using a 500N Instron 5543
Table 1. Chemical composition of the two tested materials, in parts per hundred rubber (phr).
NR SBR Natural rubber 100 Styrene-butadiene rubber 100 Carbon black 50 50 Antioxidant 6PPD 1.9 1.9 Stearic acid 2 2
Zinc oxide ZnO 2.5 2.5
Accelerator CBS 1.6 1.6
Sulfur solution 2H 1.6 1.6
Figure 1. Preliminary characterization under homoge-neous tensile tests on NR and SBR specimens.
Figure 2. Specimen geometry.
Figure 3. Experimental setup.
testing machine (see Fig. 3). The signal shape was triangular in order to ensure a global constant strain rate during loading and unloading. The maximum global stretch ratio λg= L/L0 was equal to 1.5. The
global strain rate was equal to ±0.26 s−1.
2.3 Displacement and temperature measurements The kinematic fields were measured using the Dig-ital Image Correlation (DIC) technique, which consists of correlating the grey levels between two different images of an observed region of the speci-men surface named “Region of Interest” (ROI) (Sutton et al. 1983). Images were recorded using a cooled 16-bit PCO-Edge sCMOS camera. The sensor of the camera features 2650 × 2160 pixels. The acquisition frequency fa was set to 50 Hz. The
software employed for the correlation process was SeptD (Vacher et al. 1999). A set of sub-images was considered to determine the displacement field of a given image with respect to a reference image. Each sub-image is referred to as a “Zone of Interest” (ZOI). A bilinear correlation func-tion was employed to calculate the displacement of the centre of a given ZOI between the two images.
S02_CH008_LeCam.indd 70
S02_CH008_LeCam.indd 70 6/27/2015 12:29:34 PM6/27/2015 12:29:34 PM
Correlation parameters were chosen to reach a spatial resolution of 10 pixels, corresponding to 101 μm. Temperature measurements were carried out using a Cedip Jade III-MWIR infrared (IR) camera, featuring 320 × 240 pixels and detectors with a wave length range of 3.5–5 μm. The same acquisition frequency fa as for the kinematic
meas-urements was chosen: 50 Hz. In fact, each recorded image is the average of two successive images cap-tured at 100 Hz to improve the resolution of the measurement. The calibration of the camera detec-tors was performed using a black body and employ-ing a two-point Non-Uniformity Correction (NUC) procedure. The spatial resolution of the tempera-ture fields is the size of the pixel on the surface of the specimen. It was here equal to 62.5 μm. 2.4 Heat source reconstruction
The thermal quantity used to calculate heat sources is actually the temperature change with respect to the initial temperature map in the reference configuration. Since the specimen undergoes large deformations and as the thermal fields are captured in the deformed configuration, the correspond-ence between the current geometry and the refer-ence geometry must be implemented: see Figure 4. A motion compensation technique was developed to follow the temperature change at any material point (Toussaint et al. 2012). The output is used further to construct the heat source fields in the reference configuration, using the heat diffusion equation. The three-dimensional version of this equation can be written (Chrysochoos & Louche 2000, Samaca Martinez et al. 2014b, Samaca Martinez et al. 2015)
ρ0 ρ C T t R S Vk , ∂ ∂ −Div
(
(
0 T)
R= (1) where:• S and R are the total heat source produced or absorbed by the material due to stretch and the external heat source by radiation, respectively. S is composed of two parts: thermo-mechani-cal couplings and mechanithermo-mechani-cal dissipation (also named intrinsic dissipation);
• ρ0 is the density of the material, K0 the thermal
conductivity tensor and CE,Vk the specific heat at
constant strain E and Vk (Vk are the other state
variables characterizing the state of the material apart from temperature and strain).
In the case of a thin specimen in the plane (X, Y), Equation 1 can be reduced to the follow-ing two-dimensional formulation from several hypothesis (Samaca Martinez et al. 2014b, Samaca Martinez et al. 2015): ρ θ θ τ θ 0 ρ 2 τ 0 2 C t k0 2 θ S E V C VVk D D , ∂ ∂ + ⎛ ⎝⎜ ⎛⎛ ⎝⎝ ⎞ ⎠⎟ ⎞⎞ ⎠⎠− k0 2 θ (2) where
• θ (X, Y, t) is the field of temperature change with respect to the initial temperature map; • Δ2D is the Laplacian operator in the specimen
plane in the (X, Y) Lagrangian coordinate system;
• k0 is the thermal conductivity coefficient of the
material assumed to be isotropic;
• τ2D is a time constant which characterizes the
heat exchanges by convection with the air at the specimen surface.
By dividing Equation 2 by ρ0CE,Vk., it comes
∂ ∂ + − = θ θ τ θ ρ t D S C D D E V C VVk 2 τ DD0 2 0 ρ Δ , (3)
where D0 is the thermal diffusivity coefficient of the
material. The heat source S is expressed in W/m3.
However this quantity can be expressed in °C/s by dividing it by ρ0CE,Vk. This unit enables us to directly
read the temperature rate that would be observed in the case of adiabatic variation.
3 RESULTS
3.1 Kinematical results
Figure 5 presents the map of local strain states obtained from the kinematical measurements for both materials (Samaca Martinez et al. 2014b, Samaca Martinez et al. 2015). We observe that the mechanical strain state at any material point of the gauge zone ranges between PS (pure shear) and UT (uniaxial tension). As expected, the zone which is far from the crack tip is in PS in the (X,Y) plane. The representation adopted in this figure enables us to define the zone of influence of the crack. It cor-responds to the zone which is not in PS. It extends about 8 mm from the crack tip. The zones above and below the crack lips are in UT. At the crack tip, the strain state is close to PS in plane (X,Z).
Figure 4. Regions of interest.
S02_CH008_LeCam.indd 71
S02_CH008_LeCam.indd 71 6/27/2015 12:29:36 PM6/27/2015 12:29:36 PM
It can be seen from Figure 7 that λmax is lower in
the NR specimen than in the SBR specimen: 5.1 compared to 9.5 for the maximum load. This can be explained by crystallization in the NR specimen, which increases the stiffness in the crack tip zone. Thus, in terms of heat production, crystallization acts in two opposite ways in the crack tip zone. On the one hand, crystallization locally produces additional heat. On the other hand, the increase in stiffness resulting from crystallization reduces the local level of stretching, thus reducing the quantity of heat produced by the material.
3.2 Calorimetric results
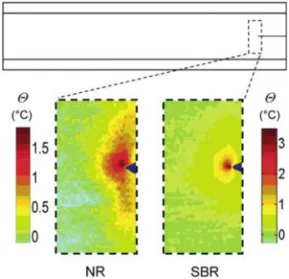
Figure 8 presents the comparison between the maps of temperature change θ of the two specimens near the crack tip, for the maximum load. It can be seen that the ‘hot’ zone is larger in the NR specimen than in the SBR specimen. This can be explained by the fact that crystallization occurs in a large zone around the crack tip in NR (Trabelsi et al. 2002).
Figure 5. Maps of local strain states obtained from the kinematical measurements.
Figure 6. Kinematic results obtained for the SBR speci-men: a) map of maximum stretch ratio λmax for the
maxi-mum load, b) evolution of λmax at two points A and B.
Figure 7. Comparison between NR and SBR in terms of evolution of λmax at the two points A and B.
Figure 8. Comparison between NR and SBR specimens in terms of map of temperature change θ near the crack tip for the maximum load.
Figure 6a presents the map of the maximum stretch ratio λmax for the maximum load. λmax is
quite homogeneous over all the specimen sur-face except in the vicinity of the crack tip zone.
Figure 6b presents the variation in the maximum stretch ratio at two different points. Point A is located out of the zone of influence of the crack and point B is located in the crack tip zone, where its value is the highest. Three comments can be made from this figure:
• at point A, the variation corresponds to the glo-bal stretch ratio variation;
• at point B, the maximum stretch ratio for the max-imum load is equal to 9.5. It must be noted that even if this value depends on the data processing (chosen correlation parameters), it is much higher than the stretch ratio at failure in a homogeneous PS test (approximately 5). In the latter case, fail-ure occurs from the lowest mechanical strength zone. This high stretch ratio value corresponds to the limit of chain extensibility. Indeed, by fitting the stress-strain curves obtained with constitu-tive models to reflect limiting chain extensibility (Gent 1996), the maximum chain extensibility corresponds to a stretch ratio of about 10; • at point B, the curve shape between loading and
unloading is not symmetrical.
S02_CH008_LeCam.indd 72
S02_CH008_LeCam.indd 72 6/27/2015 12:29:37 PM6/27/2015 12:29:37 PM
Figure 9. Heat source map in the SBR specimen for the maximum load. The maximum value of the heat source is equal to 56°C/s but the colour scale is limited to 20°C/s for a better visualization of the heat source localization.
Figure 10. Heat source versus time at the crack tip for SBR.
Figure 9 shows the heat source map in the SBR specimen for the maximum load. Two profiles enable us to observe the heat source concentration near the crack tip. A strong localization is observed very close to the crack tip. The heat source locali-zation corresponds to a zone of about 7 pixels (horizontal profile A–A) by 5 pixels (vertical pro-file B–B), corresponding to about 0.44 × 0.32 mm2.
Outside this zone, the heat sources are negligible compared to the maximum heat source, which is equal to 56°C/s.
Figure 10 presents the variation in time of the heat source in the crack tip vicinity at point B (see Fig. 6), where the heat source value is the highest. Some comments can be made for the loading phase: • the heat source first slightly and quasi-linearly
increases. This is in agreement with heat sources due to entropic coupling (Samaca Martinez et al.
Figure 11. a) Heat source map in the NR specimen for the maximum load, b) Comparison between NR and SBR in terms of evolution the heat source in the crack tip zone.
2013a, Le Cam et al. 2013), with possible addi-tional small mechanical dissipation;
• the heat source then strongly increases. It can be split into two contributions: that of the entropic coupling and that of the mechanical dissipation, if any. The former quantity is positive for a posi-tive strain rate. The latter is always posiposi-tive as it is related to mechanical irreversibilities, such as damage or viscosity.
Figure 10 also shows that the heat source remains positive during the unloading phase: first it strongly decreases, then progressively returns to zero. The entropic coupling heat source is expected to be negative since the strain rate is negative. This means that, during unloading, there is the produc-tion of a (positive) mechanical dissipaproduc-tion whose amplitude is higher than the entropic coupling term. This result shows that the crack tip is a zone which always produces heat during cyclic tests, favouring the self-heating of this zone. Consequently, this zone is probably more affected by phenomena such as thermo-oxidation. To the best of the authors’ knowledge, this result has never been reported in the literature.
Figure 11a shows the heat source map for the maximum load in the NR specimen, for compari-son purposes with the SBR specimen. The zone of the highest values corresponds to the vicinity of the crack tip. The fact that the maximum value (equal to about 8°C/s) is not exactly located at the crack tip but slightly shifted upwards is not interpretable due to the fact that the spatial resolution is greater than the distance between the point at which the heat source is maximum and the crack tip (Samaca Martinez et al. 2014b). The zone of high heat source around the crack tip is less localized that in SBR specimen. It can be noted that its size is close to the size of the crystallized zone observed by Trabelsi et al. (2002). Its size and shape are also close to those of the crystallized zone observed by Rublon et al. (2013).
S02_CH008_LeCam.indd 73
S02_CH008_LeCam.indd 73 6/27/2015 12:29:40 PM6/27/2015 12:29:40 PM
Figure 11b shows that the heat source level at the crack tip is lower in the NR specimen than in the SBR specimen. For both specimens, the heat sources remain positive and high at the beginning of unloading. It can be noted that in the NR specimen, this phenomenon lasts longer. This can be explained by the continuation of the crystallization process. Even though the maximum stretch ratios are differ-ent in NR and SBR, the heat sources at the crack tip remain positive at the beginning of unloading.
4 CONCLUSION
Infrared thermography and digital image correla-tion have been used simultaneously to analyse the thermomechanical behaviour at the crack tip of a filled crystallisable rubber (NR) and a filled non-crystallisable rubber (SBR). Both specimens were subjected to the same load-unload mechanical cycle. Several results were obtained:
• the calorimetric results showed that the heat produced in the crack tip zone is lower for the NR specimen than for SBR;
• the ‘hot’ zone is larger in NR50, due to strain-induced crystallization;
• even though strain-induced crystallization pro-duces additional heat, crystallites act as fill-ers and increase stiffness in the crack tip zone, which leads to a decrease in the stretch level in this zone. In other words, crystallization acts in two opposite ways in terms of heat production. This is an important consideration for the study of the self-heating of cracked rubbers subjected to fatigue loadings;
• it was observed that, similarly to crystallisable SBR, the heat sources in the crack tip zone in NR remain positive during unloading. This was not observed for homogeneous tests: see (Samaca Martinez et al. 2013b) and (Samaca Martinez et al. 2014a). This phenomenon is due to the production of mechanical dissipation (and to a continuation of crystallization at the beginning of unloading in the case of NR) that is of the same order of magnitude as the heat source absorbed due to entropic coupling. This study is the first one characterizing experi-mentally the heat source fields at the crack tip of elastomeric rubbers.
ACKNOWLEDGEMENTS
The authors would like to acknowledge the “Man-ufacture Française des Pneumatiques Michelin” for supporting this study. The authors also thank J. Caillard for the fruitful discussions.
REFERENCES
Chrysochoos, A. & Louche, H. 2000. An infrared image processing to analyse the calorific effects accompany-ing strain localisation. Int J Eng Sci 38: 1759–1788. Gent, A.N. 1996. A new constitutive relation for rubber.
Rubber Chem Technol, 69: 59–61.
Le Cam, J.-B. 2012. A review of the challenges and limi-tations of full-field measurements applied to large heterogeneous deformations of rubbers. Strain 48: 174–188.
Le Cam, J.-B., Samaca Martinez, J.R., Balandraud, X., Toussaint, E. & Caillard, J. 2013. Thermomechanical analysis of the singular behavior of rubber: entro-pic elasticity, reinforcement by fillers, strain-induced crystallization and the Mullins effect. Exp Mech 55: 771–782.
Rivlin, R.S. & Thomas, A.G. 1953. Rupture of rubber. I. Characteristic energy for tearing. J Polym Sci 10: 291–318.
Rublon, P., Huneau, B., Saintier, N., Beurrot, S., Leygue, A., Verron, E., Mocuta, C., Thiaudière, D. & Berghezan, D. 2013. In situ synchrotron wide-angle X-ray diffraction investigation of fatigue cracks in natural rubber. J Synchrotron Radiat 20: 105–109. Samaca Martinez, J.R., Le Cam, J.-B., Balandraud, X.,
Toussaint, E. & Caillard, J. 2013a. Mechanisms of deformation in crystallizable natural rubber. Part 2: Quantitative calorimetric analysis. Polymer 54: 2727–2736.
Samaca Martinez, J.R., Le Cam, J.-B., Balandraud, X., Toussaint, E. & Caillard, J. 2013b. Filler effects on the thermomechanical response of stretched rubbers.
Polym Test 32: 835–841.
Samaca Martinez, J.R., Le Cam, J.B., Balandraud, X., Toussaint, E. & Caillard, J. 2014a. New elements con-cerning the Mullins effect: a thermomechanical analy-sis. Eur Polym J 55: 98–107.
Samaca Martinez, J.R., Balandraud, X., Toussaint, E., Le Cam, J.-B. & Berghezan, D. 2014b. Thermomechani-cal analysis of the crack tip zone in stretched crystal-lizable natural rubber by using infrared thermography and digital image correlation. Polymer 55: 6345–6353. Samaca Martinez, J.R., Toussaint, E., Balandraud, X.,
Le Cam, J.-B. & Berghezan, D. 2015. Heat and strain measurements at the crack tip of filled rubber under cyclic loadings using full-field techniques. Mech Mater 81: 62–71.
Sutton, M.A., Wolters, W.J., Peters, W.H., Ranson, W.F. & McNeill, S.R. 1983. Determination of displacements using an improved digital correlation method. Image
Vision Comput 1: 133–139.
Toussaint, E., Balandraud, X., Le Cam, J.-B. & Grédiac, M. 2012. Combining displacement, strain, temperature and heat source fields to investigate the thermomechanical response of an elastomeric speci-men subjected to large deformations. Polym Test 31: 916–925.
Trabelsi, S., Albouy, P.A. & Rault, J. 2002. Stress-induced crystallization around a crack tip in natural rubber.
Macromolecules 35: 10054–10061.
Vacher, P., Dumoulin, S., Morestin, F. & Mguil-Touchal, S. 1999. Bidimensional strain measurement using digital images. Proc Inst Mech Eng Part C 213: 811–817.
S02_CH008_LeCam.indd 74
S02_CH008_LeCam.indd 74 6/27/2015 12:29:41 PM6/27/2015 12:29:41 PM