HAL Id: hal-02504546
https://hal.archives-ouvertes.fr/hal-02504546
Submitted on 10 Mar 2020
HAL is a multi-disciplinary open access
archive for the deposit and dissemination of sci-entific research documents, whether they are pub-lished or not. The documents may come from teaching and research institutions in France or abroad, or from public or private research centers.
L’archive ouverte pluridisciplinaire HAL, est destinée au dépôt et à la diffusion de documents scientifiques de niveau recherche, publiés ou non, émanant des établissements d’enseignement et de recherche français ou étrangers, des laboratoires publics ou privés.
Blood contains circulating cell free respiratory
competent mitochondria
Zahra Al Amir Dache, Amaëlle Otandault, Rita Tanos, Brice Pastor, Romain
Meddeb, Cynthia Sanchez, Giuseppe Arena, Laurence Lasorsa, E Bennett,
Thierry Grange, et al.
To cite this version:
Zahra Al Amir Dache, Amaëlle Otandault, Rita Tanos, Brice Pastor, Romain Meddeb, et al.. Blood contains circulating cell free respiratory competent mitochondria: Blood contains extracellular mito-chondria. FASEB Journal, Federation of American Society of Experimental Biology, 2020, 34 (3), pp.3616-3630. �10.1096/fj.201901917RR�. �hal-02504546�
1
Blood contains circulating cell free respiratory competent
mitochondria
Running Title: Blood contains extracellular mitochondria
Zahra Al Amir Dache1, Amaëlle Otandault1, Rita Tanos1, Brice Pastor1, Romain Meddeb1, Cynthia Sanchez1,
Giuseppe Arena2, Laurence Lasorsa1, E. Andrew Bennett3, Thierry Grange3, Safia El Messaoudi1, Thibault
Mazard1, Corinne Prevostel1, and Alain R. Thierry1*
1
IRCM, Institut de Recherche en Cancérologie de Montpellier, INSERM U1194, Université de Montpellier, Institut régional du Cancer de Montpellier, Montpellier, F-34298, France
2
Department of Developmental and Stem Cell Biology, Institut Pasteur, CNRS, Paris, France. 3
Institut Jacques Monod, Université Paris Diderot, Paris, France.
* Corresponding author and lead contact to : Dr Alain R. Thierry, INSERM, U1194, IRCM, 208 rue des Apothicaires, Montpellier Cedex 5, 34298 , France, Tel: +33-6-63-82-19-94; E-mail: alain.thierry@inserm.fr
2 Non-standard Abbreviations:
ROS: Reactive oxygen species DNA: Deoxyribonucleic acid
cfDNA: Cell-free Deoxyribonucleic acid
McfDNA: Mitochondrial cell-free Deoxyribonucleic acid NcfDNA: Nuclear cell-free Deoxyribonucleic acid FACS: Fluorescence-activated cell sorting (FACS) PCR: Polymerase chain reaction
Q-PCR: Quantitative polymerase chain reaction bp: Base pair
Kbp: Kilo base pair DII: DNA integrity index
TOM 22: Translocase of outer membrane 22 TIM 23: Translocase of inner membrane 23 OCR: Oxygen consumption rate
EM: Electron microscopy
TFAM: Transcription factor A, mitochondrial DAMPs: Damage associated molecular patterns WGS: Whole genome sequencing
LS: Low speed HS: High speed
PPAP: Protocol precluding activation of platelets F: Filtrated
NF: Non filtrated LR: Long range 16gP: 16,000g pellet IM: Isolated mitochondria
CCCM: Centrifuged cell culture media
TMPD: N, N, N′, N′-tetramethyl-p-phenylenediamine EDTA: Ethylenediaminetetraacetic acid
CTAD: Citrate–theophylline–adenosine–dipyridamole ACD-A: Anticoagulant Citrate Dextrose Solution A MIB: Mitochondrial isolation buffer
3
SSC: Side scatter
PBS: Phosphate-buffered saline
FCCP: Carbonyl cyanide-4-phenylhydrazone
HEPES: 2-[4-(2-hydroxyethyl) piperazin-1-yl]ethanesulfonic acid BSA: Bovine serum albumin
4 Abstract:
Mitochondria are considered as the power-generating units of the cell due to their key role in energy metabolism and cell signaling. However, mitochondrial components could be found in the extracellular space, as fragments or encapsulated in vesicles. In addition, this intact organelle has been recently reported to be released by platelets exclusively in specific conditions. Here, we demonstrate for the first time, that blood preparation with resting platelets, contains whole functional mitochondria in normal physiological state. Likewise, we show, that normal and tumor cultured cells are able to secrete their mitochondria. Using serial centrifugation or filtration followed by PCR-based methods, and Whole Genome Sequencing, we detect extracellular full-length mitochondrial DNA in particles over 0.2µm holding specific mitochondrial membrane proteins. We identify these particles as intact cell-free mitochondria using FACS analysis, fluorescence microscopy and transmission electron microscopy. O2 consumption analysis revealed that these mitochondria are respiratory-competent. In view of previously described mitochondrial potential in intercellular transfer, this discovery could greatly widen the scope of cell-cell communication biology. Further steps should be developed to investigate the potential role of mitochondria as a signaling organelle outside the cell and to determine whether these circulating units could be relevant for early detection and prognosis of various diseases.
Keywords:
5 Introduction:
The presence of mitochondria in unicellular to mammalian organisms originates from an ancient symbiosis between primitive eukaryotic cells and free-living aerobic prokaryotes (1, 2). Mitochondria are crucial organelles for central cell functions (3), and they are the principal nutrient-up-taking and energy-producing cell organelle; they also take part in calcium signaling, ROS production, cell death and diverse cell signaling events (4–7). Mitochondria have retained many of their ancestral bacterial features including length, proteome, double membrane and circular genome (8).
Cell-derived mitochondrial components, including mitochondrial DNA, have been found in the extracellular space (9, 10). Those DNA fragments were found in the physiological circulating fluid of healthy subjects and patients with various diseases (11). Lately, mitochondrial cell-free DNA (McfDNA) has emerged as an attractive circulating biomarker due to its potential role in diagnostic applications in multiple diseases (e.g., Diabetes, acute myocardial infarction, cancer…) (12–14), and in physio-pathological conditions (e.g., trauma) (15). Despite the promising future of McfDNA in clinical applications, knowledge regarding its origin, composition and function is still lacking. In addition, the structure of McfDNA is currently unknown. In contrast, the structure of circulating DNA of nuclear origin is being characterized (16) and mono and di- nucleosomes and, to a lesser extent, transcription factors are found as stabilized cfDNA-associated structures in the blood-stream (17, 18). It is expected there are considerable configuration differences between nuclear and mitochondrial circulating DNA, since mitochondrial DNA is a small circular genome, without protective histones, and thus is more sensitive to degradation in the circulation. However, by revealing recently that there are approximately 50,000-fold more copies of the mitochondrial genome than the nuclear genome in the plasma of healthy individuals (19), we confirmed that McfDNA is sufficiently stable to be detected and quantified (12, 20), implying the presence of stable structures protecting these DNA molecules.
The present study aims at identifying the structures containing mitochondrial DNA in peripheral blood. By examining McfDNA integrity, and associated structure size and density, we revealed the presence of stable particles with full-length mitochondrial genomes. We characterized the structures by fluorescence and electron microscopy, flow cytometry and we identified the presence of intact mitochondria in the circulation. Oxygen consumption assays suggested the functional viability of at least some of these extracellular mitochondria. Our work demonstrates for the first time the presence in blood of circulating cell-free respiratory competent mitochondria. Overall, in view of the potential roles of mitochondria in cell to cell communication, immune response and inflammation, our discovery has broad implications in homeostasis and disease, and paves the way for new paths towards the treatment and prevention of diseases.
6 Materials and Methods:
Plasma isolation:
Blood samples from healthy volunteers were provided by the “Etablissement Français du Sang (E.F.S)”, the blood transfusion center of Montpellier, France (Convention EFS-PM N° 21PLER2015-0013). Blood samples from 50 mCRC patients were provided by a clinical study comparing the detection of KRAS exon 2 and BRAF V600E mutations by cfDNA analysis to conventional detection by tumor tissue analysis. All blood samples were processed within 4 h after collection. Plasma was extracted by various protocols, depending on the experiments.
For mCRC patient:
Blood was collected in EDTA tubes, and plasma was isolated by a single centrifugation, performed at 1,200g for 10 min at 4°C.
For healthy individuals:
Plasma isolation using Ficoll:
Fresh blood was collected in EDTA tubes. Plasma was isolated by a Ficoll density-gradient centrifugation, performed at 400g for 30 min at 18°C (Ficoll® paque plus GE Healthcare, Fisher Scientific, Illkirch, France).
Plasma isolation by centrifugation:
Fresh blood was collected in EDTA tubes. Plasma was isolated by a single centrifugation, performed at 1,200g for 10 min at 4°C (21).
Plasma isolation without platelet activation:
Fresh blood was collected in a BD Vacutainer™ CTAD tubes (Ozyme, Montigny-le-Bretonneux, France). Plasma was isolated via incremental centrifugations, all performed for 10 min at room temperature without a break: two successive centrifugations were first performed at 200g and were followed by a third centrifugation at 300g. Preheated (37°C) ACD-A buffer (0.1M Trisodium citrate, 0.11M Glucose and 0.08 citric acid) and Prostaglandin E1 (1µM) (Sigma-Aldrich, St. Quentin Fallavier Cedex) were then added to the plasma, which was further centrifuged at 1,100g and finally at 2,500g.
Cell lines:
Human colon cancer cell lines (DLD-1/SW620) were obtained from the American type culture collection (ATCC) and a normal immortalized cell line (CCD-18Co) was obtained from Andrei Turtoi’s laboratory (IRCM, Montpellier, France). SW620 and CCD-18Co cells were grown in RPMI 1640 and DLD-1 cells in DMEM (Gibco, Fisher Scientific, Illkirch, France), both supplemented with 10% fetal bovine serum (Eurobio, les Ulis, France) and 1X streptomycin/penicillin (Gibco, Fisher Scientific, Illkirch, France). Cell culture, for all cell lines, was performed at 37°C in 5% CO2.
7
1.5 million cells were seeded in a T-75 flask with 10 ml of appropriate supplemented medium. Cells were incubated for either 24h or 60h. Culture media were replaced with fresh medium 24h before experiments. Collected media from cultured cells were centrifuged at 600g for 10 min at 4°C, to precipitate both floating cells and cells debris, and were further processed by various protocols, depending on the experiments.
Quantification of NcfDNA and McfDNA in healhy individuals and cancer patients:
NcfDNA and McfDNA in healthy individuals (Figure 1A-B, S 2A), and in mCRC patients (Figure S 1-2B) were quantified from a plasma supernatant obtained following the first centrifugation step mentioned before at 1,200g for 10 min at 4°C and a second centrifugation step at 16,000g for 10 min at 4°C. Following this centrifugation, total cfDNA was extracted from supernatant and analysed with q-PCR.
Kinetic study of cfDNA stability:
First, SW620 and DLD-1 culture medium was removed after 24h of culture, centrifuged at 1,200 g, and then at 16,000g for 10 min, both at 4°C, and further incubated at 37°C in 5% CO2 for 4 days. An aliquot of cell culture supernatant (400 µl) was withdrawn every day for DNA extraction. NcfDNA and McfDNA were quantified by q-PCR using specific primers (KRAS F2 and KRAS R1 for NcfDNA, MIT MT-CO3 F and MIT MT-CO3 R2 for McfDNA) (Table S 1).
cfDNA extraction:
cfDNA was extracted with a Qiagen Blood Mini Kit (Qiagen, Courtaboeuf, France) according to the manufacturer‘s recommendations, except that extraction was performed with 1mL of plasma sequentially loaded on a single column and that the cfDNA was eluted with 130μL of elution buffer. The cfDNA was stored at −20°C for further analysis. Freeze-thawing was avoided to reduce cfDNA fragmentation.
Q-PCR analysis:
cfDNA was quantified by q-PCR according to an innovative design of short (60–100 bp ± 10bp) and long (300bp ± 10bp) amplicons targeting the wild-type sequences of specific genes: the KRAS nuclear gene and the mitochondrial Cytochrome oxidase III gene, MT-CO3 (Table S 1). Quantification of the short and long amplicons provides an estimation of the concentrations of the total nuclear circulating free DNA (NcfDNA) and the mitochondrial circulating free DNA (McfDNA) respectively. Q-PCR amplifications were performed in
triplicate in a 25μL final reaction volume controlled by the CFX manager software of a CFX96 touchTM
Real-Time PCR detection system (Bio-Rad). Each PCR reaction mixture was composed of 12.5μL of
SsoAdvanced™ Universal SYBR®
Green Supermix (Bio-Rad, Marnes-la-Coquette, France), 2.5μL of free water (Qiagen), 2.5μL of forward and 2.5μL reverse primers (3 pmol/µL) and 5μL of template. Thermal cycling
8
conditions were as follows: 95°C (3:00) + [95°C (0:10) + 60°C (0:30)] × 40 cycles. Melting curves were investigated by increasing the temperature from 60°C to 90°C, reading the plate every 0.2°C. Each q-PCR run was performed with 1.8ng/μL of genomic DNA extracted from the DiFi cell line (ATCC) for the standard curve and without DNA as the control condition. Q-PCR amplification was validated by melt curve differentiation.
cfDNA calibration assay and copy number calculation:
NcfDNA quantification: A genomic DNA extract from human wild-type KRAS colorectal cells was used for
the NcfDNA calibration assay. Initial genomic DNA solution concentration and purity were determined by measuring optic density at λ=260 nm, 230 nm and 280 nm, with an Eppendorf BioPhotometer® D30. Starting genomic DNA concentration was adjusted to 1,800 pg/µl for the first dilution point, according to optical density measurement at λ=260 nm. A q-PCR standard curve was obtained by 6 successive dilutions of the vector solution (to 1,800, 180, 45, 20, 10 and 5pg/µl). The standard curve was used to determine the NcfDNA concentration per milliliter of plasma and cell media supernatant. The NcfDNA copy number was calculated as follows:
Qnuclear is the NcfDNA copy number per milliliter; c is the NcfDNA mass concentration (pg/µl) determined by a
q-PCR targeting the nuclear KRAS gene sequence and 3.3pg is the human haploid genome mass. Velution is the
volume of cfDNA extract (µl) and Vplasma is the starting volume of plasma used for the extraction (ml).
McfDNA quantification: A 3382-pb human ORF vector with a 786-pb MT-CO3 insert was obtained from
ABM (accession no.YP_003024032) and used for the McfDNA calibration assay.
Initial vector solution testing, starting concentration adjustments and q-PCR standard curves were performed as for NcfDNA above.
The standard curve was used to determine the McfDNA concentration per milliliter of plasma and of cell media
supernatant. The McfDNA copy number was calculated as follows:
Qmitochondrial is the McfDNA copy number per milliliter, ‘c’ is the McfDNA mass concentration (g/µl) determined by q-PCR targeting the mitochondrial MT-CO3 gene sequence. NA is Avogadro’s number
(6.02*1023 molecules per mole), Lvector is the plasmid length (nucleotides) and MW is the molecular weight of
one nucleotide (g/mol); Velution is the elution volume of cfDNA extract (µl) and Vplasma is the starting volume of
9 DNA Integrity Index calculation:
The degree of cfDNA fragmentation was assessed simultaneously by targeting KRAS and MT-CO3 sequences from each plasma DNA sample by calculating the DII (DNA integrity index). The DII was determined by calculating the ratio of the concentration determined using the primer set amplifying a large target (KRAS F2/R1 and MT-CO3 F/R2) to the concentration determined using the primer set amplifying a short target (KRAS F1/R1 and MT-CO3 F/R1) (Table S 1).
Examination of the percentage of McfDNA short and long fragments:
CfDNA was extracted from a pool of 80 healthy individual’s plasma, with the Maxwell RSC ccfDNA plasma kit (Promega, Charbonnières-les-Bains, France). To obtain highly concentrated cfDNA, extracts were subjected to a second extraction with the same method followed by a Qiamp DNA blood Mini Kit extraction resulting in a final volume of 30µL. The samples were then electrophoresed on a 2% agarose gel and DNA fractions of short (<500bp) and long (>500bp) fragments were extracted from the gel with a QIAquick Gel extraction Kit (Qiagen). The quantity of mitochondrial DNA fragments was then assessed with q-PCR by using mitochondrial specific primer (MT-CO3 F/R1) (Table S 1).
Library preparation for whole genome sequencing:
Dual-indexed single-stranded libraries were prepared from 1-11 ng human DNA using TL137 as a linker oligo (22). To allow sequencing with single-stranded libraries, custom double-stranded adapters were generated, identical to those used in the single-stranded method, by annealing a short oligo SLP4 (23). Ligations were performed with an NEBNext Quick Ligation Module kit (New England Biolabs) with 0.04µM of each annealed adapter in a 50µl total volume, incubated for 30min at 20°C. Adapters were elongated by adding 50µl OneTaq 1x Master Mix (New England Biolabs) to the ligation mixture and incubating for 20min at 60°C. All oligos were purchased from Eurogentec (Kaneka Eurogentec, Seraing, Belgium). Single-stranded libraries were quantified via qPCR, with a diluted fraction, in a LightCycler 2 (Roche Applied Science, Mannheim, Germany). Samples were then amplified using Taq polymerase and an optimal number of cycles for each sample to avoid plateau phase, as calculated from the Ct of the diluted qPCR. Amplified samples were then purified by two rounds of Macherey-Nagel NGS beads at 1.3x volume, to retain shorter inserts, and eluted in 30µL EBT. Purified libraries were then visualized on a Bioanalyzer 2100 (Agilent, Santa Clara, CA) and quantified via qPCR, Qubit 2 Fluorometer (Life Technologies, Grand Island, NY), and Bioanalyzer 2100. Libraries were then pooled in equimolar amounts and sequenced on an Illumina MiSeq platform using two MiSeq v3 150 (2x75) kits, with sequencing primer CL72 replacing the first read sequencing primer.
10 Sequence analysis:
Adapter sequences were removed with cutadapt 1.3 (24) and reads were aligned to the human genome reference (hg19) with BWA aln (25) using the default parameters and filtered for mapping quality 20 with SAMtools 1.5 (26). Duplicate removal and histogram generation was performed with MarkDuplicates and CollectInsertSizeMetrics, respectively, from Picard tools 1.88.
Differential centrifugation and filtration of plasma and cell media:
Schematic view and details are presented in Figure S 6.
Isolation of intracellular mitochondria:
Mitochondria from cultured cells were isolated as a positive control. Cells were scraped from culture dishes, washed with PBS and centrifuged at 1,300 rpm for 5 min at room temperature. Pelleted cells were resuspended in 1 mL of MIB (0.2M sucrose, 0.01M tris, 0.001M EGTA, 1X protease inhibitor) and gently lysed using an IKA T18 Basic Dispersers Homogenizer (Ultraturrax) at speed 2 for 10 s until obtaining 80 to 90% intact nuclei. Lysed cells were then centrifuged at 600g at 4°C for 10 min to remove cell debris and nuclei, to recover supernatant containing both cytoplasm and mitochondria. Pelleted intact nuclei were washed twice in 1ml MIB and centrifuged again at 600g for 10min at 4°C, to be used as a negative control in experiments with flow cytometry, while the resulting supernatants were pooled together with the previous supernatants to further isolate mitochondria. For this, the 3ml of supernatant were centrifuged at 600g at 4°C for 10 min to eliminate contaminating nuclei and cell debris. The resulting supernatant was then further centrifuged at 8,000g for 10 min at 4°C to pellet mitochondria. The supernatant was collected again and centrifuged again at 8,000g for 10 min at 4°C. These pellets were pooled together and gently resuspended in 500uL MIB, transferred to 1.5mL tubes and centrifuged again at 8,000g for 10 min at 4°C. The final supernatant was carefully discarded to collect the pelleted mitochondria.
Isolation of extracellular mitochondria:
Mitochondria in the plasma extracted by Ficoll gradient, were isolated by sequential centrifugations at 600g, then 1,200g and finally 2,000g for 10 min at 4°C to remove any contaminating blood cells or platelets. The resulting supernatant was centrifuged at 16,000g to collect the extracellular mitochondria pellet.
Mitochondria in the plasma obtained without platelet activation were pelleted by a one-step centrifugation at 16,000g for 10 min at 4°C.
11
Mitochondria in the cell media supernatant were isolated by sequential centrifugations at 600 g, then 1,200 g for 10 min at 4°C to remove any contaminating cells. The pellet of extracellular mitochondria was collected from a subsequent centrifugation at 16,000g.
Note that an extracellular mitochondrial pellet was also recovered from a centrifugation at 8,000g instead of 16,000g to protect the mitochondrial membrane.
Amplification of the mitochondrial genome:
The DNA extracted from cell media pellets (40 flask T-75/cell line), and from two different plasma pools (without platelet activation) was selectively amplified with the repli g mitochondrial DNA kit (Qiagen), according to the manufacturer’s recommendations. The amplified mitochondrial genome was then amplified by long range PCR performed in a 50μL total volume in a Mastercycle® nexus eco thermal cycler (Eppendorf). Each PCR reaction mixture was composed of 30.5μL of free water (Qiagen), 5μL of 10× LA PCR Buffer II (Mg2+ plus), 8μL of dNTPs (2.5mM each), 5μL of mixed forward and reverse primers (10µM each), 1μL of template (DNA mass between 10 and 100ng, calculated with a Qubit broad range kit) and 0.5µl of TAKARA LA Taq (5 U/µl) (Ozyme, Saint Quentin Yvelines, France). Thermal cycling conditions were as follows: 95 °C (2:00) + [95 °C (0:15) + 68 °C (10:00)] × 30 cycles + 68 °C (20:00) + 4 °C (∞).PCR amplifications were performed with five pairs of overlapping primers (Mito1/Mito2/Mito3/hmt1/hmt2) (Integrated DNA Technologies, Leuven, Belgium). All PCR amplified products were loaded on a 0.8% agarose gel to check the size of amplicons with reference to the 1Kb plus DNA ladder (Thermo Fischer).
Mitochondrion staining:
The 16,000g pellets from both, the plasma without platelet activation (pool from 5 healthy individuals) and from the cell media (2 flask T-75/ cell line), were stained with 200nM MitoTracker® Green FM (Thermofisher) for 45 min, washed twice with PBS, and resuspended in 10µl of PBS to be visualized by ApoTome microscopy (ZEISS Axio Imager 2). Images were edited with ZEN Software. In parallel, cell culture media pellets (8 T-75 flask/cell line), Ficoll-isolated plasma pellet and positive and negative controls were resuspended in 150 µl of PBS and analyzed by Gallios flow cytometry (Beckman Coulter). Mitochondria isolated from cultured cells were used as a positive control for the MitoTracker® specificity and as a standard to delineate both the appropriate gate and voltages for the flow cytometry. All sample plots were collected according to size (Forward scatter FSC) and granularity (side scatter SSC) in logarithmic mode. Voltages were adjusted for submicron particles and the flow rate was set at ‘low’. Doublets were excluded by plotting FSC-Area versus FSC-H, both in logarithmic mode. Collected events in the newly created gate were gated as singlet. Following confirmation that all events recorded in this gate were MitoTracker Green positive, the gate was applied to all
12
samples. Plot histograms were created for both unstained and stained samples. Results were analyzed with Kaluza analysis 1.5 software.
Western Blot:
Pellets obtained at 8,000g from both the plasma (pool of 5 healthy individuals) and the cell media supernatant (100 flask t-75/cell line) were resuspended in 50µl of 1X Laemli buffer, loaded on a 12% Acrylamide/Bis-Acrylamide gel and transferred onto nitrocellulose membranes (GE Healthcare). Membranes were blocked in 10% milk in 1X PBS-tween for 1h. Blotting was performed with either 1/500 diluted primary mouse anti-TOM22 (Sigma , St. Quentin Fallavier Cedex) or with 1/1,000 diluted primary mouse anti-TIM23 (BD Transduction Laboratorie, France) antibodies over-night at 4°C and further with 1/10,000 diluted HRP-conjugated secondary Rabbit anti-mouse antibodies (Merck, Île-de-France, France) for 1h at room temperature. Immunoblots were visualized by ECL (Perkin Elmer, Villebon sur Yvette, France).
Electron microscopy:
8,000g pellets from either cell media (30 flask T-75/cell line) or plasma prepared without platelet activation (pool from 3 healthy individuals) were immersed in a solution of 2.5% glutaraldehyde in PHEM buffer (1X, pH 7.4) overnight at 4°C, washed in PHEM and post-fixed in 0.5% osmic acid for 2h in the dark at room temperature. Samples were then washed twice in PHEM buffer, dehydrated in a graded series of 30 to 100% ethanol solutions and finally embedded in EmBed 812 using an Automated Microwave Tissue Processor for Electronic Microscopy (Leica EM AMW). 70nm sections (Leica-Reichert Ultracut E), collected at different levels of each block, were counterstained, with 1.5% uranyl acetate in 70% Ethanol and lead citrate, and observed with a Tecnai F20 transmission electron microscope at 200KV.
Metabolic activity:
Mitochondrial bioenergetics function was determined by oxygen consumption rate OCR, with a Seahorse XF-96 extracellular flux analyzer (Agilent). We performed the electron flow assay that allows the functional assessment of selected mitochondrial complexes together in the same period. After isolation, 64 µg of freshly isolated DLD-1 mitochondria (positive control), and 64 µg of DLD1 cell media pellet and plasma pool pellet prepared without platelets activation, were plated in each well in a volume of 25 µL containing MAS 1X (70 mM sucrose, 220 mM mannitol, 10 mM KH2PO4, 5 mM MgCl2, 2 mM HEPES, 1 mM EGTA and 0.2% fatty acid-free BSA, pH 7.2) supplemented with 10 mM pyruvate, 2 mM malate and 4 µM FCCP. Note, pyruvate and malate drive respiration via complex I, and FCCP uncouples the mitochondrial function. The XF plate was then
13
centrifuged for 20 min at 2,000g at 4°C. After centrifugation, 155 µL of electron flow substrate-containing 1xMAS was added to each well, and the plate was warmed up in a 37°C non-CO2 incubator for 5-10 min. 10-fold concentrated compounds were loaded in the ports of the cartridge, using the “loading helper” plate: port A, 20 µL of 20 µM rotenone, a complex I inhibitor (2 µM final): port B, 22 µL of 100 mM succinate, a complex II activator (10 mM final); port C, 24 µL of 40 µM Antimycin A, a complex III inhibitor (4 µM final); port D, 26 µL of 100 mM ascorbate plus 1mM TMPD, complex IV activator (10 mM and 100 µM final, respectively). After calibration of the cartridge by the XF machine, the XF plate was introduced and the assay continued using Agilent’s protocol for isolated mitochondria.
Statistical analysis:
Statistical analysis was performed with GraphPad Prism software (version 7.01). A probability of ≤ 0.05 was considered to be statistically significant by Student’s t-test: * p ≤ 0.05, ** p ≤ 0.01, *** p ≤ 0.001, **** p ≤ 0.0001.
14 Results:
Mitochondrial cell-free DNA size distribution and stability:
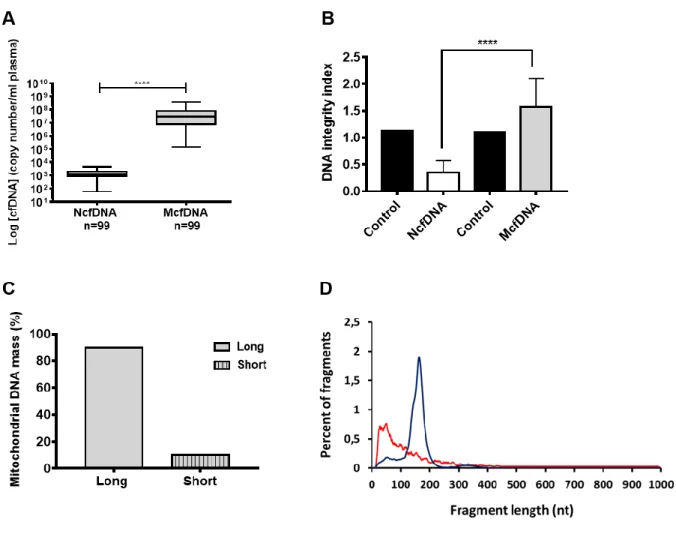
McfDNA is sufficiently stable to be detected and quantified in plasma (Fig 1A; Fig S 1A,2). However, mitochondrial DNA (16 kilo base pairs (kbp)) was thought to be more susceptible to degradation and less stable than nuclear DNA because of its lack of histones. In our initial investigation, we found, to our surprise, that McfDNA fragments over 300 bp are actually more stable than NcfDNA fragments (>300 bp), in fetal bovine serum supplemented culture medium (Fig 2). To establish mitochondrial genome cell-free DNA integrity, we determined the DII (DNA integrity index) we previously used for the study of NcfDNA fragmentation (27), and data revealed that all or most McfDNA fragments are over 300 bp, in contrast to NcfDNA (Fig 1B; Fig S 1B). We next examined a plasma DNA extract pool, from eighty healthy humans, by agarose gel electrophoresis and q-PCR. Approximately 10% only, of the McfDNA mass in healthy samples, were composed of fragments below 500 bp (Fig 1C).
Whole Genome Sequencing of healthy plasma revealed a wide-size ranging population of short mitochondrial DNA fragments mainly decreasing in abundance from 30 to 300 nucleotides. In contrast, NcfDNA had a more homogenous distribution, conventionally peaking at 167 base pairs, corresponding to mono-nucleosomes (Fig 1D) (17, 28). Paired-end sequencing enables high-resolution measurement of DNA size but has a practical upper limit of read-out at ~1,000bp. Since no McfDNA was detected between 500 bp and 1,000 bp, Whole Genome Sequencing only detected the minor fraction formerly revealed by gel electrophoresis (Fig 1C).
Data suggest that McfDNA contain at least two populations: one minor composed of highly degraded fragments from 30 to 300 bp, and one major composed of DNA of length higher than 1,000bp. Intimate examination of the WGS resulting reads indicates that ≈ 63% of the McfDNA fragments below 300 bp ranged between 67 bp and 300 bp. When combining WGS data and Q-PCR based measurement of the fractionation assay, we could determine that only 5% of the total mass of McfDNA are below 67bp. We therefore set out to characterize the structural elements that stabilize mitochondrial DNA over 1,000 bp in the circulation.
Plasma and cell culture media contain McfDNA in dense structures larger than 0.22 µm.
We next used differential centrifugation of plasma to separate the different structures associated with cell-free nuclear and mitochondrial DNAs. First, we isolated the plasma from whole blood at 400g on a ficoll gradient. This was followed by incremental centrifugations at 16, 40 and 200 thousand g to remove the large organelles and remaining membrane debris, the micro-vesicles and finally the exosomes, respectively (Fig S 6). Q-PCR of the resulting supernatant revealed, surprisingly, that McfDNA is packed in denser structures than NcfDNA (Fig 3A-C).
15
We therefore sought to further confirm our surprising result, that 16,000g centrifugation precipitated large amounts of mitochondrial DNA but very little nuclear DNA, by performing a refined plasma isolation protocol that precludes platelet activation, based on sequential centrifugations at increasing strengths: 2 x 200g, 300g, 1 100g, 2,500g and 16,000g, each for 10min at 20°C with no break in-between. Note, this protocol excludes blood cells from the final plasma preparation without activating or degrading them in the process (29, 30) (Fig 3A) and this sequence (series) of centrifugations was used in all the following work described here. Notably, in the final plasma preparation, the nuclear DNA passed through a 0.2µm filter whereas the mitochondrial DNA did not (Fig 3A,D,E; Fig S 3A-C). No statistically significant variation in NcfDNA content occurs, in contrast to McfDNA contents showing up to 7-fold difference when using these various procedures (Fig 3D-E); this demonstrated that mitochondrial DNA detected in plasma are included in cell-free structures and that plasma preparation is devoid of nucleated blood cells.
Next, we sought to completely eliminate the possibility that mitochondria or free mitochondrial DNA is actively released into the plasma by platelets, during handling of the blood samples. Therefore, we repeated all the above analysis on culture media supernatants from various cancer and normal cell lines, DLD-1, SW620 and CCD-18CO, and again here the McfDNA sedimented at 16,000g (Fig 3B; Fig S 4A-C), and was retained on 0.22 filters (Fig S 3D-E). 73% ± 11% and 78% ± 15% of the McfDNA precipitated into the pellet from the cell culture supernatant and plasma, respectively (Fig 3C; Fig S 4C; Table S 2). It has to be noted that mitochondria are between 0.4 and 1.5 microns in diameter and the conventional speed used for their sedimentation is between 7,000 and 20,000g. Mitochondrial DNA in the 16,000g pellet of cell culture media was not degraded by DNase I treatment, in contrast to nuclear DNA (Fig S 4D). Overall, these experiments demonstrate that plasma and cell culture media contain McfDNA in dense and stable structures above 0.22 µm, excluding platelets as its source.
Both plasma and cell culture media contain structures with full-length mitochondrial genomes.
We next investigated the integrity of the mitochondrial DNA in the 16,000g pellets of two different plasma pools and in DLD-1 and SW620 culture media. After Highly Uniform Whole Mitochondrial Genome Amplification of the DNA extracts, we used long-range PCR with five mitochondria-specific primer sets (Fig 4A) (31). While no signal was detected in the negative controls, agarose gel electrophoresis sizing clearly revealed the expected mitochondrial amplicons from the cell media and plasma 16,000g pellets, thus demonstrating the presence of intact full-length mitochondrial DNA in cell culture media and in healthy individuals plasma (Fig 4B), consistent with the high integrity index of plasma mitochondrial DNA in Fig 1B.
16 Both plasma and cell culture media contain structurally intact mitochondria:
To test for the presence of structurally intact mitochondria or material derived from mitochondria in plasma, we used, the specific live mitochondrial marker, Mitotracker green, on the 16,000g pellet derived from cell cultures media and on the plasma of five healthy individuals. Positively labeled mitochondria were specifically observed by Fluorescence microscopy in all biological sources (Fig 6A-C). In addition, Flow cytometry analysis was performed on the Mitotracker green-stained preparations. Nuclei (Fig 5B, Fig S 5B) and mitochondria (Fig 5A, Fig S 5A), purified from the DLD-1 and SW620 cells, were included as negative and positive control respectively.
16,000g pellet from fresh cell media was also used as a negative control (Fig 5C, Fig S 5C). Similarly to the positive control, fluorescence signals were detected in the 16,000g pellet of both cell culture media (Fig 5D-E; Fig S 5D-E) and plasma (Fig 5F; Fig S 5F-I), indicating the presence of mitochondria. In addition, immunoblotting revealed the presence of the outer and inner membrane mitochondrial transport proteins TOM 22 and TIM 23 in the 16,000g pellets from the DLD-1, SW620 and CCD-18Co cell culture media and the plasma supernatants (Fig 5G-H).
To validate the presence of free intact mitochondria, we examined the pellet obtained from the cell culture media of DLD-1 and SW620, and from isolated plasma without platelet activation, by electron microscopy. Structures with a double membrane and a similar size to mitochondria were detected in all the samples (Fig 6D-F). The 16,000g pellets contained structures with all the morphological characteristics of mitochondria, including the inner and outer membranes and the corresponding intermembrane space and matrix. It has to be noted that not all these structures match perfectly the conventional morphology of mitochondria inside a cell. This is expected due to the various morphological alterations that mitochondria may undergo especially in different pathological conditions (32).
Both plasma and cell culture media contain respiratory-competent mitochondria
To determine whether these mitochondria are functional, we evaluated the metabolic activity by measuring oxygen consumption rate (OCR) with the Seahorse XF extracellular flux analyzer technology (Agilent). The electron flow assay clearly indicated that the pellets isolated from DLD-1 culture media, as well as from plasma pool of healthy individuals, consume oxygen and are sensitive to complex I inhibition by rotenone and to complex IV stimulation by ascorbate and TMPD, suggesting that the extracellular mitochondria remain competent for respiration (Fig 7A).
17 Discussion:
To sum up, we report here that blood contains intact cell-free full-length mitochondrial DNA in dense and biologically stable structures over 0.22µm in diameter and that these structures have specific mitochondrial proteins, double membranes and a morphology resembling that of mitochondria. We further demonstrate that these structurally intact cell-free mitochondria in the blood circulation are respiratory competent. We estimate that there are between 200,000 and 3.7 million cell-free intact mitochondria per mL of plasma, based on the McfDNA copy number that was either pelleted at 16,000g or filtered (Table S 3). While several studies reported extracellular mitochondria in specific conditions resulting in platelet activation (33), or encapsulated within microvesicles (34), it is remarkable how the presence of intact cell-free mitochondria was unnoticed in normal physiological state. This could be explained by the high dilution of these organelles in the plasma and cell culture media. Note, our finding first corroborate previous collateral observations of plasma filtrates suggesting existence of particles containing mitochondrial DNA in the circulation (10). Intact full mitochondrial genomes were also observed in the cell free DNA fraction of both healthy individuals and patients with mitochondrial disease. However it was assumed that the circular nature of mitochondrial DNA delays its degradation by circulating nucleases, so the presence of intact mitochondria was not suspected and the structural characteristics associated with McfDNA were not investigated (35).
In addition to observe by fractionation that a great part of mitochondrial DNA is associated to high size structures, we initially found striking differences between McfDNA and NcfDNA in respect to stability and size distribution. McfDNA is composed of, at least, two size-populations: one minor composed of fragments from 30 to 300 bp and one major composed of DNA of size higher than 1,000bp. We hypothesize, based on the exponential increase of McfDNA from 300 to 30 nucleotides, that the minor population represent DNA fragments in a dynamic degradation process.
All cell-free mitochondria in human plasma or cell culture media supernatant as observed by EM were not surrounded by a bi- or multi-layer phospholipid membrane. A few studies suggested that mitochondrial DNA could be encapsulated in extracellular vesicles such as exosomes and microvesicles, and act as efficient messengers in many biological systems (34). One can speculate that the previously described biological effect of cell-free mitochondrial DNA enriched micro-particles could, as well, be performed by cell-free intact mitochondria as their presence in blood was not known before the study of Boudreau et al and Puhm et al. on activated platelet and monocyte preparation (33, 36).
18
We believe that circulating cell-free intact mitochondria have crucial biological and physiological roles because mitochondria are already known as systemic messengers in cell-cell communication by transferring hereditary and non-hereditary constituents. Mitochondria were recently discovered to translocate from one cell to the other (37). Indeed intercellular mitochondria trafficking was observed in vitro and in vivo, both in physiological and pathophysiological conditions including tissue injury and cancer (38). In particular, the mitochondria transfer between differentiated and mesenchymal stem cells was observed in cardiomyocytes and endothelial cells as a means to rescue injured tissues (39). Similarly, mitochondria are able to be internalized by different types of cells, by macro pinocytosis which is an endocytic pathway specific for large vesicles (40). Clinical transplantation of mitochondria between cells is an active area of research but the specific mechanisms and critical factors involved in natural mitochondria transfer between the donor cells and recipient cells are remain to be fully characterized (41).
We speculate that mitochondrial clearance and degradation occurs principally by phagocytosis. This study is the first showing free structurally intact mitochondria in plasma, but it is not yet known how they are degraded there, in contrast to intracellular mitophagy, which is well described (42). Presumably, mitochondria are degraded in plasma, and their content is released in the blood stream. Furthermore, it has been demonstrated that those organelles harbor many DAMPs including DNA, lipids and metabolites, which are capable of activating immune cells and inducing an inflammatory response (43, 44). Our data demonstrate the presence of quintessential ancient symbiotic energy-providing component of all eukaryotic cells, the mitochondrion, as a previously unappreciated constituent of a critical organ, the blood. Further investigations are warranted to evaluate the impact and the potential implications of this discovery in the field of cell-cell communication, inflammation and in clinical applications.
19 Acknowledgments:
The authors would like to thank P. Blache, T. Salehzada and C. Jay-Allemand for helpful comments. We are grateful to J. Venables (Science Sense) for help in editing the manuscript. We are grateful to the MRI platform (Montpellier Bio campus) for access to imaging facilities, and to METAMONTP platform for access to seahorse technology (M-L.Vignais). We thank Beatrice Chabi (INRA, UMR 0866 DMEM Dynamique Musculaire et Métabolisme, Centre de recherche de Montpellier, Montpellier, France) for her contribution to the oxygraph experiment. We thank A. Turtoi for providing us CCD-18Co cell line and reagents. ART is supported by the INSERM (Institut National de la Santé et de la Recherche Médicale).
Funding: The work is supported by the SIRIC Montpellier Grant (INCa-DGOS-Inserm 6045), France.
Author contributions: ZAAD, CP and ART designed the study, developed the methodology, analyzed the data
and prepared the manuscript. ZAAD, AO, RT, BP, RM, CS, GA, LL, AB, TG and SEM realized the experiments. All of the authors (ZAAD, AO, RT, BP, RM, CS, GA, LL, AB, TG, SEM, TM, CP and ART) discussed the results and approved the manuscript.
Conflicts of interest: The authors declare no competing financial interests.
Materials and correspondence: The published article includes all data generated or analyzed during this study.
Further information and requests for resources and reagents should be directed to and will be fulfilled by the
20 References:
1. Roberts, R. G. (2017) Mitochondria—A billion years of cohabitation. PLOS Biology 15, e2002338 2. Lane, N. and Martin, W. (2010) The energetics of genome complexity. Nature 467, 929–934
3. Nunnari, J. and Suomalainen, A. (2012) Mitochondria: In Sickness and in Health. Cell 148, 1145–1159 4. Rizzuto, R., De Stefani, D., Raffaello, A., and Mammucari, C. (2012) Mitochondria as sensors and
regulators of calcium signalling. Nat. Rev. Mol. Cell Biol. 13, 566–578
5. Wang, C. and Youle, R. J. (2009) The Role of Mitochondria in Apoptosis. Annual Review of Genetics 43, 95–118
6. Tait, S. W. G. and Green, D. R. (2012) Mitochondria and cell signalling. Journal of Cell Science 125, 807–815
7. Murphy, E., Ardehali, H., Balaban, R. S., DiLisa, F., Dorn, G. W., Kitsis, R. N., Otsu, K., Ping, P.,
Rizzuto, R., Sack, M. N., Wallace, D., and Youle, R. J. (2016) Mitochondrial Function, Biology, and Role in Disease: A Scientific Statement From the American Heart Association. Circulation Research 118, 1960–1991
8. Friedman, J. R. and Nunnari, J. (2014) Mitochondrial form and function. Nature 505, 335–343
9. Thierry, A. R., El Messaoudi, S., Gahan, P. B., Anker, P., and Stroun, M. (2016) Origins, structures, and functions of circulating DNA in oncology. Cancer and Metastasis Reviews 35, 347–376
10. Chiu, R. W. K., Chan, L. Y. S., Lam, N. Y. L., Tsui, N. B. Y., Ng, E. K. O., Rainer, T. H., and Lo, Y. M. D. (2003) Quantitative Analysis of Circulating Mitochondrial DNA in Plasma. Clinical Chemistry 49, 719–726
11. Yu, M. (2012) Circulating cell-free mitochondrial DNA as a novel cancer biomarker: opportunities and challenges. Mitochondrial DNA 23, 329–332
12. Kohler, C., Radpour, R., Barekati, Z., Asadollahi, R., Bitzer, J., Wight, E., Bürki, N., Diesch, C., Holzgreve, W., and Zhong, X. (2009) Levels of plasma circulating cell free nuclear and mitochondrial DNA as potential biomarkers for breast tumors. Molecular Cancer 8, 105
13. Malik, A. N., Parsade, C. K., Ajaz, S., Crosby-Nwaobi, R., Gnudi, L., Czajka, A., and Sivaprasad, S. (2015) Altered circulating mitochondrial DNA and increased inflammation in patients with diabetic retinopathy. Diabetes Research and Clinical Practice 110, 257–265
14. Sudakov, N. P., Popkova, T. P., Katyshev, A. I., Goldberg, O. A., Nikiforov, S. B., Pushkarev, B. G., Klimenkov, I. V., Lepekhova, S. A., Apartsin, K. A., Nevinsky, G. A., and Konstantinov, Yu. M. (2015) Level of blood cell-free circulating mitochondrial DNA as a novel biomarker of acute myocardial ischemia. Biochemistry (Moscow) 80, 1387–1392
15. Zhang, Q., Itagaki, K., and Hauser, C. J. (2010) Mitochondrial DNA is released by shock and activates neutrophils via p38 MAP kinase. Shock 34, 55–59
16. Otandault, A., Anker, P., Al Amir Dache, Z., Guillaumon, V., Meddeb, R., Pastor, B., Pisareva, E., Sanchez, C., Tanos, R., Tousch, G., Schwarzenbach, H., and Thierry, A. R. (2019) Recent advances in circulating nucleic acids in oncology. Ann. Oncol. 30, 374–384
17. Sanchez, C., Snyder, M. W., Tanos, R., Shendure, J., and Thierry, A. R. (2018) New insights into structural features and optimal detection of circulating tumor DNA determined by single-strand DNA analysis. npj Genomic Medicine 3, 31
18. Snyder, M. W., Kircher, M., Hill, A. J., Daza, R. M., and Shendure, J. (2016) Cell-free DNA Comprises an In Vivo Nucleosome Footprint that Informs Its Tissues-Of-Origin. Cell 164, 57–68
19. Meddeb, R., Al Amir Dache, Z., Thezenas, S., Otandault, A., Tanos, R., Pastor, B., Sanchez, C., Azzi, J., Tousch, G., Azan, S., Mollevi, C., Adenis, A., Messaoudi, S. E., Blache, P., and Thierry, A. R. (2019) Quantifying circulating cell-free DNA in humans. Scientific Reports 9, 5220
20. Fliss, M. S. (2000) Facile Detection of Mitochondrial DNA Mutations in Tumors and Bodily Fluids.
Science 287, 2017–2019
21. Meddeb, R., Pisareva, E., and Thierry, A. R. (2019) Guidelines for the Preanalytical Conditions for Analyzing Circulating Cell-Free DNA. Clin. Chem. 65, 623–633
21
22. Gansauge, M.-T., Gerber, T., Glocke, I., Korlević, P., Lippik, L., Nagel, S., Riehl, L. M., Schmidt, A., and Meyer, M. (2017) Single-stranded DNA library preparation from highly degraded DNA using T4 DNA ligase. Nucleic Acids Research 45, e79
23. Bennett, E. A., Massilani, D., Lizzo, G., Daligault, J., Geigl, E.-M., and Grange, T. (2014) Library
construction for ancient genomics: Single strand or double strand? BioTechniques 56, 289–290, 292–296, 298
24. Martin, M. (2011) Cutadapt removes adapter sequences from high-throughput sequencing reads.
EMBnet.journal 17, 10–12
25. Li, H. and Durbin, R. (2009) Fast and accurate short read alignment with Burrows-Wheeler transform.
Bioinformatics 25, 1754–1760
26. Li, H., Handsaker, B., Wysoker, A., Fennell, T., Ruan, J., Homer, N., Marth, G., Abecasis, G., Durbin, R., and 1000 Genome Project Data Processing Subgroup. (2009) The Sequence Alignment/Map format and SAMtools. Bioinformatics 25, 2078–2079
27. Mouliere, F., Robert, B., Arnau Peyrotte, E., Del Rio, M., Ychou, M., Molina, F., Gongora, C., and
Thierry, A. R. (2011) High Fragmentation Characterizes Tumour-Derived Circulating DNA. PLoS ONE 6, e23418
28. Zhang, R., Nakahira, K., Guo, X., Choi, A. M. K., and Gu, Z. (2016) Very Short Mitochondrial DNA Fragments and Heteroplasmy in Human Plasma. Scientific Reports 6, 36097
29. Rigothier, C., Daculsi, R., Lepreux, S., Auguste, P., Villeneuve, J., Dewitte, A., Doudnikoff, E., Saleem, M., Bourget, C., Combe, C., and Ripoche, J. (2016) CD154 Induces Matrix Metalloproteinase-9 Secretion in Human Podocytes. Journal of Cellular Biochemistry 117, 2737–2747
30. Coumans, F. A. W., Brisson, A. R., Buzas, E. I., Dignat-George, F., Drees, E. E. E., El-Andaloussi, S., Emanueli, C., Gasecka, A., Hendrix, A., Hill, A. F., Lacroix, R., Lee, Y., van Leeuwen, T. G., Mackman, N., Mäger, I., Nolan, J. P., van der Pol, E., Pegtel, D. M., Sahoo, S., Siljander, P. R. M., Sturk, G., de Wever, O., and Nieuwland, R. (2017) Methodological Guidelines to Study Extracellular Vesicles.
Circulation Research 120, 1632–1648
31. Dames, S., Eilbeck, K., and Mao, R. (2015) A High-Throughput Next-Generation Sequencing Assay for the Mitochondrial Genome. Methods in Molecular Biology (Clifton, N.J.) 1264, 77–88
32. Wiemerslage, L., Ismael, S., and Lee, D. (2016) Early alterations of mitochondrial morphology in
dopaminergic neurons from Parkinson’s disease-like pathology and time-dependent neuroprotection with D2 receptor activation. Mitochondrion 30, 138–147
33. Boudreau, L. H., Duchez, A.-C., Cloutier, N., Soulet, D., Martin, N., Bollinger, J., Pare, A., Rousseau, M., Naika, G. S., Levesque, T., Laflamme, C., Marcoux, G., Lambeau, G., Farndale, R. W., Pouliot, M., Hamzeh-Cognasse, H., Cognasse, F., Garraud, O., Nigrovic, P. A., Guderley, H., Lacroix, S., Thibault, L., Semple, J. W., Gelb, M. H., and Boilard, E. (2014) Platelets release mitochondria serving as substrate for bactericidal group IIA-secreted phospholipase A2 to promote inflammation. Blood 124, 2173–2183 34. Sansone, P., Savini, C., Kurelac, I., Chang, Q., Amato, L. B., Strillacci, A., Stepanova, A., Iommarini, L.,
Mastroleo, C., Daly, L., Galkin, A., Thakur, B. K., Soplop, N., Uryu, K., Hoshino, A., Norton, L., Bonafé, M., Cricca, M., Gasparre, G., Lyden, D., and Bromberg, J. (2017) Packaging and transfer of mitochondrial DNA via exosomes regulate escape from dormancy in hormonal therapy-resistant breast cancer. PNAS
114, E9066–E9075
35. Newell, C., Hume, S., Greenway, S. C., Podemski, L., Shearer, J., and Khan, A. (2018) Plasma-derived cell-free mitochondrial DNA: A novel non-invasive methodology to identify mitochondrial DNA haplogroups in humans. Mol. Genet. Metab. 125, 332–337
36. Puhm Florian, Afonyushkin Taras, Resch Ulrike, Obermayer Georg, Rohde Manfred, Penz Thomas, Schuster Michael, Wagner Gabriel, Rendeiro Andre F., Melki Imene, Kaun Christoph, Wojta Johann, Bock Christoph, Jilma Bernd, Mackman Nigel, Boilard Eric, and Binder Christoph J. (2019) Mitochondria Are a Subset of Extracellular Vesicles Released by Activated Monocytes and Induce Type I IFN and TNF Responses in Endothelial Cells. Circulation Research 125, 43–52
22
37. Torralba, D., Baixauli, F., and Sánchez-Madrid, F. (2016) Mitochondria Know No Boundaries: Mechanisms and Functions of Intercellular Mitochondrial Transfer. Front Cell Dev Biol 4, 107 38. Rodriguez, A.-M., Nakhle, J., Griessinger, E., and Vignais, M.-L. (2018) Intercellular mitochondria
trafficking highlighting the dual role of mesenchymal stem cells as both sensors and rescuers of tissue injury. Cell Cycle 17, 712–721
39. Mahrouf-Yorgov, M., Augeul, L., Da Silva, C. C., Jourdan, M., Rigolet, M., Manin, S., Ferrera, R., Ovize, M., Henry, A., Guguin, A., Meningaud, J.-P., Dubois-Randé, J.-L., Motterlini, R., Foresti, R., and
Rodriguez, A.-M. (2017) Mesenchymal stem cells sense mitochondria released from damaged cells as danger signals to activate their rescue properties. Cell Death and Differentiation 24, 1224–1238 40. Patel, D., Rorbach, J., Downes, K., Szukszto, M. J., Pekalski, M. L., and Minczuk, M. (2017)
Macropinocytic entry of isolated mitochondria in epidermal growth factor-activated human osteosarcoma cells. Scientific Reports 7, 12886
41. Wang, J., Li, H., Yao, Y., Zhao, T., Chen, Y., Shen, Y., Wang, L., and Zhu, Y. (2018) Stem cell-derived mitochondria transplantation: a novel strategy and the challenges for the treatment of tissue injury. Stem
Cell Res Ther 9, 106
42. Pua, H. H., Guo, J., Komatsu, M., and He, Y.-W. (2009) Autophagy Is Essential for Mitochondrial Clearance in Mature T Lymphocytes. The Journal of Immunology 182, 4046–4055
43. Grazioli, S. and Pugin, J. (2018) Mitochondrial Damage-Associated Molecular Patterns: From Inflammatory Signaling to Human Diseases. Frontiers in Immunology 9, 832
44. Rodríguez-Nuevo, A. and Zorzano, A. (2019) The sensing of mitochondrial DAMPs by non-immune cells.
23
Figure legends:
Figure 1: Plasma of healthy individuals contain a population of cell-free mitochondrial DNA that is well preserved and not fragmented.
(A) NcfDNA and McfDNA quantification in plasma samples of 99 healthy individuals. McfDNA copy number
is significantly higher than that of NcfDNA (p<0.0001). The lines inside the boxes and the upper and lower limits of the boxes indicate the median, 75th and 25th percentiles, respectively. The upper and lower horizontal bars indicate the maximum and minimum values, respectively. (B) NcfDNA and McfDNA integrity index calculated for plasma samples of 13 healthy individuals, demonstrating that almost all the quantified McfDNA have a main size above 300 bp, and are less fragmented than NcfDNA (p<0.0001). (C) Size fractionation following agarose gel electrophoresis of a pool of cfDNA extracts obtained from 80 healthy individuals’plasma. McfDNA fragments were quantified by q-PCR from extracts of the excised agarose gel slices above (Long) and below (Short) 500bp. (D) DNA fragment size profile at single base resolution obtained by paired-end massively parallel WGS of cfDNA extracted from a healthy individual’s plasma. (Blue for NcfDNA and red for McfDNA).
24 Figure 2: Kinetic study of NcfDNA and McfDNA stability in cell culture media
The evaluation of the stability of cfDNA (NcfDNA and McfDNA) derived from SW620 (A) and DLD-1 (B) cell culture media over time independently of the cells. NcfDNA and McfDNA concentration was measured using q-PCR, by amplifying an amplicon of 305 bp and 296 bp respectively. (D: day)
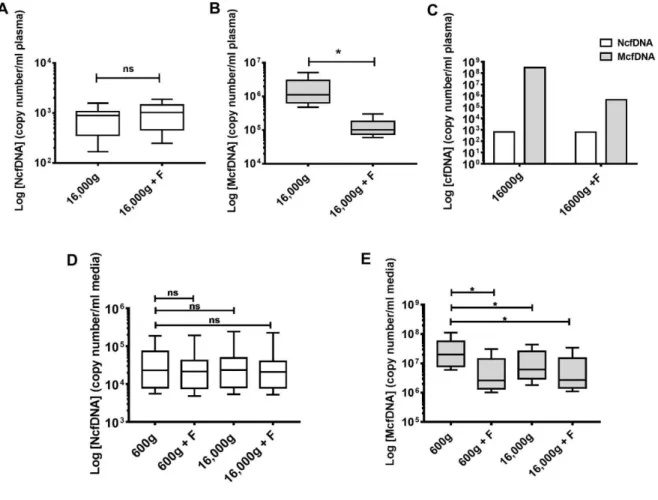
25 Figure 3: Plasma of healthy individuals and cell culture media contain structures enclosing mitochondrial cell-free DNA.
(A) cfDNA content following three different subsequent treatments of plasma: (i) by high-speed centrifugation,
(ii) by filtration (0.22µM) in Ficoll isolated plasma and (iii) by high-speed centrifugation in plasma isolated by a protocol precluding activation of platelets (PPAP). LS and HS, low and high-speed centrifugation at 16,000g;
26
NF and F, non-filtered and filtered plasma (Fig S 4); n=8 p=0.0630, n=7 p=0.0009 and n=4 p=0.0173, respectively. (B) Decrease of the cfDNA content in the DLD-1/SW620/CCD-18Co cell culture media after an initial low-speed (LS, 600g) and a subsequent high-speed centrifugation (HS, 16,000g). (Methods and Fig S 4). n=28. p<0.0001. (C) Proportion of NcfDNA and McfDNA plasma contents after treatment of PPAP plasma (Table S 2). n=4. (D) NcfDNA copy number in healthy individuals’ plasma prepared under PPAP and subsequently filtered and/or centrifuged at either 2,500 or 16,000g (n=5). (E) McfDNA copy number in healthy individuals’ plasma prepared under PPAP and subsequently filtred and/or centrifuged at either 2,500 or 16,000g. n=5, p=0.0111, p=0.0114, p=0.0115, respectively.
27 Figure 4: Plasma of healthy individuals and cell culture media contain structures enclosing whole intact mitochondrial genome.
(A) Adapted schematic view of the Long-range (LR) PCR amplification strategy for testing mitochondrial
genome integrity. Overlapping amplicons amplify the whole mitochondrial genome by using the two htm1 and htm2 sequences or the three mito1, mito2 and mito3 sequences. (B) Agarose gel analysis of LR-PCR amplified mitochondrial DNA demonstrating the presence of a preserved cell free mitochondrial genome in cell culture media and plasma pellet. Extracted DNA from isolated mitochondria from SW620 cells (lane b, positive control), the 16,000g pellet (16gP) from the SW620 cells culture medium (lane c), the 16gP from the DLD-1 cells culture medium (lane d), a mouse genomic DNA (lane e, negative control), the Repli-g mitochondrial DNA kit’s Water (lane f, negative control), the PCR water (lane g, negative control), the 16gP from two different plasma pools (lane i, j), were amplified using the repli-g mitochondrial DNA kit and the 5 sets of primers for the Mito1 (3,968pb), Mito2 (5,513bp), Mito3 (7,814bp,) htm1 (9,289bp) and htm2 (7,626bp) amplicons. PCR-products analysis on a 0,8% agarose gel reveals the expected amplicons in the 16gPs from cell culture media and from plasma, demonstrating the presence of a whole mitochondrial genome. No signal was detected in negative control. (Lanes a. Lane h, 1kb DNA ladder).
28 Figure 5: Both plasma of healthy individuals and cell culture media contain cell free mitochondrial material. Flow cytometry analysis of preparations stained with mitochondrial specific dye MitoTracker Green
of (A), Isolated mitochondria (IM) from DLD-1 cells (positive control); (B and C), two negative controls: isolated nucleus and 16gP obtained from fresh cell media and; (D), the 16gP isolated from DLD-1 centrifuged cell culture media (CCCM); (E), the four previous samples; and (F), the 16gP isolated from the plasma of an healthy donor. Results were analyzed with Kaluza analysis 1.5 software. Immunoblotting of membranes by labelling the inner (Tim23) and outer (Tom22) mitochondrial membrane proteins (G): Tim23 (lane a: 16gP from PPAP plasma; lane b: 16gP from CCD-18Co CCCM; lane c: 16gP from SW620 CCCM; lane d: 16gP from DLD-1 CCCM; lane e: IM from CCD-18Co cells; lane f: IM from SW620 cells; lane g: IM from DLD-1
29
cells; lane h: IM from DLD-1 cells). (H): Tom 22 (lane a: IM from DLD-1 cells; lane: IM from CCD-18Co cells; lane c: IM from SW620 cells; lane d: IM from SW620 cells; lane e: 16gP from DLD-1 CCCM; lane f: 16gP from CCD-18Co CCCM; lane g: 16gP from SW620 CCCM; lane h: 16gP from PPAP plasma).
30 Figure 6: Both plasma of healthy individuals and cell culture media contain structurally intact mitochondria. Fluorescence microscopy images of the MitoTracker Green stained 16gP from PPAP plasma (A), SW620 CCCM (B) and DLD1 CCCM (C). Electron microscopy images of the 16gP from of a PPAP
31 Figure 7: Both plasma of healthy individuals and cell culture media contain respiratory-competent mitochondria. The electron flow experiment performed using a seahorse XF96 instrument. Like the positive
control (Isolated mitochondria from DLD-1), OCR was detectable in both 16gP from DLD-1 cell media and plasma pool, in the presence of pyruvate and malate that drive respiration via complex I (A). There was a decrease in OCR when rotenone was injected, indicating an inhibition of complex I-driven respiration. When complex II-driven respiration was initiated, by sequential addition of succinate, a slight increase in OCR was observed, indicating that complex II may be functional. The inhibition of complex III (antimycin A) and the stimulation of complex IV (ascorbate + TMPD), led to a detectable activity of cytochrome C/complex IV in all the samples. Each value shown was from a minimum of three replicates. The data are presented in (A) as mean (symbol) ± SD (line). The four injections are shown as dashed lines.
32
Supplemental Information
Figure S1-6
33
Figure S 1: Respective concentration and fragmentation index of N- and McfDNA in mCRC patient plasma.
(A) Quantification of circulating DNA from nuclear (NcfDNA) and mitochondrial (McfDNA) origin, in 50 patients with metastatic colorectal cancer (mCRC) as expressed in copy number/ml, demonstrating significantly more mitochondrial than nuclear genome copies. p<0.0001. (B) Integrity index of NcfDNA and McfDNA examined in 3 plasma samples from mCRC patients, demonstrating that McfDNA is significantly less fragmented than NcfDNA. p=0.0001.
34
Figure S 2: Respective concentration of N- and McfDNA in healthy individuals and mCRC patient plasma in ng/ml.
Quantification of circulating DNA from nuclear (NcfDNA) and mitochondrial (McfDNA) origin, in 99 plasma samples of healthy individuals (A) and in 50 patients with metastatic colorectal cancer (mCRC) (B) as expressed in ng/ml .p<0.0001.
35
Figure S 3: Filtration step demonstrating that structures associated with McfDNA are larger than 0,22 µm in both plasma and cell media supernatant.
Copy number of either (A) NcfDNA or (B) McfDNA in filtered or non-filtered (0.22µm) plasma of healthy individuals, extracted by ficoll, and quantified by q-PCR. The copy number of NcfDNA was not affected by filtration while the copy number of McfDNA was significantly decreased. F=Filtration, NcfDNA, p=0.3185, McfDNA, p=0.0121, n=9. (C) Filtration process performed on plasma extracted by a different protocol (two centrifugation steps at 1,200g then 16,000g), that validate the results obtained in A and B. Copy number of either (D) NcfDNA or (E) McfDNA in DLD-1/SW620/CCD-18Co culture medium processed by 4 different protocols (one centrifugation at 600 g without or with 0.22 μm filtration/ two centrifugation steps at 600g and 16,000g without or with 0.22 μm filtration). A significant decrease of the copy number of McfDNA upon filtration or 16,000g centrifugation is observed in cell culture media. n=8. Probabilities: between 600g and 600g + F, p=0.0275; between 600g and 16,000g, p=0.0313; between 600g and 16,000g + F, p=0.0256. Results are similar to those from plasma (Figure 3A-D-E).
36
Figure S 4: Cell free McfDNA containing structures are stable and pelleted by 16 000g centrifugations of cell culture media.
Copy number of either (A) NcfDNA or (B) McfDNA in DLD1, SW620 or CCD-18Co cell culture medium quantified by q-PCR after each centrifugation step (600g/16,000g/40,000 g/200,000g). We found that (i), most of the McfDNA from cell culture media is pelleted after the 16,000g centrifugation; (ii) an augmentation of the decrease of the copy number of both NcfDNA and McfDNA with serial centrifugation steps suggesting the presence of distinct structures of cfDNA in the cell culture media; and (iii), NcfDNA and McfDNA were both detected in the supernatant collected after the 200,000 g centrifugation, suggesting the presence of vesicle-free NcfDNA and McfDNA. n=14. NcfDNA: Between 600g and 16,000g,
p=0.4817; between 600g and 40,000g, p=0.0044; between 600g and 200,000g, p=0.0015. McfDNA: Between 600g and 16,000g, p=0.0034; between 600g and 40,000g, p=0.0023; between 600g and 200,000g, p=0.0013. (C) Schematic view of the proportion of mitochondrial and nuclear cfDNA in
the cell-culture media supernatant after an initial centrifugation at 600g for 10min and a second at 16,000g for 10 min. Values are determined as described in table S1. (CCCM, Centrifuged cell culture media). (D) The 16gP from cell media supernatant (50 flask T-75/cell line) was treated, or not, with 1 U of DNAse I (Thermo Fischer, Illkirch , France) for 30min at 37°C. After DNAse I inactivation with 2.5mM EDTA for 10min at 65°C, DNA was extracted and quantified by q-PCR analysis. The NcfDNA significantly decreased with DNAse I treatment whereas McfDNA was unaffected by DNAse I treatment.
37
Figure S 5: Flow cytometry analysis of mitoTracker Green staining.
Blue histograms were obtained from MitoTracker-stained samples, and grey histograms, from non-stained samples. Mitochondria singlets were selected using the gating procedure described in Methods section. Figure parts highlight (A) MitoTracker Green-positive isolated mitochondria from SW620 cells (positive control); (B) MitoTracker Green-negative SW620 nucleus (negative control); (C) MitoTracker Green-negative isolated 16gP from fresh RPMI medium (negative control) (D) MitoTracker Green-positive isolated 16gP from the SW620 cell culture medium. (E) Plots of the blue histograms from the four MitoTracker Green-stained samples (A-B-C-D): (purple, 16gP from fresh media; blue, the 16gP from the SW620 cell culture medium; green, mitochondria isolated from SW620 cells; and orange, isolated nucleus from SW620 cells). The overlay of histograms of the positive control and of the 16gP from the SW620 culture medium clearly demonstrates the presence of mitochondria in the SW620 cell culture medium pellet. Analysis of MitoTracker Green-stained 16gP from ficoll extracted plasma of other healthy donors #2 (F), #3 (G), #4 (H) and #5 (I). We confirmed the presence of mitochondria in the plasma 16gP in all four donor’s plasma. (J) Fluorescence microscopy images of the MitoTracker Green stained cells without fixation
38
Figure S 6: Schematic view of the protocols used in this study.
(A) Differential centrifugations of plasma extracted by Ficoll and cell media supernatant. The plasma was isolated at 400g with Ficoll gradient, and the cell culture media was centrifuged at 600g. Both were centrifuged after, at 16,000g for 10min at 4°C, (Microstar centrifuge, vwr), and then further centrifuged at 40,000g for 1 h at 4°C and finally at 200,000g for 2 h at 4°C (Beckman MLA-130 Ultracentrifuge Rotor). After each centrifugation step, the cfDNA was extracted from supernatants for q-PCR analysis. (B) Filtration of plasma isolated by Ficoll, or by 1,200g centrifugation. After isolation, plasma was centrifuged at 16,000g for 10 min at 4°C and aliquoted in 2 equal volumes for each individual; one was considered as a control with no additional treatment and the other aliquot was filtered with a 0.22 µM filter (Sartorius Minisart high flow, Fisher Scientific, Illkirc, Franceh). The cfDNA was extracted and then analyzed by q-PCR. (C) Filtration of the 600g centrifuged cell culture media and the isolated plasma without platelet activation. They were both aliquoted in 4 equal volumes; the first was considered as a control, the second was filtered with a 0.22 µM filter, the third was centrifuged at 16,000g for 10 min at 4°C and the fourth aliquot was centrifuged at 16,000g for 10min at 4°C and further filtered with a 0.22 µM filter. The cfDNA was extracted and then analyzed by q-PCR. (D) Table summarizing the different centrifugation protocols used in this study for isolating and characterizing cell free mitochondria. SP, Standard protocol for plasma isolation in EDTA tube by double centrifugation; FP, Plasma extracted by Ficoll gradient; PPAP, protocol precluding activation of platelet; CCCM, centrifuged cell culture media. (E), Protocols using differential centrifugation speeds up to 200,000g.
39
Table S 1: Primers used in PCR analysis. * 5′ amino-C6 modification, F: Forward, R: Reverse.
Primer Sequence 5′ → 3′ Amplicon size
(bp)
MIT MT-CO3 F GACCCACCAATCACATGC MIT MT-CO3 R1 TGAGAGGGCCCCTGTTAG 67 MIT MT-CO3 R2 CTCAGAAAAATCCTGCGAAGA 296 KRAS F1 CCTTGGGTTTCAAGTTATATG 67 KRAS F2 GCCTGCTGAAAATGACTGA 305 KRAS R1 CCCTGACATACTCCCAAGGA Mito1 F *ACATAGCACATTACAGTCAAATCCCTTCTCGTCCC 3,968 Mito1 R *TGAGATTGTTTGGGCTACTGCTCGCAGTGC Mito2 F *TACTCAATCCTCTGATCAGGGTGAGCATCAAACTC 5,513 Mito2 R *GCTTGGATTAAGGCGACAGCGATTTCTAGGATAGT Mito3 F *TCATTTTTATTGCCACAACTAACCTCCTCGGACTC 7,814 Mito3 R *CGTGATGTCTTATTTAAGGGGAACGTGTGGGCTAT hmt 1 F *AACCAAACCCCAAAGACACC 9,289 hmt 1 R *GCCAATAATGACGTGAAGTCC hmt 2 F *TCCCACTCCTAAACACATCC 7,626 hmt 2 R *TTTATGGGGTGATGTGAGCC