HAL Id: hal-02528275
https://hal.archives-ouvertes.fr/hal-02528275
Submitted on 2 Apr 2020
HAL is a multi-disciplinary open access
archive for the deposit and dissemination of
sci-entific research documents, whether they are
pub-lished or not. The documents may come from
teaching and research institutions in France or
abroad, or from public or private research centers.
L’archive ouverte pluridisciplinaire HAL, est
destinée au dépôt et à la diffusion de documents
scientifiques de niveau recherche, publiés ou non,
émanant des établissements d’enseignement et de
recherche français ou étrangers, des laboratoires
publics ou privés.
years later
Karen Assmann, Mathilde Touvier, Valentina Andreeva, Mélanie Deschasaux,
Thierry Constans, Serge Hercberg, Pilar Galan, Emmanuelle Kesse-Guyot
To cite this version:
Karen Assmann, Mathilde Touvier, Valentina Andreeva, Mélanie Deschasaux, Thierry Constans, et
al.. Midlife plasma vitamin D concentrations and performance in different cognitive domains assessed
13 years later. British Journal of Nutrition, Cambridge University Press (CUP), 2015, 113 (10),
pp.1628-1637. �10.1017/S0007114515001051�. �hal-02528275�
Midlife plasma vitamin D concentrations and performance in different
cognitive domains assessed 13 years later
Karen E. Assmann
1*, Mathilde Touvier
1, Valentina A. Andreeva
1, Me´lanie Deschasaux
1,
Thierry Constans
2,3, Serge Hercberg
1,4, Pilar Galan
1and Emmanuelle Kesse-Guyot
11Universite´ Paris 13, Equipe de Recherche en Epide´miologie Nutritionnelle (EREN), Centre d’Epide´miologie et Statistiques
Sorbonne Paris Cite´, Inserm (U1153), Inra (U1125), Cnam, COMUE Sorbonne Paris Cite´, SMBH Universite´ Paris 13, 74 rue Marcel Cachin, F-93017 Bobigny, France
2Centre Me´moire et De´partement de Ge´riatrie, CHU de Tours, Tours, France 3Universite´ Franc¸ois Rabelais, Tours, France
4De´partement de Sante´ Publique, Hoˆpital Avicenne, Bobigny, France
(Submitted 9 September 2014 – Final revision received 5 March 2015 – Accepted 9 March 2015 – First published online 13 April 2015)
Abstract
25-Hydroxyvitamin D (25(OH)D) insufficiency is very common in many countries. Yet, the extent to which 25(OH)D status affects cognitive performance remains unclear. The objective of the present study was to evaluate the cross-time association between midlife plasma 25(OH)D concentrations and subsequent cognitive performance, using a subsample from the French ‘SUpple´mentation en Vitamines et Mine´raux AntioXydants’ randomised trial (SU.VI.MAX, 1994 – 2002) and the SU.VI.MAX 2 observational follow-up study (2007 – 9). 25(OH)D concentrations were measured in plasma samples drawn in 1994 – 5, using an electrochemoluminescent immunoassay. Cognitive performance was evaluated in 2007 – 9 with a neuropsychological battery including phonemic and semantic fluency tasks, the RI-48 (rappel indice´-48 items) cued recall test, the Trail Making Test and the forward and backward digit span. Cognitive factors were extracted via principal component analysis (PCA). Data from 1009 individuals, aged 45 – 60 years at baseline, with available 25(OH)D and cognitive measurements were analysed by multivariable linear regression models and ANCOVA, stratified by educational level. PCA yielded two factors, designated as ‘verbal memory’ (strongly correlated with the RI-48 and phonemic/semantic fluency tasks) and ‘short-term/working memory’ (strongly correlated with the digit span tasks). In the fully adjusted regression model, among individuals with low education, there was a positive association between 25(OH)D concentrations and the ‘short-term/working memory’ factor (P¼ 0·02), mainly driven by the backward digit span (P¼ 0·004). No association with either cognitive factor was found among better educated participants. In conclusion, higher midlife 25(OH)D concentrations were linked to better outcomes concerning short-term and working memory. However, these results were specific to subjects with low education, suggesting a modifying effect of cognitive reserve.
Key words:Vitamin D: Cognition: Ageing: Memory
Inadequate 25-hydroxyvitamin D (25(OH)D) concentrations are a major public health concern as they are highly prevalent in many countries(1), and have been associated with numerous health outcomes such as hypertension, CVD and decline in physical functioning(2). The definition of vitamin D status is controversial(3). Briefly, plasma 25(OH)D concentrations ,20 ng/ml tend to be considered as ‘insufficient’ or ‘(moder-ately) deficient’, and concentrations , 10 ng/ml as ‘(severely) deficient’(3 – 5). The proposed cut-off values for a ‘sufficient’ status vary, one suggested value is $ 30 ng/ml(3 – 5). In France, 47·3 % of the adult population is estimated to have concen-trations , 20 ng/ml(5). Socially disadvantaged populations seem to be affected to a much higher degree: in a sample of
French food aid users, 45·9 % had concentrations , 10 ng/ml, and 44·2 % had concentrations between 10 and 19 ng/ml(6).
Meanwhile, support for the neurocognitive benefits of 25(OH)D has also begun to accumulate(7 – 9). Vitamin D recep-tors and the enzyme that converts vitamin D into its active form (1-a-hydroxylase) have been detected in the brain(7,10), and experimental studies in animals and cell cultures have pro-vided support for both direct(11)and indirect(12)neuroprotective
actions of vitamin D. This is of great public health interest because effective treatments for conditions such as Alzheimer’s disease are not yet available(13). Moreover, cognitive decline is a long-term process, especially in the case of Alzheimer’s disease, where the diagnosis is preceded by a very long
* Corresponding author: K. E. Assmann, fax: þ 33 1 48 38 89 31, email k.assmann@eren.smbh.univ-paris13.fr
Abbreviations: 25(OH)D, 25-hydroxyvitamin D; PCA, principal component analysis; SU.VI.MAX, SUpple´mentation en Vitamines et Mine´raux AntioXydants.
British Journal of Nutrition (2015), 113, 1628–1637 doi:10.1017/S0007114515001051 qThe Authors 2015
British
Journal
of
Nutrition
Downloaded from https://www.cambridge.org/core . IP address: 109.221.210.240 , on 02 Apr 2020 at 10:03:59, subject to the Cambridge Core terms of use, available at
https://www.cambridge.org/core/terms
.
pre-symptomatic phase. Thus, it is probably possible to intervene in a preventive manner(14). Accordingly, it is impor-tant to collect long-term prospective data on potentially protective or detrimental factors during midlife (or even earlier) in relation to cognitive outcomes later in life.
Meta-analyses and systematic reviews of epidemiological studies have suggested a link between higher 25(OH)D concentrations and better cognitive health; yet, there is a considerable amount of inconsistency in study results(8,15 – 17). This has been attributed to cross-sectional study designs, inade-quate statistical adjustment and heterogeneity in cognitive function measures and 25(OH)D cut-off values(7,8,10,17,18). Moreover, little is known about the role of vitamin D in different cognitive domains(17).
In the present study, we investigated the association between 25(OH)D concentrations at midlife and performance in several cognitive domains assessed 13 years later.
Subjects and methods Study design and participants
The French ‘SUpple´mentation en Vitamines et Mine´raux Anti-oXydants’ study (SU.VI.MAX, 1994 – 2002) was a randomised, double-blind, placebo-controlled primary prevention trial on the effect of daily, nutritional-dose antioxidant vitamin and mineral supplementation (ascorbic acid (120 mg), vitamin E (30 mg), b-carotene (6 mg), Se (100 mg) and Zn (20 mg)) on CVD and cancer incidence(19). Details about the cohort are available elsewhere(19). Briefly, 12 741 volunteers aged 35 – 60 years (women) or 45 – 60 years (men) who were free of any disease likely to hinder active participation or threaten 5-year survival were included in the trial. Following the trial phase, a total of 6850 individuals were included in the SU.VI.MAX 2 observational follow-up study (2007 – 9)(20).
Baseline measurements of 25(OH)D concentrations were available for a subsample of participants included in a nested case – control study set-up to investigate the link between plasma 25(OH)D and cancer risk. The nested cohort included all first primary incident cancer cases diagnosed between 1994 and 2007 (n 928) and one or two matched controls (n 1850) per case. Controls were ran-domly selected among the participants of identical sex, age (10-year strata), intervention group and season of blood draw. We restricted the present analyses to control subjects aged 45 – 60 years at baseline (in order to obtain similar age ranges for men and women, and to obtain a sample of participants of relatively old age at follow-up) with complete data on cognitive test variables at follow-up.
Standard protocol approvals, registrations and patient consents
The SU.VI.MAX and SU.VI.MAX 2 studies were conducted according to the guidelines laid down in the Declaration of Helsinki, and all procedures involving human subjects/ patients were approved by the Ethics Committee for Studies with Human Participants of Paris-Cochin Hospital (CCPPRB
no. 706 and no. 2364, respectively) and the Commission Nationale de l’Informatique et des Liberte´s (CNIL no. 334641 and no. 907094, respectively). Written informed consent was obtained from all subjects. The SU.VI.MAX trial was registered at www.clinicaltrials.gov under NCT00272428.
Assessment of plasma vitamin D concentrations
A 35 ml venous blood sample was collected at baseline in vacutainer tubes from each participant following fasting for 12 h at the time of the visit. All blood draws occurred between October 1994 and April 1995. Blood samples were centrifuged immediately after the blood draw, and plasma aliquots were stored in dry ice less than 1 h after blood draw for shipment to the central biobank (maximum 24 h), where they were stored frozen in liquid nitrogen (2 1968C). Concentrations of 25(OH)D were analysed via the Roche Cobas electrochemolu-minescent total 25(OH)D assay(21,22).
Cognitive assessment and scoring
Cognitive performance was evaluated during the SU.VI.MAX 2 Study (2007 – 9) by trained neuropsychologists using a battery of validated tools. A summary of the applied tests and the com-putation of cognitive outcome variables are shown in Fig. 1. Briefly, episodic memory was evaluated with the validated French ‘rappel indice´-48 items’ (RI-48) cued recall test where subjects were presented with a list of forty-eight words divided into twelve categories. For each word correctly recalled, one point was attributed (thus the maximum score was 48)(23). For this analysis, we considered the number of words remembered during the ‘delayed cued recall’. Lexical semantic memory was assessed in a timed manner by a phonemic fluency task (citing words beginning with the letter P) and a semantic fluency task (naming as many animals as possible). The respective score on each task was the number of correct words produced during a 2-min period(24). The French version of these fluency tasks has been validated(25,26). Two-digit span tasks (issued from the validated Wechsler Adult Intelligence Scale-Third Edition(27), that have also been validated in French(28,29)), served to assess short-term (forward digit span) and working memory (backward digit span). These tasks consisted in immediately repeating growing series of digits (in inverse order for the backward digit span), with one point attributed for each sequence repeated correctly (maximum score for each span: 14). Mental flexibility was assessed via the number – letter switching task (condition 4) of the Delis – Kaplan Trail Making Test, which has been validated in English(30), and whose original form (the ‘classical’ Trail Making Test) has also been validated in French(31,32). The task consists of alternately connecting numbers and letters presented in circles (i.e. 1 – A – 2 – B) as quickly as possible. Based on the time taken, reverse-coded, logarithmised, age-corrected scaled scores were calculated using the conversion tables provided by Delis and Kaplan.
In order to obtain synthetic cognitive variables, we per-formed principal component analysis (PCA) on the individual test scores. PCA calculates ‘factors’ that are linear combi-nations of the initial variables (the cognitive test scores in
British
Journal
of
Nutrition
https://www.cambridge.org/core . IP address: 109.221.210.240 , on 02 Apr 2020 at 10:03:59, subject to the Cambridge Core terms of use, available at
https://www.cambridge.org/core/terms
.
our case) that explain a maximum of the structure of the var-iance – covarvar-iance matrix of the initial variables(33). Habitually, PCA factors are then named after the initial variables with which they are the most strongly correlated (we followed the suggestion of Kline(34) to consider factor loadings . 0·6 as indicators of substantial correlations). Thus, PCA served to group tests measuring similar cognitive domains. We used a Cattel’s scree plot to determine the number of factors to retain. The obtained factors were converted to T scores (mean ¼ 50,SD¼ 10).
Next, all individual test scores were also converted to T scores, and a ‘composite cognitive score’ was created by calculating the mean of the cognitive test 2 T scores, and rescaling the obtained value toSD¼ 10.
Covariates
At baseline, participants completed self-administered ques-tionnaires providing data on sociodemographics (sex, age and education), lifestyle (physical activity and smoking), memory complaints (yes/no) and medication use. Further, alcohol intake (g/d) was estimated using a short validated semi-quantitative dietary questionnaire(35), and information on the skin phototype was obtained via a questionnaire based on the Fitzpatrick classification (I: always burns, never tans; II: burns easily, tans minimally; III: burns moderately, tans uniformly; IV: burns minimally, always tans well; V: rarely burns, tans profusely; VI: never burns)(36). Baseline BMI (kg/m2) was calculated using height and weight measurements performed by a trained personal at the 1995 – 6 clinical examination.
Information on hypertension ($ 140/90 mmHg) and diabetes (fasting blood glucose $ 7 mmol/l, or anti-diabetic medication use, or self-reported diagnosis) over follow-up was obtained as previously reported(37). ‘History’ of diabetes and of
hyper-tension was defined as having the respective condition at baseline or having acquired it during the follow-up.
In case of suspected CVD during follow-up, relevant medical data were requested from participants, physicians, and/or hospitals, and reported events were reviewed by an indepen-dent expert committee. Concomitant with the cognitive evaluation, depressive symptoms were assessed with the vali-dated French version of the Center for Epidemiologic Studies Depression Scale(38).
Missing values on covariates were dealt with by attributing the mean or mode, as appropriate (number of missing values per variable: smoking habits, n 29; physical activity level, n 2; living situation, n 21; Center for Epidemiologic Studies Depression Scale, n 9). In order to verify that this did not affect the results of the present study, we conducted sensitivity analyses using multiple imputation techniques (SAS PROC MI and PROC MI ANALYZE).
Statistical analysis
Baseline characteristics were presented by 25(OH)D status (sufficient: $ 30 ng/ml; insufficient: $ 20 and , 30 ng/ml; moderately deficient: $ 10 and , 20 ng/ml; severely deficient: ,10 ng/ml(5)). Because not all variables were normally distributed, values were stated as median (25th and 75th percentile), and differences were tested using x2 tests and Kruskal – Wallis tests.
Cognitive domain investigated Test used Lexical-semantic memory
Episodic memory Short-term memory
Working memory Mental flexibility
Phonemic fluency task* Semantic fluency task*
RI-48 cued recall test‡ Forward digit span† Backward digit span† Number–letter switching task of the
Delis–Kaplan Trail Making Test§
Composite cognitive score: mean of the individual test scores (after conversion
of the test scores to T scores)||
Extraction of synthetic cognitive factors via principal component analysis with orthogonal rotation¶
Factor 1: Strongly correlated with
the fluency tasks and the RI-48 → named
‘verbal memory’
Factor 2: Strongly correlated with the forward + backward
digit span → named ‘short-term/
working memory’
Fig. 1. Cognitive tests applied and calculation of the cognitive outcome variables. * Lezak et al.(24). † Wechsler(27). ‡ Adam et al.(23). § Delis et al.(30). k In order to
obtain the final composite cognitive score, the mean of the individual T scores was rescaled toSD¼ 10. { Principal component analysis calculates ‘factors’ that are linear combinations of the initial variables (the cognitive test scores in our case), which explain a maximum of the structure of the variance – covariance matrix of the initial variables. Principal component analysis factors were converted to T scores (mean ¼ 50,SD¼ 10). RI-48, Rappel indice´-48 items.
K. E. Assmann et al. 1630
British
Journal
of
Nutrition
Downloaded from https://www.cambridge.org/core . IP address: 109.221.210.240 , on 02 Apr 2020 at 10:03:59, subject to the Cambridge Core terms of use, available at
https://www.cambridge.org/core/terms
.
Associations between 25(OH)D concentrations and cogni-tive outcomes were analysed by linear regression models. In addition, we computed adjusted means and 95 % CI of each cognitive factor by categories of 25(OH)D status, using ANCOVA. Differences in adjusted means across categories were evaluated by a linear contrast test.
We tested potential effect modification by sex, treatment allocation during the trial phase and educational level. As there was a significant interaction between educational level and 25(OH)D concentrations concerning the composite score and one of the two factors derived from PCA (factor 2, P, 0·10), all analyses were stratified by educational level (primary, secondary and higher education).
Model 1 was adjusted for sex, age at the neuropsycho-logical evaluation (years), duration of follow-up (years) and the season during which the plasma sample was drawn (October – December, January – April). Model 2 was further adjusted for treatment allocation group (supplemented, placebo), occupational category (inactive or unemployed, retired, agricultural or manual work, intermediate profession, leadership position or intellectual profession), living situation (alone, in a couple), physical activity (no regular activity, regular activity equivalent to , 1 h of walking/d, regular activity equivalent to $ 1 h of walking/d), smoking status (non-smoker, former smoker, present smoker), alcohol consumption (g/d), baseline BMI (kg/m2), self-reported memory troubles at
baseline (yes/no) and depressive symptoms at follow-up (Center for Epidemiologic Studies Depression Scale score).
The creation of the ‘season’ variable was based on to the observed variation in 25(OH)D by month of blood draw (of note, adjusting for the month of blood draw as a continuous variable did not substantially change the present results (data not shown)).
As vascular health(9) and diabetes(39,40) may mediate the association between 25(OH)D concentrations and cognitive functioning, we created an additional model (model 3) with further adjustment for major cardiovascular events during follow-up, history of diabetes and history of hypertension.
All analyses were conducted using Statistical Analysis Sys-tems statistical software package version 9.3 (SAS Institute), with a significance level of 0·05 (except for the interaction terms, where a significance level of 0·10 was applied, as the statistical power for such tests tends to be lower(41)). In order to account for multiple comparisons, results were hierarchically interpreted – considering the composite cogni-tive score and the PCA-derived factors as our main outcomes, and the cognitive test scores as secondary outcomes.
Results
Participant characteristics
Of the 1850 cancer-free subjects with available 25(OH)D data, 1217 were within the specified age range, of whom 1009 (552 men and 457 women) had complete data on cognitive test variables at follow-up. Individuals in our final study sample had a mean age of 66·6 (SD 4·5) years at the
neuropsycho-logical evaluation, and a mean follow-up time of 13·4 (range
12·7 – 14·7) years. Only 15·9 % had a sufficient 25(OH)D status (27·3 % had an insufficient status, 42·3 % were moder-ately deficient and 14·6 % severely deficient).
Participants of the SU.VI.MAX Study that were not included in the present study sample (because they were not part of the control subjects of the nested case – control study for which 25(OH)D measurements were performed, younger than 45 years at baseline, or had missing data on cognitive variables at follow-up) significantly differed from those included in the present study sample with respect to several baseline variables. Excluded participants were younger, more often female, more often smokers and declared memory troubles, declared less often high levels of physical activity and had a lower BMI, lower systolic and diastolic blood pressures, and lower fasting blood glucose (online Supplementary Table S1). When comparing only those excluded participants that were older than 45 years at baseline (n 8858) to included participants, the only significant differences that remained between the two groups concerned age (excluded participants were younger), sex (excluded participants were more often women) and smoking status (excluded participants were more often smokers) (data not shown).
Table 1 presents participant characteristics by vitamin D status. Subjects with a better 25(OH)D status were older, more frequently male, less often living alone, had a higher Fitzpatrick-phototype index, consumed more alcohol and were more likely to report increased physical activity. Moreover, they were less likely to have a history of diabetes and their blood samples were more frequently drawn in October – December.
Identification of principal component analysis-derived cognitive factors
PCA revealed two cognitive factors related to verbal memory and short-term/working memory (Table 2), accounting for 62·0 % of the total initial variance in cognitive performance. The first factor (‘verbal memory’) accounted for 41·0 % of the variance, and was strongly correlated with the RI-48 cued recall, semantic and phonemic fluency (i.e. these cogni-tive tests had loadings . 0·6 on the factor). The second factor (‘short-term and working memory’) accounted for 21·0 % of the variance, and was strongly correlated with the forward and backward digit span. The Trail Making Test had a moder-ate correlation with both factors.
Associations between plasma 25-hydroxyvitamin D concentrations and cognitive outcomes
Table 3 presents the associations between 25(OH)D concen-trations and cognitive outcomes, stratified by educational level. Furthermore, we present adjusted means of the cog-nitive outcomes by categories of vitamin D status, separately for subjects with primary (Table 4), secondary (online Supplementary Table S2) and higher education (online Supplementary Table S3).
In participants with primary education only (n 230), there was a significant linear association between 25(OH)D concentrations
British
Journal
of
Nutrition
https://www.cambridge.org/core . IP address: 109.221.210.240 , on 02 Apr 2020 at 10:03:59, subject to the Cambridge Core terms of use, available at
https://www.cambridge.org/core/terms
.
Table 1. Characteristics of the study sample across categories of plasma vitamin D status (SUpple´mentation en Vitamines et Mine´raux AntioXydants (SU.VI.MAX) and SU.VI.MAX 2 studies, 1994 – 2009, France)*
(Medians with their 25th and 75th percentiles, or percentage n 1009)
n†
,10 ng/ml $10 and , 20 ng/ml $20 and , 30 ng/ml $30 ng/ml
P‡ Median 25th, 75th percentile Median 25th, 75th percentile Median 25th, 75th percentile Median 25th, 75th percentile
Plasma 25(OH)D (ng/ml)§ 1009 7·7 6·5, 9·0 14·8 12·7, 17·2 24·2 21·7, 27·0 36·6 32·8, 42·2 ,0·001
Age at follow-up (years) 1009 66·0 62·0, 70·0 66·0 62·0, 70·0 67·0 63·0, 70·0 69·0 64·0, 71·0 0·008
Follow-up time (years) 1009 13·3 13·0, 13·4 13·3 13·0, 13·7 13·4 13·1, 13·7 13·5 13·2, 13·8 ,0·001
Baseline BMI (kg/m2) 1009 24·7 22·1, 27·8 24·2 22·0, 26·3 24·4 22·1, 26·2 23·9 22·0, 25·7 0·30
% Men 1009 44·9 49·7 61·5 65·6 ,0·001
% Supplementedk 1009 49·0 50·8 51·3 51·9 0·96
% Reported memory troubles 1009 42·9 41·0 38·6 32·5 0·22
% Living alone 988 27·8 11·5 13·6 13·6 ,0·001
CES-D score{ 1000 7·0 4·0, 16·0 7·0 3·0, 13·0 7·0 3·0, 13·0 8·0 4·0, 12·0 0·25
Season of blood draw (%) 1009 ,0·001
October – December 17·7 22·5 39·3 48·8 January – April 82·3 77·5 60·7 51·3 Fitzpatrick-phototype** 1009 0·003 I 7·5 3·0 3·6 1·9 II 27·2 26·0 15·3 18·1 III 52·4 56·0 61·8 61·9 IV 12·9 15·0 19·3 18·1 Educational level (%) 1009 0·77
Primary education only 27·2 21·6 21·8 23·8
Up to secondary education 24·5 25·1 26·9 28·1
Higher education 48·3 53·4 51·3 48·1
Socioprofessional category (%) 1009 0·07
Inactive or unemployed 16·3 14·5 11·3 10·0
Retired 15·0 12·4 18·6 23·8
Agricultural or manual work 4·1 4·0 3·6 5·6
Intermediate professions 44·9 44·7 39·3 36·9 Leadership position†† 19·7 24·4 27·3 23·8 Smoking habits (%) 980 0·10 Non-smoker 54·9 52·9 49·1 43·8 Former smoker 36·6 35·0 40·6 48·4 Present smoker 8·5 12·1 10·3 7·8 Alcohol consumption (g/d) 1009 6·4 0·0, 22·9 13·6 0·0, 26·4 18·1 0·0, 28·3 19·7 4·3, 28·8 ,0·001
Physical activity level (%) 1007 ,0·001
No regular physical activity 29·3 25·8 16·0 19·5
Equivalent to , 1 h of walking/d 35·4 30·1 29·8 22·0 Equivalent to $ 1 h of walking/d 35·4 44·1 54·2 58·5 Medical conditions (%) 1009 Hypertension‡‡ 65·3 58·8 62·2 56·3 0·33 Diabetes‡‡ 15·0 7·7 6·2 9·4 0·02 CVD§§ 5·4 5·2 4·7 6·9 0·81
25(OH)D, 25-hydroxyvitamin D; CES-D, Center for Epidemiological Studies Depression Scale. * Values are characteristics at baseline unless indicated otherwise.
† Total number of subjects without missing data on the respective variable. ‡ x2Test or Kruskal – Wallis test.
§ Measurement: Roche Cobas electrochemoluminescent immunometric assay (Roche Diagnostics). k Intervention group of the SU.VI.MAX trial (antioxidant supplementation).
{ CES-D, administered at follow-up.
** I: always burns, never tans; II: burns easily, tans minimally; III: burns moderately, tans uniformly; and IV: burns minimally, always tans well. No participant in our sample had a Fitzpatrick phototype of V or VI. †† Or intellectual profession.
‡‡ At baseline or follow-up. Hypertension: blood pressure $ 140/90 mmHg or anti-hypertensive medication use. Diabetes: fasting blood glucose $ 7 mmol/l or anti-diabetic medication use, or self-reported diagnosis. §§ Events during follow-up.
K. E. Assmann et al. 1632
British Journal of Nutrition
Downloaded from
https://www.cambridge.org/core
. IP address: 109.221.210.240 , on 02 Apr 2020 at 10:03:59
, subject to the Cambridge Core terms of use, available at
https://www.cambridge.org/core/terms
.
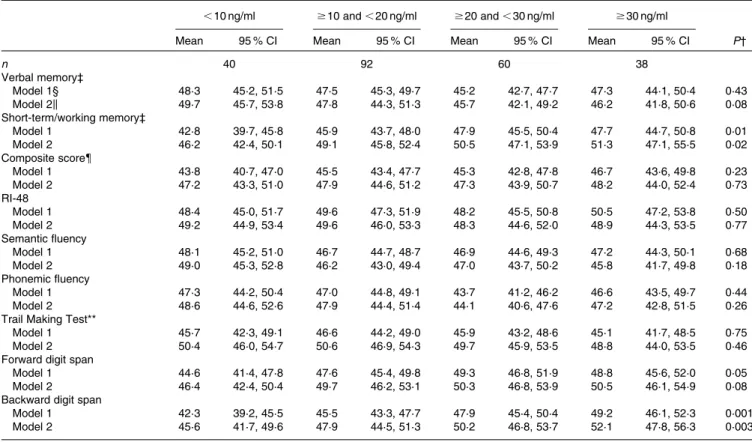
and the ‘short-term and working memory’ factor (model2, P¼ 0·02). After further adjustment for the potential health-related mediators (major cardiovascular events during follow-up, history of diabetes and history of hypertension), the association was only slightly weakened and remained statistically significant (online Supplementary Table S4, P¼0·03). Concerning the three individual cognitive tests correlated with that factor, signi-ficant results were only observed for the backward digit span (model 2, P¼ 0·004). Yet, there was an association between higher 25(OH)D concentrations and scores on the forward digit span with borderline significance (model 2, P¼ 0·05). Plasma vitamin D was not related to the ‘verbal memory’ factor, to any of the cognitive tests correlated with it, or to the com-posite cognitive score. The results obtained when considering categories of vitamin D status were very similar: vitamin D status was significantly related to the ‘short-term and working memory’ factor and the backward digit span.
Among subjects with secondary education (n 262), 25(OH)D concentrations were not related to the PCA-derived cognitive factors, or to the composite cognitive score. Yet, higher 25(OH)D concentrations were significantly related to higher scores on the phonemic fluency test. Among subjects with post-secondary education (n 517), no associations between plasma vitamin D and any of the considered cogni-tive variables were observed.
Sensitivity analyses
Repeating our analyses using multiple imputation instead of attribution of mean/modal values in the case of missing data did not substantially change the present results (data not shown).
Discussion
In this population-based epidemiological study, we investigated the association between midlife plasma 25(OH)D concen-trations and performance in different cognitive domains, assessed 13 years later. Among participants with low education, higher plasma 25(OH)D concentration was associated with higher scores on a PCA-derived cognitive factor linked to
short-term and working memory. This association was largely attributable to performance on the backward digit span, and to a lesser degree to performance on the forward digit span. As the backward digit span is a measure of working memory, it appears that 25(OH)D status was the most strongly associated with the performance of working memory among individuals with low education in our sample.
Among participants with secondary education only, there was no association of plasma vitamin D with any cognitive variable except phonemic fluency, where better outcomes were found in individuals with higher plasma 25(OH)D concentrations. The interpretability of this result is limited, as we aimed to inter-pret the present results hierarchically (with the PCA-derived factors and the composite cognitive score as primary outcomes), in view of the large number of statistical tests performed.
A modelling approach in which we categorised 25(OH)D concentrations confirmed the linear shape of the association among subjects with low education. In order to obtain an indi-cator that may facilitate an interpretation of the magnitude of the effect sizes found in the present study, we calculated mean scores on the ‘short-term and working memory’ – factor for younger (, 60 years) and older ($ 70 years) subjects (data not shown). While younger individuals had a 2·1 points higher mean than older individuals, subjects with a sufficient vitamin D status had, on average, a 5·1 points higher score than severely deficient subjects. This indicates that the effect size observed for the relationship between vitamin D status and short-term/working memory is not negligible.
We attempted to account for potential mediation effects by vascular health(9) and diabetes(39) by running additional models in which we adjusted for incident CVD and history of diabetes and hypertension. Yet, in the present study, adjust-ing for these conditions, yielded relatively similar results, suggesting that the observed effects may be largely due to biological pathways other than vascular disease and diabetes. The effect modification by educational level could be explained by the phenomenon of cognitive reserve. This con-cept has been proposed to explain the observation that the same degree of brain damage or neuropathology can yield apparent manifestations in some subjects, but not in others(42). Higher education has been proposed as a potential modulator of cognitive reserve, improving the ability to cope with neurological damage(42). Thus, it is possible that impair-ments of brain function linked to low plasma vitamin D were only measurable in participants with a lower ability to use neural compensation mechanisms.
In a recent systematic review of epidemiological studies on vitamin D and cognition(8), eighteen out of twenty-five cross-sec-tional studies have found a significant link between lower vitamin D concentrations or intake and worse cognitive perform-ance or a higher prevalence of dementia. Out of six prospective studies, four have found that lower vitamin D concentrations were related to an increased risk of cognitive decline. Since the publication of this review, several other prospective studies investigating the association between 25(OH)D concentrations and cognition have appeared. A significant inverse association between 25(OH)D and cognitive decline during a follow-up of 4·4 years has been observed in a population-based cohort of
Table 2. Factor-loading matrix from principal components analysis (PCA)* ‘Verbal memory’† ‘Short-term and working memory’† RI-48‡ 0·75 20·12 Semantic fluency 0·80 0·17 Phonemic fluency 0·69 0·29
Trail Making Test 0·46 0·52
Forward digit span 0·01 0·84
Backward digit span 0·12 0·85
RI-48, Rappel indice´-48 items (cued recall test-48 items).
* The presented values are loadings of each cognitive test variable on the first and second factor derived by PCA. For this analysis, we considered loadings . 0·6 to indicate strong correlations.
† The first PCA factor (named ‘verbal memory’) accounted for 41·0 % of the var-iance in cognitive test scores; the second PCA factor (named ‘short-term and working memory’) accounted for 21·0 %. A high percentage of explained variance corresponds to a good capacity of a PCA factor to explain the variance– covari-ance structure of the original variables.
British
Journal
of
Nutrition
https://www.cambridge.org/core . IP address: 109.221.210.240 , on 02 Apr 2020 at 10:03:59, subject to the Cambridge Core terms of use, available at
https://www.cambridge.org/core/terms
.
1927 elderly individuals(43). In a further investigation of 5010 subjects aged 40– 79 years at baseline, 25(OH)D concentrations have been inversely associated with the risk of dementia over a 17-year follow-up among women, but not among men(44). In addition, two studies without data on cognitive perfor-mances at baseline have found a positive association between 25(OH)D and cognitive function at follow-up(45,46). In contrast, among 315 very old hospitalised patients, 25(OH)D concen-trations were not predictive of the risk to develop dementia over a period of 2 years(47), and an investigation of data from
1652 individuals initially aged 48– 68 years has found no associ-ation between 25(OH)D and cognitive decline over a follow-up of 3 or 10 years(48). Thus, epidemiological evidence tends to indicate an association between vitamin D status and cognition, but study findings remain inconsistent. This could be partly due to differences in the investigated age ranges, the cognitive tests applied and whether or not baseline measurements of cognitive performance were available.
Studies investigating potential effects of vitamin D sup-plementation on cognition are scarce. A recent review of the literature has counted three randomised controlled trials and two case – control studies in clinical settings, of which none
has identified a beneficial effect of vitamin D supplementation on cognitive outcomes. The review argues that this may be explained by the doses administered (often relatively high) and the generally short study periods(49). As very high vitamin D doses may have detrimental side effects(49), it is possible that low-dose supplementation is more effective than high-dose supplementation. This may be one reason why a non-random-ised pre – post study (that was not included in the above-cited review) did identify an improvement in cognitive outcomes after a 16-month supplementation with low-dose vitamin D3
(800 IU/d; 0.02 mg/d) among elderly outpatients(50). On the other hand, results of simple pre – post studies have an evi-dence level that is largely inferior to that of randomised con-trolled trials.
In order to explore the specific cognitive domains potentially affected by a low vitamin D status, Annweiler et al.(15)published a meta-analysis focusing on episodic memory and executive function. The present results concerning working memory are in agreement with this meta-analysis as all six studies assessing ‘information updating/working memory’ found a link between higher vitamin D concentrations and better working memory performance. The fact that the present study did not identify
Table 3. Linear regression analysis of the association between baseline 25-hydroxyvitamin D plasma concentrations and cognitive outcomes evaluated 13 years later*
(b Coefficients and 95 % confidence intervals, n 1009)
Primary education only (n 230) Secondary education (n 262) Higher education (n 517)
b 95 % CI P b 95 % CI P b 95 % CI P Verbal memory† Model 1‡ 20·03 20·14, 0·09 0·67 0·00 20·11, 0·11 0·99 0·01 20·07, 0·10 0·76 Model 2§ 20·07 20·19, 0·05 0·25 20·01 20·12, 0·11 0·92 0·03 20·06, 0·11 0·54 Short-term/working memory† Model 1 0·13 0·01, 0·24 0·03 0·09 20·02, 0·19 0·11 20·07 20·16, 0·02 0·14 Model 2 0·14 0·03, 0·26 0·02 0·09 20·01, 0·20 0·09 20·06 20·15, 0·03 0·19 Composite scorek Model 1 0·07 20·04, 0·19 0·20 0·05 20·05, 0·16 0·32 20·03 20·11, 0·05 0·46 Model 2 0·05 20·06, 0·17 0·38 0·05 20·05, 0·16 0·33 20·02 20·10, 0·07 0·68 RI-48 Model 1 0·05 20·07, 0·18 0·38 20·05 20·15, 0·06 0·36 0·05 20·04, 0·14 0·28 Model 2 0·01 20·11, 0·14 0·85 20·05 20·16, 0·06 0·34 0·05 20·04, 0·14 0·29 Semantic fluency Model 1 20·01 20·12, 0·10 0·85 20·01 20·12, 0·11 0·92 20·04 20·13, 0·05 0·38 Model 2 20·05 20·16, 0·06 0·38 20·02 20·13, 0·10 0·77 20·02 20·11, 0·07 0·65 Phonemic fluency Model 1 20·03 20·15, 0·08 0·59 0·12 0·01, 0·22 0·03 0·01 20·08, 0·10 0·80 Model 2 20·05 20·17, 0·07 0·40 0·13 0·02, 0·23 0·02 0·01 20·08, 0·10 0·77
Trail Making Test{
Model 1 20·01 20·13, 0·12 0·91 0·01 20·09, 0·11 0·87 20·04 20·12, 0·05 0·37
Model 2 20·01 20·14, 0·12 0·90 0·00 20·10, 0·10 0·96 20·01 20·10, 0·08 0·83
Forward digit span
Model 1 0·12 0·01, 0·24 0·04 0·07 20·04, 0·18 0·24 20·02 20·11, 0·06 0·59
Model 2 0·12 0·00, 0·24 0·05 0·08 20·03, 0·19 0·16 20·02 20·11, 0·07 0·69
Backward digit span
Model 1 0·16 0·04, 0·27 0·008 0·07 20·03, 0·17 0·18 20·08 20·17, 0·02 0·10
Model 2 0·17 0·06, 0·29 0·004 0·07 20·04, 0·17 0·20 20·08 20·18, 0·01 0·09
RI-48, Rappel indice´-48 items (cued recall test-48 items). * Higher scores indicate better performance.
† Factors derived from principal component analysis. The ‘verbal memory’ – factor was strongly correlated with the semantic and phonemic fluency tests and the RI-48; the ‘short-term/working memory’ – factor was strongly correlated with the forward and backward digit span.
‡ Model 1: adjusted for age, sex, follow-up time, season of blood draw.
§ Model 2: additionally adjusted for intervention group, socioprofessional category, family situation, physical activity level, smoking status, alcohol consumption, BMI, self-reported memory troubles at baseline and Center for Epidemiologic Studies-Depression Scale score.
k Mean of all standardised cognitive test scores.
{ Number –letter switching task of the Delis–Kaplan Executive Function System version.
K. E. Assmann et al. 1634
British
Journal
of
Nutrition
Downloaded from https://www.cambridge.org/core . IP address: 109.221.210.240 , on 02 Apr 2020 at 10:03:59, subject to the Cambridge Core terms of use, available at
https://www.cambridge.org/core/terms
.
an association with episodic memory is also in accordance with the meta-analysis, as the effect size found by Annweiler et al.(15) was judged to be too small to draw any conclusion. In contrast to the present study, the meta-analysis identified a positive relationship between 25(OH)D and mental flexibility. Of note, this overall positive relationship was mainly driven by results from two studies whose participants were much older than subjects in our sample.
In the present study, a positive association of 25(OH)D concentrations with age was observed (Table 1). Yet, other studies have suggested that 25(OH)D concentrations decline with age(51,52). In fact, after adjustment for other variables (notably physical activity level), a significant relationship between age and 25(OH)D was no longer present (data not shown). Of note, older participants were much more frequent to have high baseline levels of physical activity than younger participants (data not shown). Moreover, in the studies that found inverse associations between age and 25(OH)D concen-trations, the considered age ranges were much larger than in the present study (in which participants were aged 45 – 60 years at the moment of blood draw).
Some limitations of the present study should be noted. First, there was no cognitive assessment at baseline, preventing us from modelling cognitive decline. It is possible that indi-viduals with low vitamin D status already had worse cognitive performance at baseline, thus leading to an overestimation of the identified association. Yet, adjustment for self-reported memory complaints at baseline, educational level and baseline-socioprofessional category may attenuate potential bias. Further limitations are that no data on vitamin D status at follow-up (2007 – 9) had been collected, and that only a single baseline measurement of 25(OH)D was available for each participant. Yet, a recent study has indicated that, depending on the season of blood draw, a single sample can provide a reasonable average for 25(OH)D over a 1-year period(53). Additionally, we did not dispose of data on dietary supplement use (including vitamin D supplements) after the end of the SU.VI.MAX trial phase. Yet, during the trial phase (1994 – 2002), participants were asked not to consume any dietary supplements, and we were interested in the relation-ship of vitamin D status and cognition, irrespective of vitamin D sources.
Table 4. Association between categories of baseline plasma 25-hydroxyvitamin D and cognitive outcomes evaluated 13 years later in subjects with primary education only*
(Adjusted mean values and 95 % confidence intervals, n 230)
,10 ng/ml $10 and , 20 ng/ml $20 and , 30 ng/ml $30 ng/ml
Mean 95 % CI Mean 95 % CI Mean 95 % CI Mean 95 % CI P†
n 40 92 60 38 Verbal memory‡ Model 1§ 48·3 45·2, 51·5 47·5 45·3, 49·7 45·2 42·7, 47·7 47·3 44·1, 50·4 0·43 Model 2k 49·7 45·7, 53·8 47·8 44·3, 51·3 45·7 42·1, 49·2 46·2 41·8, 50·6 0·08 Short-term/working memory‡ Model 1 42·8 39·7, 45·8 45·9 43·7, 48·0 47·9 45·5, 50·4 47·7 44·7, 50·8 0·01 Model 2 46·2 42·4, 50·1 49·1 45·8, 52·4 50·5 47·1, 53·9 51·3 47·1, 55·5 0·02 Composite score{ Model 1 43·8 40·7, 47·0 45·5 43·4, 47·7 45·3 42·8, 47·8 46·7 43·6, 49·8 0·23 Model 2 47·2 43·3, 51·0 47·9 44·6, 51·2 47·3 43·9, 50·7 48·2 44·0, 52·4 0·73 RI-48 Model 1 48·4 45·0, 51·7 49·6 47·3, 51·9 48·2 45·5, 50·8 50·5 47·2, 53·8 0·50 Model 2 49·2 44·9, 53·4 49·6 46·0, 53·3 48·3 44·6, 52·0 48·9 44·3, 53·5 0·77 Semantic fluency Model 1 48·1 45·2, 51·0 46·7 44·7, 48·7 46·9 44·6, 49·3 47·2 44·3, 50·1 0·68 Model 2 49·0 45·3, 52·8 46·2 43·0, 49·4 47·0 43·7, 50·2 45·8 41·7, 49·8 0·18 Phonemic fluency Model 1 47·3 44·2, 50·4 47·0 44·8, 49·1 43·7 41·2, 46·2 46·6 43·5, 49·7 0·44 Model 2 48·6 44·6, 52·6 47·9 44·4, 51·4 44·1 40·6, 47·6 47·2 42·8, 51·5 0·26
Trail Making Test**
Model 1 45·7 42·3, 49·1 46·6 44·2, 49·0 45·9 43·2, 48·6 45·1 41·7, 48·5 0·75
Model 2 50·4 46·0, 54·7 50·6 46·9, 54·3 49·7 45·9, 53·5 48·8 44·0, 53·5 0·46
Forward digit span
Model 1 44·6 41·4, 47·8 47·6 45·4, 49·8 49·3 46·8, 51·9 48·8 45·6, 52·0 0·05
Model 2 46·4 42·4, 50·4 49·7 46·2, 53·1 50·3 46·8, 53·9 50·5 46·1, 54·9 0·08
Backward digit span
Model 1 42·3 39·2, 45·5 45·5 43·3, 47·7 47·9 45·4, 50·4 49·2 46·1, 52·3 0·001
Model 2 45·6 41·7, 49·6 47·9 44·5, 51·3 50·2 46·8, 53·7 52·1 47·8, 56·3 0·003
RI-48, Rappel indice´-48 items (cued recall test-48 items). * Higher scores indicate better performance.
† Linear contrast test.
‡ Factors derived from principal component analysis. The ‘verbal memory’ – factor was strongly correlated with the semantic and phonemic fluency tests and the RI-48; the ‘short-term/working memory’ – factor was strongly correlated with the forward and backward digit span.
§ Model 1: adjusted for age, sex, follow-up time, season of blood draw.
k Model 2: additionally adjusted for intervention group, socioprofessional category, family situation, physical activity level, smoking status, alcohol consumption, BMI, self-reported memory troubles at baseline and Center for Epidemiologic Studies-Depression Scale score.
{ Mean of all standardised cognitive test scores.
** Number– letter switching task of the Delis – Kaplan Executive Function System version.
British
Journal
of
Nutrition
https://www.cambridge.org/core . IP address: 109.221.210.240 , on 02 Apr 2020 at 10:03:59, subject to the Cambridge Core terms of use, available at
https://www.cambridge.org/core/terms
.
Next, the stratification of our analyses by educational level implies a reduction in statistical power, which may explain why we did not find a significant association of plasma vitamin D with the forward digit span among subjects with low education. Furthermore, residual confounding cannot be excluded even though it is likely minimised due to exten-sive adjustment for potential confounders. Finally, the external validity of the present results may be limited as the SU.VI.MAX cohort is a selected sample of compliant volunteers(19).
Strengths of the study include its longitudinal design, and the assessment of plasma vitamin D status in a middle-aged population. Additionally, we used a neuropsychological battery including validated cognitive tests designed to limit floor and ceiling effects. Moreover, in contrast to many other studies on vitamin D and cognition, the use of a large number of different cognitive tests permitted us to report specific results on different cognitive domains.
In conclusion, the present study confirms previous findings from epidemiological studies that support a link between higher vitamin D concentrations and better cognitive outcomes. However, the present results were restricted to individuals with a low educational level, which could be explained by the phenomenon of cognitive reserve. Future prospective studies and randomised controlled trials are necessary to clarify the role that an improved vitamin D status could have in the prevention of cognitive impairment and dementia.
Supplementary material
To view supplementary material for this article, please visit http://dx.doi.org/10.1017/S0007114515001051
Acknowledgements
The authors thank Ste´phane Raffard, who was responsible for standardisation of the cognitive evaluation; Fre´de´rique Ferrat, who coordinated with the logistic aspects of the neuropsy-chological evaluation; Nathalie Charnaux and Angela Sutton, who were responsible for the vitamin D measurements; and Gwenae¨l Monot, Paul Flanzy, and Mohand Ait Oufella (compu-ter scientists); Nathalie Arnault, Laurent Bourhis, and Stephen Besseau (statisticians); and Rachida Mehroug (logistics assistant) for their technical contribution to the SU.VI.MAX Study.
The present study was funded by the French National Research Agency (no. ANR-05-PNRA-010), the French Ministry of Health, Me´de´ric, Sodexo, Ipsen, MGEN and Pierre Fabre. Me´de´ric and MGEN are French health insurance organisations, which are complementary to the National Health Insurance System. Ipsen and Pierre Fabre are private pharmaceutical companies. Sodexo, a food catering company, supported the study by organising meetings between researchers and study participants. Moreover, the realisation of plasma vitamin D measurements was supported by a grant from the French Research Institute for Public Health (IRESP Grant AAR201206). K. E. A. was supported by a doctoral fellowship from Ecole Doctorale Galile´e, University of Paris 13, Sorbonne Paris Cite´, and M. D. was supported by a PhD grant from the Cance´ropoˆle Ile-de-France (public funding from the Paris region). None of the funding bodies had
any involvement in the design/conduct of the present study, in data analysis/interpretation or in the writing/approval of the manuscript.
M. T., V. A. A., T. C., S. H., P. G. and E. K.-G. report no disclosures.
None of the authors reports any conflict of interest. The authors’ contributions are as follows: P. G., S. H., E. K.-G. and M. T. designed the study; K. E. A. performed the statistical analysis and wrote the paper; K. E. A. and E. K.-G. had primary responsibility for the final content; E. K.-G. and M. T. provided methodological guidance; K. E. A.,V. A. A., M. T., M. D., T. C., S. H., P. G. and E. K.-G. were involved in interpreting the results and editing the manuscript for important intellectual content. All authors read and approved the final version of the manuscript.
References
1. Hossein-nezhad A & Holick MF (2013) Vitamin D for health: a global perspective. Mayo Clin Proc 88, 720 – 755. 2. Perez-Lopez FR, Chedraui P & Fernandez-Alonso AM (2011)
Vitamin D and aging: beyond calcium and bone metabolism. Maturitas 69, 27 – 36.
3. Gallagher JC & Sai AJ (2010) Vitamin D insufficiency, deficiency, and bone health. J Clin Endocrinol Metab 95, 2630 – 2633.
4. Ginde AA, Liu MC & Camargo CA Jr (2009) Demographic differences and trends of vitamin D insufficiency in the US population, 1988 – 2004. Arch Intern Med 169, 626 – 632. 5. Vernay M, Sponga M, Salanave B, et al. (2012) Statut en vitamine D
de la population adulte en France: l’E´tude nationale nutrition sante´ (ENNS, 2006–2007) (Vitamin D status in the French adult population: the French Nutrition and Health Survey (ENNS, 2006–2007)). Bull Epidemiol Hebd (Paris) 16–17, 189–194. 6. Grange D, Castetbon K & Guibert G, et al. (2013) Alimentation
et e´tat nutritionnel des be´ne´ficiaires de l’aide alimentaire – Etude Abena 2011 – 2012 et e´volutions depuis 2004 – 2005. Observatoire re´gional de sante´ (ORS) Iˆle-de-France; Unite´ de surveillance et d’e´pide´miologie nutritionnelle (Institut de veille sanitaire (INVS) – Universite´ Paris 13); Institut national de pre´vention et d’e´ducation pour la sante´ (INPES). http:// www.inpes.sante.fr/etudes/pdf/2013-abena2-rapport.pdf (accessed February 2015).
7. Barnard K & Colon-Emeric C (2010) Extraskeletal effects of vitamin D in older adults: cardiovascular disease, mortality, mood, and cognition. Am J Geriatr Pharmacother 8, 4 – 33. 8. van der Schaft J, Koek HL, Dijkstra E, et al. (2013) The
association between vitamin D and cognition: a systematic review. Ageing Res Rev 12, 1013 – 1023.
9. Buell JS, Dawson-Hughes B, Scott TM, et al. (2010) 25-Hydro-xyvitamin D, dementia, and cerebrovascular pathology in elders receiving home services. Neurology 74, 18 – 26. 10. Eyles DW, Feron F, Cui X, et al. (2009) Developmental
vitamin D deficiency causes abnormal brain development. Psychoneuroendocrinology 34, Suppl. 1, S247 – S257. 11. Brewer LD, Thibault V, Chen KC, et al. (2001) Vitamin D
hormone confers neuroprotection in parallel with down-regulation of L-type calcium channel expression in hippocampal neurons. J Neurosci 21, 98 – 108.
12. Neveu I, Naveilhan P, Baudet C, et al. (1994) 1,25-Dihydroxyvitamin D3 regulates NT-3, NT-4 but not BDNF
mRNA in astrocytes. Neuroreport 6, 124 – 126.
13. de la Torre JC (2010) Alzheimer’s disease is incurable but preventable. J Alzheimers Dis 20, 861 – 870.
K. E. Assmann et al. 1636
British
Journal
of
Nutrition
Downloaded from https://www.cambridge.org/core . IP address: 109.221.210.240 , on 02 Apr 2020 at 10:03:59, subject to the Cambridge Core terms of use, available at
https://www.cambridge.org/core/terms
.
14. Amieva H, Le Goff M, Millet X, et al. (2008) Prodromal Alzheimer’s disease: successive emergence of the clinical symptoms. Ann Neurol 64, 492 – 498.
15. Annweiler C, Montero-Odasso M, Llewellyn DJ, et al. (2013) Meta-analysis of memory and executive dysfunctions in relation to vitamin D. J Alzheimers Dis 37, 147 – 171. 16. Annweiler C, Llewellyn DJ & Beauchet O (2013) Low serum
vitamin D concentrations in Alzheimer’s disease: a systematic review and meta-analysis. J Alzheimers Dis 33, 659 – 674. 17. Balion C, Griffith LE, Strifler L, et al. (2012) Vitamin D,
cognition, and dementia: a systematic review and meta-analysis. Neurology 79, 1397 – 1405.
18. Etgen T, Sander D, Bickel H, et al. (2012) Vitamin D deficiency, cognitive impairment and dementia: a systematic review and meta-analysis. Dement Geriatr Cogn Disord 33, 297 – 305. 19. Hercberg S, Galan P, Preziosi P, et al. (2004) The SU.VI.MAX
Study: a randomized, placebo-controlled trial of the health effects of antioxidant vitamins and minerals. Arch Intern Med 164, 2335 – 2342.
20. Kesse-Guyot E, Fezeu L, Jeandel C, et al. (2011) French adults’ cognitive performance after daily supplementation with anti-oxidant vitamins and minerals at nutritional doses: a post hoc analysis of the Supplementation in Vitamins and Mineral Anti-oxidants (SU.VI.MAX) trial. Am J Clin Nutr 94, 892–899. 21. Knudsen CS, Nexo E, Hojskov CS, et al. (2012) Analytical
validation of the Roche 25-OH Vitamin D Total assay. Clin Chem Lab Med 50, 1965 – 1968.
22. Touvier M, Deschasaux M, Montourcy M, et al. (2014) Interpretation of plasma PTH concentrations according to 25OHD status, gender, age, weight status, and calcium intake: importance of the reference values. J Clin Endocrinol Metab 99, 1196 – 1203.
23. Adam S, Van der Linden M, Poitrenaud J, et al. (2004) L’e´preuve de rappel indice´ a` 48 items (RI-48) (The 48-item cued recall test (RI-48)). In L’e´valuation des troubles de la me´moire: pre´sentation de quatre tests de me´moire e´pisodique avec leur e´talonnage (Evaluation of Memory Troubles: Presentation of Four Episodic Memory Tests with Reference Values), pp. 49– 67 [M Van der Linden, editor]. Solal: Marseille. 24. Lezak MD, Howieson DB & Loring DW (2004)
Neuro-psychological Assessment. New York: Oxford University Press. 25. Cardebat D, Doyon B, Puel M, et al. (1990) [Formal and semantic lexical evocation in normal subjects. Performance and dynamics of production as a function of sex, age and educational level]. Acta Neurol Belg 90, 207 – 217.
26. Cardebat D, De´monet JF, Viallard G, et al. (1996) Brain functional profiles in formal and semantic fluency tasks: a SPECT study in normals. Brain Lang 52, 305 – 313. 27. Wechsler D (1981) Wechsler Adult Intelligence Scale-Revised.
New York: Psychological Corporation.
28. Wechsler D (2001) Wechsler Adult Intelligence Scale – Third Edition: Canadian Technical Manual. Toronto, ON: Harcourt Canada.
29. Lecerf T (2012) [Scores composites CHC pour la WAIS-IV: normes francophones]. Prat Psychol 18, 401–412.
30. Delis DC, Kaplan E & Kramer JH (2001) Delis– Kaplan Executive Function System: Examiner’s Manual. San Antonio, TX: The Psychological Corporation.
31. Amieva H, Le Goff M, Stoykova R, et al. (2009) Trail Making Test A et B (version sans correction des erreurs): normes en population chez des sujets aˆge´s, issues de l’e´tude des Trois Cite´s (Trail Making Test A and B (version without correction of errors): population norms for elderly subjects from the Trois Cite´s study). Rev Neuropsychol 1, 210 – 220.
32. Ferreira S, Vanholsbeeck G, Chopard G, et al. (2010) [Comparative norms of RAPID neuropsychological battery
tests for subjects aged between 50 and 89 years]. Rev Neurol (Paris) 166, 606 – 614.
33. Joliffe IT & Morgan BJ (1992) Principal component analysis and exploratory factor analysis. Stat Methods Med Res 1, 69–95. 34. Kline RB (2005) Principles and Practice of Structural
Equation Modeling, 2nd ed. New York: Guilford.
35. Lasfargues G, Vol S, Le Clesiau H, et al. (1990) [Validity of a short self-administered dietary questionnaire compared with a dietetic interview]. Presse Med 19, 953 – 957.
36. Astner S & Anderson RR (2004) Skin phototypes 2003. J Invest Dermatol 122, xxx – xxxi.
37. Kesse-Guyot E, Amieva H, Castetbon K, et al. (2011) Adherence to nutritional recommendations and subsequent cognitive performance: findings from the prospective Supplementation with Antioxidant Vitamins and Minerals 2 (SU.VI.MAX 2) study. Am J Clin Nutr 93, 200 – 210. 38. Radloff LS (1977) The CES-D scale. A self-report depression
scale for research in the general population. Appl Psych Meas 1, 385 – 401.
39. Song Y, Wang L, Pittas AG, et al. (2013) Blood 25-hydroxy vitamin D levels and incident type 2 diabetes: a meta-anal-ysis of prospective studies. Diabetes Care 36, 1422 – 1428. 40. Luchsinger JA (2012) Type 2 diabetes and cognitive
impair-ment: linking mechanisms. J Alzheimers Dis 30, Suppl. 2, S185 – S198.
41. Greenland S (1983) Tests for interaction in epidemiologic studies: a review and a study of power. Stat Med 2, 243 – 251. 42. Stern Y (2009) Cognitive reserve. Neuropsychologia 47,
2015 – 2028.
43. Toffanello ED, Coin A, Perissinotto E, et al. (2014) Vitamin D deficiency predicts cognitive decline in older men and women: The Pro.V.A. Study. Neurology 83, 2292 – 2298. 44. Knekt P, Sa¨a¨ksja¨rvi K, Ja¨rvinen R, et al. (2014) Serum
25-hydroxyvitamin d concentration and risk of dementia. Epidemiology 25, 799 – 804.
45. Bartali B, Devore E, Grodstein F, et al. (2014) Plasma vitamin D levels and cognitive function in aging women: the Nurses’ Health Study. J Nutr Health Aging 18, 400 – 406. 46. Wilson VK, Houston DK, Kilpatrick L, et al. (2014) Relation-ship between 25-hydroxyvitamin D and cognitive function in older adults: the Health, Aging and Body Composition Study. J Am Geriatr Soc 62, 636 – 641.
47. Graf CE, Rossi C, Giannelli SV, et al. (2014) Vitamin D is not associated with cognitive status in a cohort of very old hospitalized patients. J Alzheimers Dis 42, Suppl. 3, S53 – S61. 48. Schneider AL, Lutsey PL, Alonso A, et al. (2014) Vitamin D and cognitive function and dementia risk in a biracial cohort: the ARIC Brain MRI Study. Eur J Neurol 21, 1211–1218, e1269-1270. 49. Anastasiou CA, Yannakoulia M & Scarmeas N (2014) Vitamin D and cognition: an update of the current evidence. J Alzheimers Dis 42, Suppl. 3, S71 – S80.
50. Annweiler C, Fantino B, Gautier J, et al. (2012) Cognitive effects of vitamin D supplementation in older outpatients visiting a memory clinic: a pre – post study. J Am Geriatr Soc 60, 793 – 795.
51. Baker MR, Peacock M & Nordin BE (1980) The decline in vitamin D status with age. Age Ageing 9, 249 – 252. 52. Daly RM, Gagnon C, Lu ZX, et al. (2012) Prevalence of
vita-min D deficiency and its detervita-minants in Australian adults aged 25 years and older: a national, population-based study. Clin Endocrinol (Oxf) 77, 26 – 35.
53. Major JM, Graubard BI, Dodd KW, et al. (2013) Variability and reproducibility of circulating vitamin D in a nationwide U.S. population. J Clin Endocrinol Metab 98, 97 – 104.
British
Journal
of
Nutrition
https://www.cambridge.org/core . IP address: 109.221.210.240 , on 02 Apr 2020 at 10:03:59, subject to the Cambridge Core terms of use, available at
https://www.cambridge.org/core/terms
.