HAL Id: tel-01291500
https://tel.archives-ouvertes.fr/tel-01291500
Submitted on 21 Mar 2016HAL is a multi-disciplinary open access
archive for the deposit and dissemination of sci-entific research documents, whether they are pub-lished or not. The documents may come from teaching and research institutions in France or abroad, or from public or private research centers.
L’archive ouverte pluridisciplinaire HAL, est destinée au dépôt et à la diffusion de documents scientifiques de niveau recherche, publiés ou non, émanant des établissements d’enseignement et de recherche français ou étrangers, des laboratoires publics ou privés.
Low-mass stars as tracers of the milky way populations :
investigating the effects of metallicity in cool atmosphere
Arvind Singh Rajpurohit
To cite this version:
Arvind Singh Rajpurohit. Low-mass stars as tracers of the milky way populations : investigating the effects of metallicity in cool atmosphere. Astrophysics [astro-ph]. Université de Franche-Comté, 2013. English. �NNT : 2013BESA2023�. �tel-01291500�
Université de Franche-Comté
École Doctorale Carnot-Pasteur
(ED CP n◦ 554)
PhD Thesis
Specialization: Astrophysics
presented by
RAJPUROHIT Arvind Singh
Low-mass stars as tracers of Milky
Way populations : investigating the
effect of metallicity in cool
atmospheres
Directed by Céline Reylé and Co-directed by Mathias Schultheis
Jury :
Président : France Allard Rapporteurs : France, Allard Rob Jeffries Examinateurs : Xavier Bonfils Alejandra Recio-Blanco Céline Reylé Mathias Schultheis
3
Acknowledgements
First and foremost, I would like to thank to my PhD supervisor Dr. Céline Reylé and co-supervisor Dr. Mathias Schultheis, for supporting me during these past three years. Céline is someone you will never forget once you meet her. She is the funniest, cool and calm advisor. I hope that I could be as lively, enthusiastic, and energetic as Céline. It has been an honor to be her first Ph.D student. Both Céline and Mathias has taught me, consciously and unconsciously, how good astronomy and astrophysics is done. I appreciate all their contributions of time, ideas, and funding to make my Ph.D experience productive and stimulating. The joy and enthusiasm both Céline and Mathias has for their research was contagious and motivational for me, even during tough times in the Ph.D pursuit. I am also thankful for the excellent example Céline has provided as a successful woman astrophysicist.
Besides my advisors I would like to thank prof. France Allard. This thesis would not have been possible without the advice and encouragement of Prof. Allard. She taught me how to be a scientist, from proposals to observations to publications. She was always encouraging, understanding, and, perhaps most importantly, available for discussions. She is my primary resource for getting my science questions answered. I would also like to thank Dr. John P Killingbeck for reading this thesis and helping me in english corrections.
A good support staff is important to surviving and staying sane during PhD. I would like to thank all the members of the Observatoire de Besancon in particular Annie, F. Gazelle, Kevin, Sékou, Martin, Edith, and Andre which has contributed immensely to my personal and profes-sional time at Besancon. The group has been a source of friendships as well as good advice. In addition, I would like to thank Derek Homeier, ENS Lyon, who provided me the model atmo-sphere as a first priority. I am also grateful to Prof. Ch. Leinert for providing me the data for LHS1070 triple system. Finally, I must thank the person who meant the most to me these past three years. Ashok Verma’s friendship, love, and support have meant so much to me. I hope that I can be as helpful as he finishes his own dissertation.
Lastly, I would like to thank my family for all their love and encouragement. For my parents who raised me with a love of science and supported me in all my pursuits. I would also like to thank my sisters Kamlesh and Sangeeta for their love and support have made everything possible.
5
Abstract
Very Low-Mass stars (M dwarfs) are an important source of information for probing the low mass end of the main sequence, down to the hydrogen burning limit. They are the dominant stellar component of the Galaxy and make up the majority of baryonic matter in the Galaxy. Moreover, an increasing number of M dwarfs are now known to host exoplanets, including super-Earth exoplanets. The determination of accurate fundamental parameters for M dwarfs has therefore relevant implications for both stellar and Galactic astronomy as well as plane-tology. Despite their large number in the Galaxy, M dwarfs remain elusive objects and the modelling of their photosphere has long remained a challenge (molecular opacities, dust cloud formation). The description of these stars therefore need a strong empirical basis, or validation. In particular, the effect of metallicity on the physics of cool atmospheres are still poorly known, even for early-type M-dwarfs.
The goal of this thesis is to determine the fundamental stellar parameters of these low-mass dwarfs (M dwarfs) and to test recent model atmospheres. In particular this works aims to validate the BT-Settl model atmospheres, to understand the onset of dust formation in cool stellar atmospheres and to update the current knowledge about the relationship between spectral type and effective temperature (Teff) of M dwarfs.
The first part of this study sets out to improve the understanding of onset of the dust forma-tion in cool stellar atmospheres. We perform a χ2 minimization by comparing well calibrated
optical and infrared (IR) spectra with recent cool star model synthetic spectra, leading to the determination of the physical stellar parameters Teff, radius and log g for each of the
compo-nent of the triple sysytem LHS 1070 (Rajpurohit et al. 2012b,a). This study is then extended by validating BT-Settl model atmospheres, updating the M-dwarf Teff - spectral type relation, and
finding the atmospheric parameters of a sample of M-dwarfs. We also present the relationship between effective temperature, spectral type and colours for the M-dwarfs (Rajpurohit et al. 2013).
The second part of this study deals with the analysis of high resolution spectroscopy for M subdwarfs. This study shows that the observational and modelling efforts are required to fully understand the physics in the cool subdwarf atmosphere and to investigate the effect of metallicity in particular for the lower metallicity. This study presents the UVES/VLT high resolution spectra of 21 M subdwarfs. Our atlas covers the optical region from 6400 Å up to the near infrared at 8900 Å. We show spectral details of cool atmospheres at very high resolution (R∽ 40 000) and compare the observed with synthetic spectra computed from the recent BT-Settl atmosphere models, to disentangle their stellar parameters and to determine their precise metallicity.
This work should initiate further research: in particular we want to verify that the near-IR spectral energy distribution will yield results that are consistent with the optical. The
exten-6 Abstract sion of this study to the near-IR will generate the first complete atlas of overall M-dwarfs and subdwarfs spectra for which parameters (Teff, log g and Fe/H) have been determined from this
7
Contents
1. Motivation 1
2. The Basics Properties of M-dwarfs 5
2.1. Introduction to M-dwarfs . . . 5
2.2. A Survey of the Properties of M-dwarfs . . . 6
2.2.1. Physical properties . . . 7
2.2.2. Photometric Properties . . . 7
2.2.3. Spectroscopic properties . . . 8
2.3. Stellar Parameters of M-dwarfs . . . 12
2.3.1. Effective Temperature . . . 12
2.3.2. Gravity . . . 16
2.3.3. Metallicity . . . 17
2.4. M-subdwarfs . . . 18
3. A Model Atmosphere For Low Mass Stars 23 3.1. Introduction . . . 23
3.2. Historical Overview . . . 24
3.3. Model Construction . . . 26
3.4. Molecular Opacities in M dwarfs . . . 28
3.5. Convective energy transport . . . 30
3.6. Dust Grain and Atmospheric composition in M dwarfs . . . 32
3.7. Current Model Atmospheres for Low Mass stars . . . 34
3.7.1. BT-Dusty and BT-Settl . . . 35
3.7.2. MARCS . . . 37
3.7.3. DRIFT . . . 37
4. The very low mass multiple system LHS 1070. A testbed for model atmospheres for the lower end of the main sequence 39 4.1. Introduction . . . 39
4.2. Observations and data reduction . . . 40
4.2.1. Photometry . . . 40
4.2.2. Spectroscopic observations . . . 41
4.2.3. Spectroscopic features . . . 42
4.3. Physical Parameters Determination . . . 46
8 Table of contents
4.3.2. Spectral Type . . . 51
4.3.3. Metallicity . . . 51
4.3.4. Gravity . . . 51
4.3.5. Effective Temperature and Radius . . . 53
4.3.6. Age and mass . . . 54
4.4. Results . . . 57
4.5. Discussion and Conclusion . . . 62
5. The effective temperature scale of M dwarfs 67 5.1. Introduction . . . 67
5.2. Observations . . . 68
5.3. Model atmospheres . . . 69
5.4. Teffdetermination . . . 69
5.5. Comparison between models and observations . . . 72
5.5.1. Spectroscopic confrontation . . . 72
5.5.2. Photometric confrontation . . . 74
5.5.3. The Teffscale of M dwarfs . . . 77
5.6. Conclusion . . . 79
6. High resolution spectroscopy of M subdwarfs: Effective temperature and metallic-ity 91 6.1. Introduction . . . 91
6.2. A high resolution spectral atlas of M subdwarfs . . . 92
6.2.1. Observation and data reduction . . . 93
6.2.2. Molecular features . . . 93
6.2.3. Atomic lines . . . 93
6.3. Model atmospheres . . . 100
6.4. Comparison with model atmospheres . . . 102
6.4.1. Molecular bands . . . 102
6.4.2. Atomic lines . . . 103
6.4.3. Stellar parameters determination . . . 104
6.5. Discussion . . . 106
6.6. Conclusion . . . 107 7. Conclusion and future perspectives 115
Publications 117
9
List of Figures
2.1. Loci of cool stars classified as M dwarfs, subdwarfs (sdM), extreme subdwarfs (esdM) and ultrasubdwarfs (usdM) in the SDSS g-r/r-i colour-colour space by Lépine (2009). . . 9 2.2. The optical to red SED of M-dwarfs from M0 to M8, observed at Siding Spring
Observatory (SSO) at a spectral resolution of 1.4 Å. The atomic and molec-ular features are clearly visible. The chromospheric emission fills the Na I D transition for the latest-type M-dwarfs displayed here, while M8 has a flatter spectrum because of dust scattering. . . 10 2.3. z-band spectra sequence of M-dwarfs (Cushing et al. 2005). The most
promi-nent molecular and atomic features are indicated. . . 12 2.4. J-band spectra sequence of M-dwarfs (Cushing et al. 2005). The most
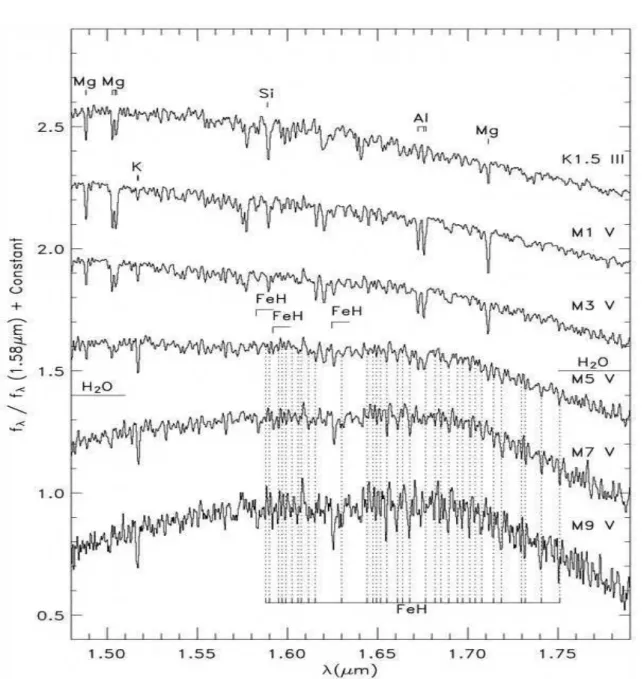
promi-nent molecular and atomic features are indicated. . . 13 2.5. H-band spectra sequence of M-dwarfs (Cushing et al. 2005). The most
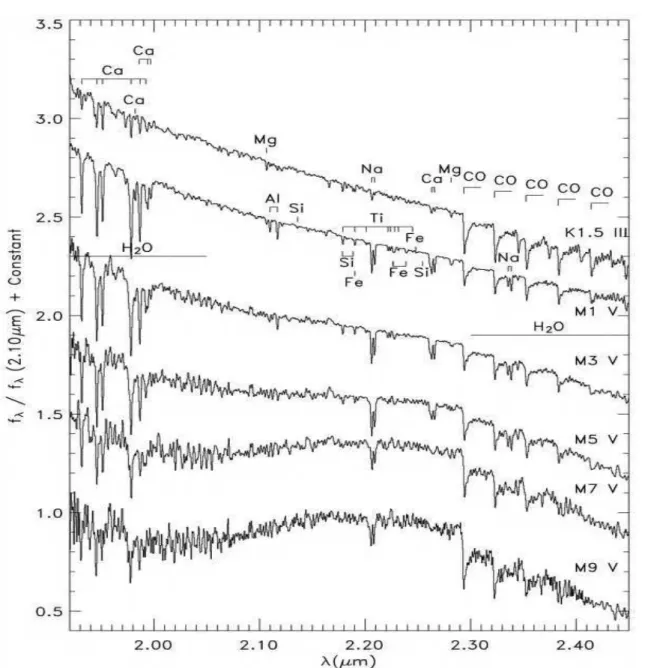
promi-nent molecular and atomic features are indicated. . . 14 2.6. K-band spectra sequence of M-dwarfs (Cushing et al. 2005). The most
promi-nent molecular and atomic features are indicated. . . 15 2.7. BT-Settl models for an effective temperature of 3500 K and varying log g = 4.5
(black), 5.0 (blue), 5.5 (red). The effect of gravity and the pressure broadening of the Na I doublet is clearly visible. . . 17 2.8. Synthetic spectra for stars having Teff = 3500 K and log g = 5.0 (Jao et al.
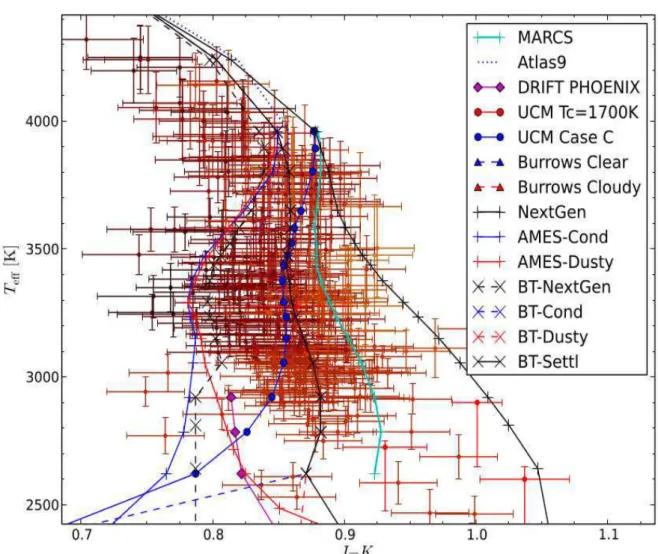
2008). The red, green, and blue lines represent different metallicities, 0.0, -2.0, and -4.0. Note that the relative amounts of blue and red fluxes tend toward bluer objects at lower metallicities. . . 20 3.1. Fig. 1 of the review article by Allard et al. (2012a). The near-infrared SED
of VB10 is compared with the synthetic spectra (Teff = 2800 K, log g = 5.0, [M/H] = 0.0) from diverse model grids published through the years. All models (except the NextGen / UCL case) underestimate the flux in the K bandpass by 0.1 to 0.2 dex . . . 30 3.2. Fig. 2 of the article by Allard et al. (2013). Estimated Teff and metallicity
for M dwarfs by Casagrande et al. (2008) on the left, and brown dwarfs by Golimowski et al. (2004) and Vrba et al. (2004) on the right are compared to the NextGen isochrones for 5 Gyrs Baraffe et al. (1998a) using model atmosphere of various co-authors (see Allard et al. 2012a, 2013, for more detail) . . . 34
10 List of Figures 3.3. Fig. 3 of the article by Allard et al. (2013). This is the same as Fig. 2 but
extends into the brown dwarf regime for an age of 3 Gyrs. The region below 2900 K is dominated by dust formation (see Allard et al. 2012a, 2013, for more details) . . . 35 4.1. Comparison between NICMOS and NACO spectra of three different components. 43 4.2. Optical Spectra of all the components of LHS 1070 system obtained with the
Faint Object Spectrograph (FOS) on HST. The atomic and molecular features visible in all three components are shown in the upper panel. . . 44 4.3. Near-IR spectra (solid line) and photometry (solid circles) obtained with
NIC-MOS on HST for components A (upper), B (middle), and C (bottom). . . 45 4.4. The ISOPHOT thermal infrared spectra of the unresolved system. . . 46 4.5. VLT (NACO) spectra of all the component in J band with atomic and molecular
lines indicated. . . 47 4.6. VLT (NACO) spectra of all the component in H band with atomic and molecular
lines indicated. . . 48 4.7. VLT (NACO) spectra of all the component in K band with atomic and molecular
lines indicated. . . 49 4.8. The VO band observed in the component A (red ) are compared to the BT-Settl
model at 2900 K, log g= 5.5, R⊙=0.134 at different metallicity (different colors) 52 4.9. BT-Settl and BT-Dusty models for an effective temperature of 2900 K and
vary-ing log g. The effect of gravity and the pressure broadenvary-ing of the KI doublet is clearly visible. The details of the dust treatment only cause negligible differ-ences at this Teff . . . 52
4.10. K I doublet as observed for the primary (black) compared to the BT-Dusty (red), BT-Settl (green), DRIFT (blue), and MARCS (brown) models with log g = 5.0. 53 4.11. CaH molecular band as observed for the primary (black) compared to the
BT-Settl model at 2900 K, log g= 5.0 (red) and log g=5.5 (green), R⊙ = 0.134 at solar metallicity. . . 54 4.12. Top: χ2 map computed for component A using the optical spectrum and the
BT-Settl model. All values inside the white contour also give an acceptable fit (checked by eye). Bottom: same using the IR spectrum. We consider both χ2
maps to define the best model that satisfies both optical and IR observations: Teff=2900 K and r = 0.134 R⊙. . . 55
4.13. Optical spectra of all three components. Black: observed spectra. Green: best fit BT-Settl model. Blue: best fit DRIFT model. Brown: best fit MARCS model. The parameters that give the best fit are given in Table 4.2 . . . 56 4.14. Same as Fig. 4.13 in the IR. . . 57 4.15. Black: J band NACO spectra of all three components. Comparison with model
predictions. Green: best fit BT-Settl model. Red: best fit BT-Dusty model. Blue: best fit DRIFT model. Brown: best fit MARCS model . . . 58 4.16. Same as fig 4.15 for H band . . . 59 4.17. Same as fig 4.15 for K band . . . 59 4.18. The comparison of the BT-Dusty (red) and BT-Settl (green) models together
List of Figures 11
4.19. Same as fig 4.18 for H band . . . 60
4.20. Same as fig 4.18 for K band . . . 61
4.21. Black: ISOPHOT thermal IR spectra of the unresolved system, with photomet-ric measurements over plotted (stars). Red: best fit BT-Dusty model. Green: best fit BT-Settl model. Blue: best fit DRIFT model. . . 62
5.1. Teffvs NIR colours for observed M dwarfs (open and filled circle) compared to the values obtained with the 5 Gyrs isochrones from Baraffe et al. (1998b) at various metallicities. . . 70
5.2. colour-colour plot for observed M dwarfs (open and filled circle) compared to the values obtained with the 5 Gyrs isochrones from Baraffe et al. (1998b) at various metallicities. . . 71
5.3. Optical to red SED of M dwarfs from M0 to M9.5 observed with the NTT at a spectral resolution of 10.4 Å compared to the best fit BT-Settl synthetic spectra (red lines). The models displayed have a surface gravity of log g = 5.0 to 5.5. Telluric features near 7600 Å were ignored from the chi-square minimization. . 73
5.4. Optical to red SED of M dwarfs from M1 to M8 observed with the SSO 2.3 m at a spectral resolution of 1.4 Å compared to the best fitting (chi-square minimiza-tion) BT-Settl synthetic spectra (red lines). The models displayed have a surface gravity of log g=5.0 to 5.5. At blue wavelengths (< 5000Å) the instrumental noise dominates the late-type M dwarfs. . . 74
5.5. Optical and NIR colours obtained with the 5 Gyrs isochrones from Baraffe et al. (1998b) at solar metallicity compared with the two observation samples (filled circles for the NTT sample and open circle for the SSO 2.3 m spectra). Typical error bars are comparable or smaller than the size of the symbols. . . 75
5.5. Continued. . . 76
5.6. Spectral type - Teffrelation obtained with the NTT sample (filled circles) and the SSO 2.3 m sample (open circles) compared to relations by Bessell (1991), Gizis (1997), Leggett et al. (1996), Leggett et al. (2000), Testi (2009), Boyajian et al. (2012) and Luhman (1999). . . 77
5.7. coloured Teffplots in different bands from the NTT sample (filled circles) and the SSO 2.3 m sample (open circles). Spectral types are also indicated. The predictions from BT-Settl (solid line), NextGen (dotted line), and AMES-Dusty (dash-dotted) for solar metallicities are over plotted. Theoretical masses in solar mass are indicated. Predictions from other authors are shown for comparison when available. . . 80
5.7. Continued. . . 81
5.7. Continued. . . 82
5.7. Continued. . . 89
5.7. Continued. . . 90
6.1. UVES spectra over the sdM spectral sequence.The spectra are scaled to normal-ize the average flux to unity. The spectrum of the standard star EG 21 shows the location of telluric atmospheric features. . . 94
12 Table of figures
6.1. Continued. . . 96
6.2. Same as Fig. 6.1 for esdM and usdM stars. . . 97
6.2. Continued. . . 98
6.2. Continued. . . 99
6.3. BT-Settl synthetic spectra from 4000 K to 3000 K. The black, red, and blue lines represent [Fe/H] = 0.0, -1.0, and -2.0, respectively. . . 101
6.4. UVES spectra of the sdM1 star LHS 158 (black) compared to the best fit BT-Settl synthetic spectra (red). . . 102
6.5. Same as Fig. 6.4 for the esdM3.5 star LHS 1032. . . 103
6.6. BT-Settl synthetic spectra with Teff of 3500 K and varying log g =4.5 (black), 5.0 (blue), 5.5 (red). The effect of gravity and pressure broadening on the sodium doublet is clearly visible. . . 105
6.7. UVES spectrum of the sdM1 star LHS 158 (black) and the best fit BT Settl synthetic spectrum (red). The spectral region used to determine metallicity is shown only. The atomic features used are highlighted. . . 106
6.8. Effective temperature versus near infrared colours of our sample of subdwarfs. The different colours stand for different metallicities: [Fe/H] = −0.5 to −0.7 dex (red), [Fe/H] = −1.0 to −1.2 dex (green), [Fe/H] = −1.3 to −1.6 dex (blue), [Fe/H] = −1.7 dex (brown). The lines are from evolution models from (Baraffe et al. 1998a) at different metallicities (red: −0.5 dex, green: −1.0 dex, blue: −1.5 dex, brown: −2.0 dex) assuming an age of 10 Gyrs. . . 108
6.9. Effective temperature of subdwarfs versus spectral type relation from our sam-ple (filled symbols) compared to the one from Gizis (1997) (open symbols) and to the M dwarfs Teff scale from Rajpurohit et al. (2013) (filled circles). . . 109
6.10. CaH2+CaH3 versus TiO5 diagram for our sample. The labels indicate our metallicity determination. The lines are defined by Lépine et al. (2007). They show the different regions in the diagram where sdM, esdM, and usdM stars are expected. . . 110
6.11. ζ parameter defined by Lépine et al. (2007) vs metallicity diagram. The dots show are sample and the solid black line is the linear-square regression. Other relations from Woolf et al. (2009); Neves et al. (2012); Rojas-Ayala et al. (2012) are superimposed. . . 114
13
List of Tables
4.1. Photometric data. Fluxes Fλ are in log10(ergs cm−2s−1Å−1). . . 65
4.2. Derived parameters for the LHS 1070 system. The uncertainties are drawn from the χ2maps and is 100 K for T
eff. The metallicity is assumed to be [M/H] = 0
and log g = 5.0 to 5.5 (as explained in the text). The luminosity L is computed from the radius and effective temperature. . . 66 4.3. Spectral indices values and derived spectral type computed from TiO and CaH
band-strengths for component A and from the PC3 index for components B and C. . . 66 5.1. Observable and physical quantities for our sample of stars observed at NTT
with EMMI. . . 83 5.2. Observable and physical quantities for our sample of stars observed at SSO. . . 87 6.1. Spectral types, near-infrared photometry, and spectral indices of our sample.
The reference for spectral indices measurement are given. . . 111 6.2. Atomic line data. . . 112 6.3. Stellar Parameters of the observed targets. . . 113
1
Chapter 1
Motivation
M dwarfs are an important part of the low mass stars, which are the most numerous and domi-nant stellar component of the Galaxy and make up the majority of baryonic matter in the Galaxy (Gould et al. 1996; Mera et al. 1996; Henry 1998). These low-mass objects are found to dom-inate the solar neighborhood, as well as more distant field samples and open clusters, with the peak in their luminosity function occurring around MV ∽ 12 and MK∽ 7 (e.g., Dahn et al. 1986; Luyten 1968; Leggett & Hawkins 1988). Their main-sequence lifetimes are much greater than the current estimated age of the Universe (Laughlin et al. 1997). Therefore, the observation and the study of M dwarfs can be used to trace the structure and evolution of the Milky Way. Our understanding of the Galaxy relies upon the description of the stars composing this faint com-ponent, including the determination of their chemical composition. Indeed M-dwarfs have been employed in several Galactic studies, dealing with Galactic disk kinematics (Hawley et al. 1996; Gizis et al. 2002; Lépine et al. 2003a; Bochanski et al. 2005, 2007b, 2010), the structure and the component of the Galaxy (Reid & Gizis 1997; Kerber et al. 2001; Woolf & West 2012) and the initial stellar mass function (Covey et al. 2008; Bochanski et al. 2010). Moreover, an increas-ing number of M dwarfs are now known to host exoplanets, includincreas-ing super-Earth exoplanets (Butler et al. 2004; Bonfils et al. 2012). There are some fundamental and preliminary studies which have been done on M dwarfs, including classifying their spectral type (Kirkpatrick et al. 1991; Reid et al. 1995; Kirkpatrick et al. 1999; Martín et al. 1999; Cruz & Reid 2002), mea-suring radial velocity (Bochanski et al. 2007a), estimating metallicity (Gizis 1997; Lépine et al. 2003a; Woolf & Wallerstein 2006; Lépine et al. 2007; Bean et al. 2006a; Rojas-Ayala et al. 2010; Bonfils et al. 2005) and studying magnetic activity (Reid et al. 1995; Hawley et al. 1996; Gizis 1997; West et al. 2004, 2011). The low mass M dwarfs display a wide range of internal and atmospheric stellar characteristics, including the onset of complete convection in the stellar interior, and the formation of dust, with the subsequent depletion of metals onto dust grains in the stellar atmosphere(Allard et al. 2012a). As progressively cooler stellar and substellar ob-jects are being discovered by various photometric and spectroscopic surveys, the presence of first molecules and then condensed particulates greatly complicates the understanding of their physical properties. In M dwarfs later than M6 the outermost temperatures fall below the con-densation temperatures of silicate grains, which leads to the formation of dust clouds (see e.g.,
2 1. Motivation Tsuji et al. 1996b,a; Allard et al. 1997; Ruiz 1997; Allard et al. 1998). The presence of a wide variety of molecular absorber and numerous condensates greatly complicates the accurate mod-eling of these cool stellar atmospheres.
Despite the large number of very low mass stars in the Galaxy, little is known about them, because it is difficult (i) to get a homogeneous sample with respect to the age and metallicity, owing to their intrinsic faintness, (ii) to disentangle the parameter space (Teff, log g and
metal-licity). Indeed, a number of studies have shown that when using broad band photometry or low resolution spectra a change in temperature or gravity can compensate for a change in metal-licity. Thus high and low-resolution spectroscopic observations of M dwarfs stars are crucial for understanding stellar astrophysics for stars at the bottom end of the main sequence. They are also very important to study the process of planet formation across the H-R diagram as M dwarfs are the most favorable stars for planet detection. An atlas of high-resolution spectra both in the optical and in the near-IR range for very low mass stars will also be critical for the mod-eling of chemical abundances and for probing the physical processes that occur in the complex atmospheres of M dwarfs.
In order to identify and quantify the low mass dwarf stars, transition objects and brown dwarfs we need to determine accurately their stellar parameters such as mass, luminosity, sur-face gravity, radius, effective temperature and atmospheric chemical composition. At present the physical properties of these low mass M dwarfs are not particularly well understood. For example the effective temperature scale of the M dwarfs is controversial, yet it is crucial for a proper understanding of their locus in the Hertzsprung-Russel (H-R) diagram. In particular, the temperature scale is needed to identify the long-sought "brown-dwarfs". The controversy has arisen because the complex spectra are difficult to model reliably. The construction of an effective temperature scale for the M dwarfs has been attempted in recent years by compar-ing the spectra of these objects with synthetic spectra generated by atmospheric models. It is found that the models fit the observed spectral energy distribution (SEDs) and colours fairly well overall, and an effective temperature sequence is indeed derivable from the data fits (Ra-jpurohit et al. 2012b, 2013). However, as Teff decreases from early to late spectral types, some molecular bands that comprise most of the low-resolution spectral features of these cool objects first increase and then decrease in strength owing to dust formation (both through depletion from the gas phase and from green house effects). The molecular line lists used in the models are not fully satisfactory, which could effect the predicted temperature scale. The measurement of the chemical compositions of M dwarfs is still limited, despite the ease of obtaining very high quality spectra for them. Today, the factor limiting the determination of accurate chemical compositions for M dwarfs is the lack of a technique reliable enough to interpret the complex spectra of these stars. Modern techniques of analysis applied to high resolution and high signal-to-noise ratio spectra of solar-type stars consistently yield chemical abundances with internal precisions of 10%. The application of these methods to M dwarfs is complicated by the effects of significant molecule formation and the resulting opacity produced in the photospheres of these stars.
1. Motivation 3 Over the last decade, stellar models for very low mass (VLM) stars have made great progress. Indeed, the PHOENIX model atmospheres synthetic energy distribution improved greatly on that from earlier studies (Allard & Hauschildt 1995a; Hauschildt et al. 1999), as do more re-cent models by Allard et al. (2001, 2011, 2012a); Witte et al. (2011); Rajpurohit et al. (2012b). However, they still have to use some incomplete or approximate input physical parameters such as uncertain collisional damping constants for some atomic lines, molecular bands and for missing line list of opacity source. The comparison between M-dwarf spectra and atmospheric model spectra will bring constraints on the physics of these cool objects. The scientific aim of this study is to investigate the effects of the physical parameters (effective temperature, mass, luminosity, gravity, metallicity, radius) on the spectra and on the behavior of the molecular structures. In particular, chemical abundance is a poorly known parameter, yet is essential in order to understand the physics at different ages of the Galaxy. One approach to studying the physics at the low end of the main sequence is to compare observed spectra with synthetic spec-tra from various authors and modeling techniques. The appropriate physical parameters can be determined by using spectral synthesis, including χ2minimization and other "best fit" criteria.
This thesis describes the results of several projects aimed at characterizing the properties of the very low mass stars, with particular emphasis on M dwarfs and subdwarfs. The layout of this thesis is as follows:
In Chapter 2, we give a general introduction to M dwarfs and subdwarfs. This chapter makes it clear why the study of very low mass stars is important. In chapter 3, we describe in detail the model atmospheres used for the current study. In chapter 4, we confront different model atmospheres described in chapter 3 by directly comparing their predictions with observation on the triple system LHS1070 (Rajpurohit et al. 2012b). In chapter 5, we estimate the effective temperature scale of M dwarfs by comparing a sample of M dwarf spectra (at both medium and low resolution) and broad band photometry with the spectra computed by the recent BT-Settl model atmosphere. We compare the new Teff scale with those which we have found in
the literature and thus establish a revised Teff scale for M dwarfs (Rajpurohit et al. 2013). In Chapter 6, we compare the high resolution optical spectra of subdwarfs with the predictions of the BT-Settl model atmosphere. We estimate the Teff for M subdwarfs using the results of high
resolution optical spectroscopy. Because of the high resolution of our spectra, we can perform a detailed comparison of lines profile of individual elements such as Fe I, Ca II, Ti I, Na I, K I and are able to determine accurate metallicities for the entire M subdwarf spectral sequence, which can later be linked to their kinematical properties. Chapter 7 gives the conclusion of this study, together with future prospectives.
5
Chapter 2
The Basics Properties of M-dwarfs
2.1
Introduction to M-dwarfs
Within less than two decades the study of low-mass stars and brown dwarfs has bloomed into one of the most active fields in astronomy. The low-mass end of the main sequence from M, L, T and Y dwarfs includes objects spanning several orders of magnitude in temperature, from 4000 K down to room temperature, and nearly fills the entire temperature gap between the coolest stars and our Solar System’s giant planets. Stars known as red-dwarfs and red subdwarfs are main sequence stars, a classification typically meant to include all main sequence objects of spectral subtype K5 to M9. Their masses range from 0.08M⊙≤ M⊙≤ 0.8M⊙, based on their estimated metallicity (Chabrier et al. 2000). Despite their intrinsic faintness, M-dwarfs constitute a large fraction of the detectable baryonic matter in the Galaxy. They are the dominant stellar component in the Galaxy, comprising∽ 70% of all stars (Chabrier 2003) and nearly half the stellar mass of the Galaxy which make the lower end of the Hertzsprung-Russel diagram very important. These stars are found in any population, from young metal-rich M-dwarfs in open clusters (Reid 1993; Leggett et al. 1994) to the several billion years old metal-poor dwarfs in the galactic halo (Green & Margon 1994) as well as in globular clusters (Cool et al. 1996; Renzini et al. 1996). Such low mass stars are an important probe for our Galaxy; as they carry fundamental information regarding stellar physics and about the structure, formation and dynamics of the Galaxy. The M-dwarfs span very long life time in the universe. Some have lifetime much greater than the estimated age of the universe, which makes them an important fossil record of Galactic history of great value in probing the structure and evolution of the Milky Way.
Recent improvements in kinematic modelling and magnetic activity analysis have provided enhanced statistical age estimates for populations of low-mass dwarfs (West et al. 2006). When coupled with information about metallicity, these ages can provide valuable insight into the history of the chemical evolution of the Milky Way. Their huge number in the Galaxy makes M-dwarfs very important in the study of various process such as the formation and evolution
6 2. The Basics Properties of M-dwarfs of stars. Because of their ubiquity, cool dwarfs may represent the largest population of stars which have orbiting planets, especially low-mass planets in their respective habitable zones, which with relatively tight orbits for a cool dwarf system. In addition, the fact that the exis-tence of brown dwarfs or planets has been discovered and confirmed around M-dwarfs (Butler et al. 2004; Bonfils et al. 2012) plays an important role in understanding the formation of brown dwarfs and planets. M-dwarfs are also very important to derive various quantities such as Initial mass function (IMF), and the present day mass function. These frequently used functions are derived by using the luminosity. However, the historic deficiency of data for M-dwarfs was primarily due to their intrinsic faintness, a consequence of their low mass. The situation has been radically altered in the last decade, as deep surveys covering large areas of the sky have been carried out. Projects such as the Solan Digital Sky surveys (SDSS, York et al. 2000), the Two-Micron All Sky Surveys (2MASS, Skrutskie et al. 2006) and the Deep Near-Infrared Survey of the Southern Sky (DENIS, Epchtein et al. 1999) can trace their root back to photo-graphic surveys. An important by-product of recent transit surveys has been the discovery of many eclipsing binaries with M-dwarf components (e.g., Coughlin et al. 2011; Harrison et al. 2012; Birkby et al. 2012). These systems have traditionally been the most favourable for deter-mining the basic properties of late-type stars, including their masses, radius, temperature, and luminosity. Unfortunately, most newly discovered systems tend to be faint, so the problem for accurate determinations continues to be that of carrying out accurate spectroscopy.
In general, it is necessary to obtain the spectra of low mass M-dwarf candidates selected by using photometry or a study of proper motions in order to confirm their spectral types; this limits the temperature and mass of a suitable candidate. Low resolution spectra are normally preferred for the initial followup of candidates, since they are adequate for the measurement of broad molecular absorption bands of late-type M-dwarfs, while also providing the high-est signal-to-noise ratios. Most of the well observed M-dwarfs are relatively nearby and their observed trigonometric parallaxes are therefore quite reliable, so that accurate absolute lumi-nosities are known. Methods have been derived to find their mass, their location and density in the Galaxy, their age (involving effective temperature), bolometric corrections, absolute visual magnitude and several colour indices for them have been established. However, the measure-ment of the chemical compositions of M-dwarfs is still limited, as it require lot of telescope time to obtain very high quality spectra for them. The current factor limiting the determination of accurate chemical compositions for M-dwarfs is the lack of a accurate atmosphere models reliable enough to interpret the complex spectra of these stars.
2.2
A Survey of the Properties of M-dwarfs
Determining the fundamental properties of M-dwarfs, is a challenge from both observational and theoretical perspectives. Empirical values for M-dwarfs masses, luminosities, temperatures and radii can be extracted by studying the orbits of M-dwarf binaries (Leinert et al. 2000).
How-2.2. A Survey of the Properties of M-dwarfs 7 ever, the intrinsic faintness of these systems makes their observation challenging and analysis of known binaries reveals systematic variations in inferred temperatures or radii. Theoretical constraints on M-dwarf atmospheric parameters have similarly been difficult to obtain. Ac-curate modelling of the deep convective zones in M-dwarf interiors and of the formation of the molecules and grains that dominate M dwarf atmospheres (Tsuji et al. 1996b; Allard et al. 2000) requires significant computational resources as well as an extensive database of oscillator strengths and opacities obtained from laboratory experiments.
2.2.1
Physical properties
The theory of the evolution of low mass stars is mainly based on a detailed study of the variation with time of bolometric luminosity, effective temperature, radius and angular momentum, for a given stellar mass. Theoretical models of stellar interiors and atmospheres have made predic-tions for the temporal evolution of the first three parameters, while other structure (e.g., winds, disk) may produce loss of angular momentum. The thin radiative skin above the convective region in an M-dwarf determines the surface boundary conditions for the entire temperature structure of the fully convective photosphere and interior. The temperature of M-dwarfs ranges from 4000 to 2300 K and the surface gravity, ranging from ∽ 4.5 - 5.5, allows the forma-tion of various molecules. At these low temperature the structure of M-dwarfs is affected by atomic and molecular opacity and convection. The atmosphere thus become more sensitive to the strong opacity due to molecules such as TiO, H2O, so that this molecular opacity
eventu-ally becomes the main source of absorption. With their complex description of atmospheric physics and chemistry the observations have now reached a high level of sophistication, while the theoretical model side has fallen behind. In particular, precise observational calibrations of the basics physical properties of M-dwarfs, such as their mass, age, radius, luminosity or surface gravity is still missing. Unfortunately the degeneracy in the age-temperature relation for M-dwarfs makes it difficult to make an unambiguous determination of their physical prop-erties. Direct size measurements of low-mass stars represent vital tests of theoretical models of stellar evolution, structure, and atmospheres. As seen in the results of Berger (2006), notable disagreements exist between interferometrically determined radii and those calculated in low-mass stellar models such as those of Chabrier & Baraffe (1997) and Siess & Livio (1997) in the sense that interferometrically obtained values for the stellar diameters are systematically larger by more than 10% than those predicted from models. Developments on both the observational and theoretical fronts are thus essential in order to obtain meaningful and important estimates of the physical properties of M-dwarfs (see the review from Allard et al. 1997, 2012a; Chabrier et al. 2000).
2.2.2
Photometric Properties
SDSS, 2MASS and DENIS have had great success in discovering M-dwarfs. If the images are deep enough and an appropriate combination of filters is used, it is actually easier to
iden-8 2. The Basics Properties of M-dwarfs tify cool M-dwarfs than many other classes of astronomical objects, because of the distinctive nature of their spectral energy distribution (SED), which is due to the presence of strong molec-ular absorption bands. The colours of M-dwarfs provide insight into the processes operating in their atmospheres. Because of their intrinsic faintness, moderate- to high-resolution spec-troscopy may not be performed on all of the cool M-dwarfs which have been discovered by these surveys. Thus, analyses of cool M dwarf colours could be essential in providing infor-mation on their physical properties. As is well known, the chemical composition of the stellar photosphere (or its metallicity) affects the stellar energy distribution. Systematic trends have also been identified in colour-colour diagrams using the known correlation between kinematic population and metallicity. Alternatively, the location of a star in a colour-colour diagram can be used as a metallicity indicator: the metal-poor subdwarfs stars are usually sub-luminous in such a diagram (fig. 2.1).
The reason for this behaviour is that the decreased metallicity leads to a decreased atmo-spheric opacity. This effect means that a star of fixed mass ‘moves‘ in the H-R diagram to a position of higher Teff and higher luminosity. For very cool M-dwarfs, broadband photometry
at near-IR wavelengths is primarily detecting the strong molecular bands of H2O, CH4, CO,
and H2. Broadband photometry at optical wavelengths (λ ≤ 1µm) measures very different
spec-trophotometric features. Despite the faintness of cool dwarfs, the multicolour photometry of M-dwarfs has proven to be sufficient for the determination of the normal colours, bolometric corrections, and Teff for them. Optical and near infrared photometry can be useful as a
diag-nostic tool for finding the potential candidate of very low mass stars, but it is not possible to disentangle the parameters when addressing different populations of very low mass stars..
2.2.3
Spectroscopic properties
The H-R diagram is the most important map in stellar astronomy. It provides a relatively straightforward method for separating different stellar luminosity classes. The theoretical study of stars is usually divided into separate parts dealing with stellar interiors and stellar atmo-spheres. Although they are interesting objects in their own right, M-dwarfs have a wider po-tential which at present is largely unrealized, because investigation of their properties is largely hampered by the complex lines and bands of diatomic and triatomic molecules which appear in their observed spectra. The effects of temperature and of reduced gravity modify the chemical and physical properties of their atmospheric layers, producing the peculiar spectroscopic fea-tures that have been identified in the optical spectra of M-dwarfs. In an M-dwarf atmosphere most of the hydrogen is locked into H2 and most of the carbon into CO. With decreasing tem-perature, M dwarf spectra show an increase in abundances of diatomic and triatomic molecules which contributes to the optical and the near-infrared spectra (such as SiH, CaH, CaOH, TiO, VO, CrH, FeH, OH, H2O, CO). The TiO bands in the optical region and the H2O bands in the infrared have complex and extensive band structures, leaving no window for the true continuum and creating a pseudo-continuum which allows observation of only the strongest (often reso-nance) atomic lines such as those from Ca II, Na I and K I (Allard 1990a; Allard & Hauschildt 1995a).
2.2. A Survey of the Properties of M-dwarfs 9
Figure 2.1 – Loci of cool stars classified as M dwarfs, subdwarfs (sdM), extreme subdwarfs (esdM) and ultrasubdwarfs (usdM) in the SDSS g-r/r-i colour-colour space by Lépine (2009).
The spectral transition from low-mass M dwarfs to the latest type brown dwarfs is notewor-thy for demonstrating how a considerable transformation of the spectral features can be due to a small change in the effective temperature. The spectral transition is characterized by i) the condensation onto seeds of strong opacity-causing molecules such as CaH, TiO and VO, which govern the entire visual to near-infrared part (0.4-1.2 µm) of the spectral energy distribution (hereafter SED); ii) a ’veiling’ due to Rayleigh and Mie scattering from sub-micron to micron-sized aerosols; iii) a weakening of the infrared water vapour bands owing to oxygen-rich grain
10 2. The Basics Properties of M-dwarfs
Figure 2.2 – The optical to red SED of M-dwarfs from M0 to M8, observed at Siding Spring Observatory (SSO) at a spectral resolution of 1.4 Å. The atomic and molecular features are clearly visible. The chromospheric emission fills the Na I D transition for the latest-type M-dwarfs displayed here, while M8 has a flatter spectrum because of dust scattering.
condensation and to the greenhouse (or blanketing effect) caused by silicate dust; iv) methane and ammonia band formation in T and Y dwarfs; v) water vapour condensation in Y dwarfs (Teff ≤ 500 K). Condensation begins to occur in M dwarfs with Teff ≤ 3000 K. In T dwarfs and
brown dwarfs the visual to red part of the SED is dominated by the wings of the Na I D and 0.77 µm K I alkali doublets, which form out to as much as 2000 Å from the line centre (Allard et al. 2007a). The SED of those dwarfs is therefore dominated by molecular opacities and resonance atomic transitions under pressure (∽3 bars) broadening conditions, leaving no window for the continuum (Allard 1990a; Allard et al. 1997, 2012a).
2.2. A Survey of the Properties of M-dwarfs 11 Despite their extreme faintness (10−2−10−5L
⊙) in V bandpass, M-dwarfs yield spectroscopic
features which can still provide us with information about basic atmospheric properties such as luminosity, metallicity and temperature. For example i) The CaOH bands around 0.54-0.556 µm in dwarfs later than M3 are a very good temperature indicator and a good discriminant between M-dwarfs and backgrounds red giant stars (Gizis 1997; Reid & Gizis 2005; Martin et al. 1996). ii) An atomic spectral feature such as that of Ca I (6162 Å) can possibly be used to distinguish subdwarfs from dwarfs. iii) Hydride bands such as those of CaH at 6380 Å and 6880 Å decreases in strength with decreasing temperature, whereas the NaI doublet at 8183 Å and 8195 Å is relatively strong for earlier type M-dwarfs but relatively weaker for later type. iv) The KI doublet at 7665 Å and 7699 Å is very strong and is useful for making gravity determination. v) The saturation of the TiO band strength in M-dwarfs later than M5 and the introduction of the VO to TiO band strength index is now used to classify M-dwarfs and substellar candidates later than M5 (Henry et al. 1994; Kirkpatrick et al. 1995; Martin et al. 1996). Figure 2.2 shows the optical to red SED of M-dwarfs from M0 to M9.5, observed at Siding Spring Observatory (SSO) at a spectral resolution of 1.4 Å (Rajpurohit et al. 2013). Molecular band spectra are much more complex than atomic spectra and dominate the spectral regions in which they are located. TiO has an especially distributed and complex spectrum and it dominates M dwarf spectra in the spectral regions traditionally used to determine the chemical compositions of solar-type stars. This can be seen in fig. 2.2, where the M dwarf spectra show a significant deviation, primarily due to TiO absorption, from the predominantly smooth continuum spectra of earlier type stars.
Figures 2.3 to 2.6 shows the IR spectra of M-dwarfs (Cushing et al. 2005). It can be seen that the dominant near infrared features are due to photospheric absorption by water vapour, FeH, neutral metals, carbon monoxide, and OH. The absorption lines of neutral metals, as well as the bands of water and CO, become stronger with decreasing temperature. In the optical region, metal-poor stars show strong features relative to the strength of the molecular TiO bands. However, in the infrared regime the dominant molecular features are due to water, and this single metal species will not show the same level of decrease as the double metal TiO. The atomic spectral lines such as those of Fe I, Ca I, Na I, K I, Si I, Mg I, Al II, along with some hydride bands such as those of FeH, can be seen in the J-band spectra with equivalent widths of 2-2.5 Å and 1.52 Å, respectively; but most of these features weaken in the spectra of mid-to late-type M-dwarfs. The H band is the most difficult wavelength range in which to identify features in the spectra of early M-dwarfs, because it contains many relatively weak absorption features which defy definite identification. Only a few doublets and triplets of Mg, Si, Al, and K are clearly evident, with the possible exception of OH (1.689 µm). H2O bands define the
shape of the J and H band peaks. Water absorption is most obvious in the J-band at 1.33 µm and strengthens through the later M-dwarf types. The K-band spectra of early M-dwarfs also exhibit atomic features due to Ca, Mg, Al, Si, Na, Ti, and Fe and also shows strong CO bands. These spectral features all weaken with decreasing temperature. H2O absorption bands also appear on either side of the K-band at a spectral type of ∽ M4 and strengthen through the M, L, and T sequences.
12 2. The Basics Properties of M-dwarfs
Figure 2.3 – z-band spectra sequence of M-dwarfs (Cushing et al. 2005). The most prominent molecular and atomic features are indicated.
2.3
Stellar Parameters of M-dwarfs
2.3.1
Effective Temperature
An effective temperature measurement for a low-mass star or brown dwarf is important to deter-mine flux or luminosity which then can be used to confirm whether a given object is hot or cool. The empirical temperature scale for cool stars is generally well established and temperatures are now known with reasonable precision for stars covering the range of spectral type from A to M. The M dwarf temperature scale has been a subject of some interest for several decades now,
2.3. Stellar Parameters of M-dwarfs 13
Figure 2.4 – J-band spectra sequence of M-dwarfs (Cushing et al. 2005). The most prominent molecular and atomic features are indicated.
especially since the development of detectors with suitable sensitivity in the infrared spectral region has made it possible to obtain the relevant observational data. Empirical temperatures for metal-deficient and metal rich stars had been virtually non-existent, but recently the infra-red flux method (IRFM) has been applied by Casagrande et al. (2008) to a sample of M-dwarfs, providing approximate Teff values for them. Empirical measurement of M dwarf temperature
can be obtained by the information extracted from the orbits of M dwarf binaries. As shown by the results of Irwin et al. (2011) and Kraus et al. (2011), radii and temperatures of low-mass stars obtained from eclipsing binaries are systematically larger and cooler (respectively) for given mass. This is mainly due to the intrinsic faintness of these low-luminosity systems, and the analyses of known binaries reveal systematic offsets in inferred temperatures and radii
14 2. The Basics Properties of M-dwarfs
Figure 2.5 – H-band spectra sequence of M-dwarfs (Cushing et al. 2005). The most prominent molecular and atomic features are indicated.
that correlate with both orbital period and magnetic activity. Strong magnetic field can prevent convection, thus giving larger radii for a given Teff or lower Teff for a given radius (Casagrande
et al. 2008). The presence of numerous large spots at the surface can thus lower the Teff of the
star.
Significant advances have also been made in atmospheric modelling for cool stars, by incor-porating improved metal-line and molecular line source of opacity in the models. The effective temperature of cool M-dwarfs can be estimated from their spectral type and from the fitting of observed spectral lines to the synthetic spectra predicted using a model atmosphere. Synthetic photometry generated using the model atmosphere show good agreement with the empirical
2.3. Stellar Parameters of M-dwarfs 15
Figure 2.6 – K-band spectra sequence of M-dwarfs (Cushing et al. 2005). The most prominent molecular and atomic features are indicated.
temperature scales and now allows us to extend the temperature calibrations confidently to stars over the full range of parameter space. As an important first step, a conversion between spectral type and temperature is required.
The resulting scale may give results which differ significantly from an accurate conversion rule, but in the absence of a robust determination of the temperature scale at young star ages (e.g., from eclipsing binaries), this scale offers a reasonable way of interpreting spectral types and luminosities in terms of star masses and ages within current evolutionary models. The de-termination of M dwarf effective temperatures has been refined considerably since the work of
16 2. The Basics Properties of M-dwarfs Veeder (1974); Pettersen (1980); Bessell (1991). They fitted blackbody curves through broad-band colours and the points of an assumed observed continuum. Tsuji et al. (1996b) provided, good Teff values using IRFM. Casagrande et al. (2008) provided a modified IRFM Teff for dwarfs, including M-dwarf. The Teff scale of M-dwarfs can be developed by using a set of
evolutionary models. Luhman (1999) initially adopted a Teff which is based on the NextGen
and AMES-Dusty evolutionary models of (Baraffe et al. 1998a) and (Chabrier et al. 2000), re-spectively. Luhman et al. (2003) then adjusted this Teff scale further, so that the sequences of
IC 348 and Taurus at ≤ M9 were parallel to those model isochrones on the Hertzsprung-Russell diagram. Their Teff conversion is likely to be inaccurate at some level, as it falls between the scales for dwarfs and giants. However, even the current empirical methods (Berriman et al. 1992; Jones et al. 1994) still assume that nearly pure thermal radiation escapes from an M-dwarf atmospheres at some wavelength. Such an assumption is reliable only for optically thick layers of a non-convective atmosphere but models strongly suggest that M dwarf atmospheres are convective out to optical depths as low as τ ∽ 10−3. The photospheric structure of an M dwarf is much more sensitive to opacity caused by TiO and H2O. Thanks to the large improve-ment in knowledge about the source of atomic and molecular line opacities, particularly for TiO (which dominate the optical spectral range) and for H2O (which dominates in near-infrared
range), as well as to revised estimates of solar abundances (Asplund et al. 2009; Caffau et al. 2011), there now appears to be much improvement in the Teff scales obtain using a given model
atmosphere over entire spectral sequence of M dwarfs (Rajpurohit et al. 2013).
2.3.2
Gravity
The problem of gravity is to be determined with sufficient precision since a small error in log g causes a large error is radius or age. Although the infrared spectra of late-type M-dwarfs are strongly affected by the presence of water bands, many atomic features can be resolved by careful observations. Some of the atomic features have proved to be fairly sensitive to changes in effective temperature and metallicity. We still lack, however, any direct measurements for the age of low mass stars, for which age becomes an important parameter. For example a 0.2M⊙ object takes 0.2 Gyr to reach the main sequence, a 0.1M⊙object takes 1 Gyr whereas a 0.075M⊙ object takes 2.5 Gyrs (Burrows et al. 1997; Baraffe et al. 1997, 1998a). A reliable measure of age for low mass star is therefore vital for locating them on a Hertzsprung-Russell diagram. Not only Teff and metallicity but also surface gravity is sensitive to age. If we can measure surface
gravity accurately then in principle we can distinguish between young cooling brown dwarfs and old late-type M-dwarfs with similar colours (Viti & Jones 1999). Gravity-sensitive spectral features due to Na I, K I, H2O complicate the measurement of spectral types but also provide
valuable constraints on the ages of late-type dwarfs. In particular, these features offer a means of confirming the youth, of candidate low-mass members of young clusters and associations. The prominent CaH molecular absorption bands in M dwarf optical spectra are often used as gravity indicators. Typically, M dwarf spectra are collected with lower resolution because of their intrinsic faintness and so require broad 30-50Å-wide indices. Early surveys for M-dwarfs and young brown dwarfs used optical spectroscopy of Na I, K I, CaH, and VO for this purpose
2.3. Stellar Parameters of M-dwarfs 17 (Luhman et al. 1997; Shkolnik et al. 2009); similar features were soon recognized at near-IR wavelengths as well (Luhman et al. 1998). Figure 2.7 show the effect of gravity and the pressure broadening of the Na I doublet. The variation of gravity sensitive lines with star age has been examined by Viti & Jones (1999).
Figure 2.7 – BT-Settl models for an effective temperature of 3500 K and varying log g = 4.5 (black), 5.0 (blue), 5.5 (red). The effect of gravity and the pressure broadening of the Na I doublet is clearly visible.
2.3.3
Metallicity
The chemical analysis of M-dwarfs is notoriously difficult, owing to the complex molecular spectra of their cool atmospheres (Mould 1976a; Gustafsson 1989). Mould (1976a) was the first to explore systematically the strength of M dwarf spectral features as a function of metal-licity, constructing a grid of synthetic model atmospheres that included molecular opacities and spanned a temperature of 4200-3000 K and a metallicities of [Fe/H]=-2.0 - 0.0 dex. This study gave rough estimates of metallicity for M-dwarfs and established several foundation for subse-quent investigations of M-dwarfs dealing with, for example, the metallicity sensitivity of TiO absorption and the gravity sensitivity of CaH absorption. Substantial progress in metallicity estimation for M-dwarfs has been made recently, using both photometry and spectroscopy al-though, the faintness characterizing the M-dwarfs has limited the number of high-resolution, high signal-to-noise studies. Insufficient resolution and the presence of dominant molecular
18 2. The Basics Properties of M-dwarfs features in the spectrum make it difficult to derive the accurate atomic line strengths needed to make reliable metallicity estimates. Metallicities have been derived via photometric calibra-tions. Photometric techniques are based on the higher optical opacity present in metal-rich stars, which shifts visible light into the infrared (e.g. Delfosse et al. 2000; Bonfils et al. 2005) ana-lyzed V and K band photometry for 20 wide M-dwarf binary companion to FGK-dwarfs whose metallicities could be determined reliably via standard spectroscopic techniques. Assuming that both binary components inherit the same metallicity from their parent molecular cloud material, Bonfils et al. (2005) assigned the metallicity measurements for each primary stars to its M-dwarf secondary and so derived iso-metallicity contours in the MV vs. V-Kscolour-magnitude plane.
Bonfils et al. (2005) first calibrated this relationship using spectroscopic metallicities derived for metal-poor early-M-type dwarfs by Woolf & Wallerstein (2005); later groups modified this work and addressed its limitations (Johnson & Apps 2009; Schlaufman & Laughlin 2010). Photometric techniques have generally been limited by the requirement for a sufficiently high absolute magnitudes of the targets, although the new technique presented in Johnson et al. (2011) depends on colour alone. Empirical spectroscopic techniques have also been developed, which rely on calibrations using the strength of specific optical (Woolf & Wallerstein 2006) or near-infrared K-band (Rojas-Ayala et al. 2010) features. Rojas-Ayala et al. (2010) used NaI, CaI, and H2O spectral features to model metallicity, and calibrated their model using M dwarf
companions to FGK stars, with an uncertainty of ±0.15 dex. Bean et al. (2006a) analyzed optical spectra with R ≥ 50 000 and signal-to-noise ratios between 200 and 400 of three stars. They used the methods developed in Bean et al. (2006b) making a fitting to their synthetic spectra for 16 atomic lines in the spectral intervals 8326 Å to 8427 Å and 8660 Å to 8693 Å, as well as for the TiO band-head at 7088 Å. They simultaneously determined Teff ,metallicity,
broadening parameters and continuum normalization factor from the spectral data. Bean et al. (2006b) used data from five wide binary stars with FGK primaries and M-dwarfs secondaries to evaluate their methods.
2.4
M-subdwarfs
The metal-poor stars of the thick disk and spheroid provide an invaluable record of Galactic history. The main-sequence FGK subdwarfs have proven to be an important source of informa-tion on these populainforma-tions (e.g., Carney et al. 1994). The much cooler and fainter M subdwarfs offer an important alternative tracer group. Indeed, in addition to the possibility of observing the proper motion of nearby M subdwarfs, it is now feasible to obtain photometry for the M subdwarfs in globular clusters and also spectra for M-dwarfs and M subdwarfs at distances of a few kiloparsecs above the galactic plane with a telescope of 10-meter class (Reid & Gizis 1997). Using these M-dwarfs as probes of Galactic structure, however, requires a good understanding of their properties in order to derive accurate metallicities and luminosities for them.
counter-2.4. M-subdwarfs 19 parts because their atmospheres are deficient in metals (Baraffe et al. 1997). The search for M subdwarfs is hampered not only by the fact that metal-poor stars are both rare and intrinsically faint but also because late-type M subdwarfs do not show exceptionally red colours typical of ultracool M dwarfs and brown dwarfs (Lépine et al. 2003a). They appear less luminous because their atmosphere is deficient in metals (Baraffe et al. 1997). Owing to their lower metallicity and intrinsic faintness, M subdwarfs lie below their solar-metallicity counterpart in the H-R dia-gram. Subdwarfs are typically very old (10 Gyr or more) and probably belong to the old Galactic populations: old disk, thick disk and spheroid, as shown by their spectroscopic features, their kinematic properties and their ages (Digby et al. 2003; Lépine et al. 2003a; Burgasser et al. 2003). They also exhibit high proper motions and high heliocentric velocities (Gizis 1997). As the low-mass subdwarfs, with their extremely long nuclear burning lifetimes, were presum-ably formed early in the Galaxy’s history, they are important tracers of Galactic structure and of chemical enrichment history. In addition, detailed studies of their complex spectral energy distributions give new insights into the role of metallicity in the opacity structure, chemistry and evolution of cool atmospheres, and information about the fundamental issues of spectral classification and temperature vs luminosity scales. (Gizis 1997) proposed a first classification of M subdwarfs (sdM) and extreme subdwarfs (esdM), based on TiO and CaH band strengths in low resolution optical spectra. Lépine et al. (2007) has recently revised that classification and has proposed a new classification for the most metal-poor stars, the ultra subdwarfs (usdM). Jao et al. (2008) compared model grids with the optical spectra to characterize the spectral energy distribution of subdwarfs using the three parameters temperature, gravity, and metallicity. They thus gave an alternative classification scheme for subdwarfs. Despite the rather large number of them in the Galaxy, very little is known about them because their intrinsic faintness makes it difficult to get a homogeneous sample of unique age and metallicity. Moreover, the atmospheric parameters and the mass-luminosity relation for sdMs stars have long remained uncertain be-cause of the lack of very low-mass stellar models. Despite the availability of low mass model atmosphere and synthetic spectra, it has still proven difficult to separate the effects of reduced metallicity from those of increased gravity or reduced effective temperature, since these fac-tors all affects the pressure structure of the photosphere in similar way (Allard 1990a; Allard & Hauschildt 1995a).
Cool subdwarfs have low metallicity, and therefore their opacities are different from those of dwarfs. With decreasing temperature, sdMs spectra show an increase in the abundances of diatomic and triatomic molecules in the optical and in the near-infrared (e.g SiH, CaH, CaOH, TiO, VO, CrH, FeH, OH, H2O, CO). TiO dominates the opacity sources in the optical region,
while the H2O bands in the infrared have complex and extensive band structures. This leaves no window for the true continuum and creates a pseudo-continuum that only permits observation of the strongest, often resonance, atomic lines (Allard 1990a; Allard & Hauschildt 1995a). However, owing to low metallicity, the TiO bands are less strong, and so the pseudo-continuum is brighter as a result (fig. 2.8) . This increases the contrast with the other opacity sources such as hydride bands and with atomic lines from atoms subjected the higher pressures of the deeper layers from which they emit their radiation.
Atmospheric models show that metallicity variations in cool and ultra-cool stars have dra-matic effects on their optical spectra (Allard & Hauschildt 1995a). This is useful because
low-20 2. The Basics Properties of M-dwarfs
Figure 2.8 – Synthetic spectra for stars having Teff =3500 K and log g = 5.0 (Jao et al. 2008). The red, green, and blue lines represent different metallicities, 0.0, -2.0, and -4.0. Note that the relative amounts of blue and red fluxes tend toward bluer objects at lower metallicities.
resolution spectroscopy is sufficient for measuring both effective temperature and metallicity effects. Metallicity effects on the physics of cool atmospheres have been studied both from models and from SED (Allard 1990a; Leggett et al. 1996, 1998; Burgasser 2002). The M subd-warfs in binary and multiple systems for which the metallicity of the hotter primary is known as well as clusters with VLM stars of the same age and metallicity, both offer more promise as test of metal poor evolutionary and atmosphere models. The primary effects of metallicity are the strengthening of hydride bands (OH, FeH), the appearance of pressure induced absorptions by H2 around 2 µm relative to double metal (TiO,VO) bands and the broadening of atomic lines.
We therefore see these molecular bands in more details than for M-dwarfs and under more ex-treme gas pressure conditions. This can reveal the inaccuracy or incompleteness of the opacity sources used in the model. This difficulty, combined with a lack of accurate line lists for molec-ular hydride absorption bands, has hampered efforts to obtain the atmospheric parameters of observed M subdwarfs by using spectral synthesis. Subdwarfs were generally identified from optical and proper motion catalogues and from photographics plates at different epochs (Scholz et al. 2000; Lépine et al. 2003a; Lodieu et al. 2005). Several surveys have been conducted to search for subdwarfs over a wide temperature range, including hot, intermediate and cool com-ponents. The range of metallicity of subdwarfs, extreme-subdwarfs and ultra-subdwarfs span
2.4. M-subdwarfs 21 approximately -0.5 and -1.0, -1.0 and -1.5 and below -1.5 dex, respectively (Gizis 1997; Woolf et al. 2009). M-type subdwarfs have typically Teff below ∽3500-4000 K (depending on the metallicity Baraffe et al. (1997); Woolf et al. (2009)) and should display high gravity (log g∽ 5.5) although some variations is seen amongst low-metallicity spectra (Jao et al. 2008).
23
Chapter 3
A Model Atmosphere For Low Mass Stars
3.1
Introduction
When we examine the spectrum of a star we are measuring information about the frequency distribution of its radiation field. We observe the broad expanses of the spectrum in which the frequency distribution is relatively smooth, the continuum, and, in addition, many narrower features, spectral lines and/or bands, which give relatively sharp peaks superposed on the back-ground continuum. The former regions arise from the emission and absorption of photons by atoms in various process involving transitions to free states, either from an initially bound state (photo-ionization) or free states (free-free transitions). The complete spectrum implicitly con-tains an enormous amount of information about the physical state of the atmosphere of the star. It will be our primary goal to recover this information, although drawing reliable inferences from all this physical information provided by observations is by no means an easy task. The relevant data are often difficult to acquire, since frequently the observed spectra are just the end product of the interactions within complicated physical structures. For example, in any given spectrum the radiation we observe originates from a wide range of levels in the atmosphere, deep layers contribute to the relatively transparent continua while higher layers contributes to the more opaque lines.
The rate of discovery of low-mass stars has accelerated in recent years. It is thus now possible to investigate the formation and early evolution of stars in a previously unexplored mass regime. Determining the physical properties of low-mass stars is important for our un-derstanding not only of planet formation but also of circum-stellar disks, of dust formation in cool atmospheres, and of the initial mass function. The direct measurement of mass and/or radius for low-mass stars is possible only for certain rare binary systems. Determining other physical properties such as effective temperature and surface gravity from bolometric lumi-nosity estimates requires a precise distance measurement and also assumptions about age (to determine effective temperature), mass and radius (to infer a value for the surface gravity from


![Figure 3.1 – Fig. 1 of the review article by Allard et al. (2012a). The near-infrared SED of VB10 is compared with the synthetic spectra (Teff = 2800 K, log g = 5.0, [M/H] = 0.0) from diverse model grids published through the years](https://thumb-eu.123doks.com/thumbv2/123doknet/14612411.545760/45.892.140.830.162.792/figure-article-allard-infrared-compared-synthetic-spectra-published.webp)