HAL Id: hal-02527775
https://hal.inria.fr/hal-02527775v2
Submitted on 15 Nov 2020
HAL is a multi-disciplinary open access
archive for the deposit and dissemination of
sci-entific research documents, whether they are
pub-lished or not. The documents may come from
teaching and research institutions in France or
abroad, or from public or private research centers.
L’archive ouverte pluridisciplinaire HAL, est
destinée au dépôt et à la diffusion de documents
scientifiques de niveau recherche, publiés ou non,
émanant des établissements d’enseignement et de
recherche français ou étrangers, des laboratoires
publics ou privés.
The Software Heritage Graph Dataset: Large-scale
Analysis of Public Software Development History
Antoine Pietri, Diomidis Spinellis, Stefano Zacchiroli
To cite this version:
Antoine Pietri, Diomidis Spinellis, Stefano Zacchiroli. The Software Heritage Graph Dataset:
Large-scale Analysis of Public Software Development History. MSR 2020 - 17th International Conference
on Mining Software Repositories, Oct 2020, Seoul, South Korea. �10.1145/3379597.3387510�.
�hal-02527775v2�
The Software Heritage Graph Dataset:
Large-scale Analysis of Public Software Development History
Antoine Pietri
[email protected] Inria Paris, FranceDiomidis Spinellis
[email protected]Athens University of Economics and Business
Athens, Greece
Stefano Zacchiroli
Université de Paris and Inria Paris, France
ABSTRACT
Software Heritage is the largest existing public archive of software source code and accompanying development history. It spans more than five billion unique source code files and one billion unique com-mits, coming from more than 80 million software projects. These software artifacts were retrieved from major collaborative devel-opment platforms (e.g., GitHub, GitLab) and package repositories (e.g., PyPI, Debian, NPM), and stored in a uniform representation linking together source code files, directories, commits, and full snapshots of version control systems (VCS) repositories as observed by Software Heritage during periodic crawls. This dataset is unique in terms of accessibility and scale, and allows to explore a number of research questions on the long tail of public software development, instead of solely focusing on “most starred” repositories as it often happens.
ACM Reference Format:
Antoine Pietri, Diomidis Spinellis, and Stefano Zacchiroli. 2020. The Soft-ware Heritage Graph Dataset: Large-scale Analysis of Public SoftSoft-ware De-velopment History. In 17th International Conference on Mining Software Repositories (MSR ’20), October 5–6, 2020, Seoul, Republic of Korea.ACM, New York, NY, USA, 5 pages. https://doi.org/10.1145/3379597.3387510
1
INTRODUCTION
Analyses of software development history have historically focused on crawling specific “forges” [18] such as GitHub or GitLab, or language specific package managers [5, 14], usually by retrieving a selection of popular repositories (“most starred”) and analyzing them individually. This approach has limitations in scope: (1) it works on subsets of the complete corpus of publicly available soft-ware, (2) it makes cross-repository history analysis hard, (3) it makes cross-VCShistory analysis hard by not being VCS-agnostic.
The Software Heritage project [6, 12] aims to collect, preserve and share all the publicly available software source code, together with the associated development history as captured by modern VCSs [17]. In 2019, we presented the Software Heritage Graph Dataset, a graph representation of all the source code artifacts archived by Software Heritage [16]. The graph is a fully dedupli-cated Merkle dag [15] that contains the source code files, directories, commits and releases of all the repositories in the archive.
Publication rights licensed to ACM. ACM acknowledges that this contribution was authored or co-authored by an employee, contractor or affiliate of a national govern-ment. As such, the Government retains a nonexclusive, royalty-free right to publish or reproduce this article, or to allow others to do so, for Government purposes only. MSR ’20, October 5–6, 2020, Seoul, Republic of Korea
© 2020 Copyright held by the owner/author(s). Publication rights licensed to ACM. ACM ISBN 978-1-4503-7517-7/20/05...$15.00
https://doi.org/10.1145/3379597.3387510
The dataset captures the state of the Software Heritage archive on September 25th 2018, spanning a full mirror of Github and GitLab.com, the Debian distribution, Gitorious, Google Code, and the PyPI repository. Quantitatively it corresponds to 5 billion unique file contents and 1.1 billion unique commits, harvested from more than 80 million software origins (see Section C for detailed figures). We expect the dataset to significantly expand the scope of soft-ware analysis by lifting the restrictions outlined above: (1) it pro-vides the best approximation of the entire corpus of publicly avail-able software, (2) it blends together related development histories in a single data model, and (3) it abstracts over VCS and package differences, offering a canonical representation (see Section C) of source code artifacts.
2
RESEARCH QUESTIONS AND CHALLENGES
The dataset allows to tackle currently under-explored research questions, and presents interesting engineering challenges. There are different categories of research questions suited for this dataset. • Coverage: Can known software mining experiments be replicated when taking the distribution tail into account? Is language detection possible on an unbounded number of languages, each file having potentially multiple extensions? Can generic tokenizers and code embedding analyzers [7] be built without knowing their language a priori?
• Graph structure: How tightly coupled are the different layers of the graph? What is the deduplication efficiency across different programming languages? When do contents or directories tend to be reused?
• Cross-repository analysis: How can forking and duplica-tion patterns inform us on software health and risks? How can community forks be distinguished from personal-use forks? What are good predictors of the success of a commu-nity fork?
• Cross-origin analysis: Is software evolution consistent across different VCS? Are there VCS-specific development patterns? How does a migration from a VCS to another af-fect development patterns? Is there a relationship between development cycles and package manager releases? The scale of the dataset makes tackling some questions also an engineering challenge: the sheer volume of data calls for distributed computation, while analyzing a graph of this size requires state of the art graph algorithms, being on the same order of magnitude as WebGraph [8, 9] in terms of edge and node count.
MSR ’20, October 5–6, 2020, Seoul, Republic of Korea Antoine Pietri, Diomidis Spinellis, and Stefano Zacchiroli
Appendix A
FIGURES
The dataset contains more than 11B software artifacts, as shown in Figure 1. Table # of objects origin 85 143 957 snapshot 57 144 153 revision 1 125 083 793 directory 4 422 303 776 content 5 082 263 206
Figure 1: Number of artifacts in the dataset
Appendix B
AVAILABILITY
The dataset is available for download from Zenodo [16] in two different formats (≈1 tb each):
•a Postgres [19] database dump in csv format (for the data) and ddl queries (for recreating the DB schema), suitable for local processing on a single server;
•a set of Apache Parquet files [2] suitable for loading into columnar storage and scale-out processing solutions, e.g., Apache Spark [20].
In addition, the dataset is ready to use on two different distributed cloud platforms for live usage:
•on Amazon Athena, [1] which uses PrestoDB to distribute SQL queries.
•on Azure Databricks; [3] which runs Apache Spark and can be queried in Python, Scala or Spark SQL.
Appendix C
DATA MODEL
The Software Heritage Graph Dataset exploits the fact that source code artifacts are massively duplicated across hosts and projects [12] to enable tracking of software artifacts across projects, and reduce the storage size of the graph. This is achieved by storing the graph as a Merkle directed acyclic graph (DAG) [15]. By using persistent, cryptographically-strong hashes as node identifiers [11], the graph is deduplicated by sharing all identical nodes.
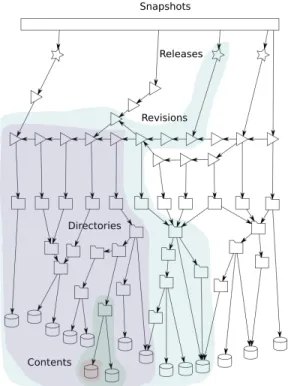
As shown in Figure 2, the Software Heritage DAG is organized in five logical layers, which we describe from bottom to top.
Contents(or “blobs”) form the graph’s leaves, and contain the raw content of source code files, not including their filenames (which are context-dependent and stored only as part of directory entries). The dataset contains cryptographic checksums for all con-tents though, that can be used to retrieve the actual files from any Software Heritage mirror using a Web api1and cross-reference files encountered in the wild, including other datasets.
Directoriesare lists of named directory entries. Each entry can point to content objects (“file entries”), revisions (“revision entries”), or other directories (“directory entries”).
Revisions(or “commits”) are point-in-time captures of the entire source tree of a development project. Each revision points to the root directory of the project source tree, and a list of its parent revisions.
1https://archive.softwareheritage.org/api/
Figure 2: Data model: a uniform Merkle DAG containing source code artifacts and their development history
Releases(or “tags”) are revisions that have been marked as noteworthy with a specific, usually mnemonic, name (e.g., a ver-sion number). Each release points to a reviver-sion and might include additional descriptive metadata.
Snapshotsare point-in-time captures of the full state of a project development repository. As revisions capture the state of a single development line (or “branch”), snapshots capture the state of all branches in a repository and allow to deduplicate unmodified forks across the archive.
Deduplication happens implicitly, automatically tracking byte-identical clones. If a file or a directory is copied to another project, both projects will point to the same node in the graph. Similarly for revisions, if a project is forked on a different hosting platform, the past development history will be deduplicated as the same nodes in the graph. Likewise for snapshots, each “fork” that creates an identical copy of a repository on a code host, will point to the same snapshot node. By walking the graph bottom-up, it is hence possible to find all occurrences of a source code artifact in the archive (e.g., all projects that have ever shipped a specific file content).
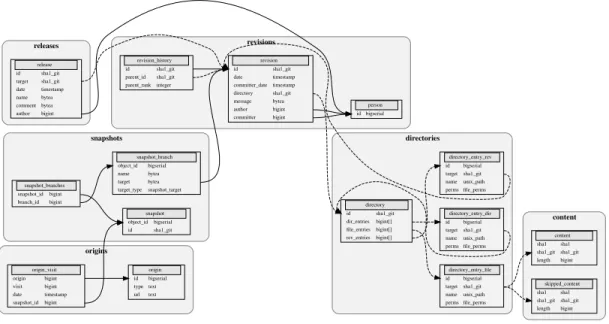
The Merkle dag is encoded in the dataset as a set of relational tables. In addition to the nodes and edges of the graph, the dataset also contains crawling information, as a set of triples capturing where (an origin url) and when (a timestamp) a given snapshot has been encountered. A simplified view of the corresponding database schema is shown in Figure 3; the full schema is available as part of the dataset distribution.
content revisions directories snapshots origins releases content sha1 sha1 sha1_gitsha1_git length bigint directory id sha1_git dir_entries bigint[] file_entries bigint[] rev_entries bigint[] directory_entry_dir id bigserial target sha1_git name unix_path perms file_perms directory_entry_file id bigserial target sha1_git name unix_path perms file_perms directory_entry_rev id bigserial target sha1_git name unix_path perms file_perms skipped_content sha1 sha1 sha1_gitsha1_git length bigint revision id sha1_git date timestamp committer_date timestamp directory sha1_git message bytea author bigint committer bigint origin id bigserial type text url text origin_visit origin bigint visit bigint date timestamp snapshot_idbigint snapshot object_id bigserial id sha1_git person id bigserial release id sha1_git target sha1_git date timestamp name bytea comment bytea author bigint revision_history id sha1_git parent_id sha1_git parent_rankinteger snapshot_branch object_id bigserial name bytea target bytea target_type snapshot_target snapshot_branches snapshot_id bigint branch_id bigint
Figure 3: Simplified schema of the Software Heritage Graph Dataset and the number of artifacts in it
Appendix D
SAMPLE SQL QUERIES
To further illustrate the dataset’s affordances and as motivating examples regarding the research possibilities it opens, below are some sample sql queries that can be executed with the dataset on aws Athena.
Listing 1: Most frequent file name
S E L E C T F R O M _ U T F 8(name , '?') AS name , COUNT(D I S T I N C T target ) AS cnt FROM directory_entry_file GROUP BY name ORDER BY cnt DESC LIMIT 1;
Listing 1 shows a simple query that finds the most frequent file name across all the revisions. The result, obtained by scanning 151gb in 3′40′′, is index.html, which occurs in the dataset 182
million times.
Listing 2: Most common commit operations
S E L E C T COUNT(*) AS c, word FROM (S E LE C T LOWER(R E G E X P _ E X T R A C T(F R O M _ U T F 8( message ), '^\w+')) AS word FROM revision ) WHERE word != '' GROUP BY word
ORDER BY COUNT(*) DESC LIMIT 20;
As an example of a query useful in software evolution research, consider the Listing 2. It is based on the convention dictating that commit messages should start with a summary expressed in the imperative mood [13, 3.3.2.1]. Based on that idea, the query uses a regular expression to extract the first word of each commit message and then tallies words by frequency. By scanning 37 gb in 30′′
it gives us that commits concern the following common actions
Listing 3: Ratio of commits performed during each year’s weekends
WITH revision_date AS
(S E L E C T FROM_UNIXTIME (date / 1000000) AS date FROM revision )
S E L E C T yearly_rev.year AS year,
CAST( yearly_weekend_rev.number AS D O U B L E)
/ yearly_rev.number * 100.0 AS weekend_pc FROM
(S E L E C T YEAR(date) AS year, COUNT(*) AS n u m b e r FROM revision_date
WHERE YEAR(date) B E T W E E N 1971 AND 2018
GROUP BY YEAR(date) ) AS yearly_rev
JOIN
(S E L E C T YEAR(date) AS year, COUNT(*) AS n u m b e r FROM revision_date
WHERE D A Y _ O F _ W E E K(date) >= 6
AND YEAR(date) B E T W E E N 1971 AND 2018
GROUP BY YEAR(date) ) AS yearly_weekend_rev
ON yearly_rev.year = yearly_weekend_rev.year
ORDER BY year DESC;
ordered by descending order of frequency: add, fix, update, remove, merge, initial, create.
sql queries can also be used to express more complex tasks. Con-sider the research hypothesis that weekend work on open source projects is decreasing over the years as evermore development work is done by companies rather than volunteers. The corresponding data can be obtained by finding the ratio between revisions com-mitted on the weekends of each year and the total number of that year’s revisions (see Listing 3). The results, obtained by scanning 14 gb in 7′′are inconclusive, and point to the need for further
analysis.
Listing 4: Average number of a revision’s parents
S E L E C T AVG( fork_size )
FROM (S E L E C T COUNT(*) AS fork_size
FROM revision_history
MSR ’20, October 5–6, 2020, Seoul, Republic of Korea Antoine Pietri, Diomidis Spinellis, and Stefano Zacchiroli
Listing 5: Average size of the most popular file types
S E L E C T suffix ,
ROUND (COUNT(*) * 100 / 1e6) AS Million_files , ROUND (AVG( length ) / 1024) AS Average_k_length
FROM
(S E LE C T length , suffix
FROM
-- File length in joinable form
(S EL E C T TO_BASE64 ( sha1_git ) AS sha1_git64 , length FROM content ) AS content_length
JOIN
-- Sample of files with popular suffixes
(S E LE C T target64 , file_suffix_sample.suffix AS suffix FROM
-- Popular suffixes
(S EL E C T suffix FROM (
S EL E C T R E G E X P _ E X T R A C T(F R O M _ U T F 8(name),
'\.[^.]+ $') AS suffix
FROM directory_entry_file ) AS file_suffix
GROUP BY suffix
ORDER BY COUNT(*) DESC LIMIT 20 ) AS pop_suffix
JOIN
-- Sample of files and suffixes
(S EL E C T TO_BASE64 ( target ) AS target64 ,
R E G E X P _ E X T R A C T(F R O M _ U T F 8(name),
'\.[^.]+ $') AS suffix
FROM directory_entry_file TABLESAMPLE BERNOULLI (1))
AS file_suffix_sample
ON file_suffix_sample.suffix = pop_suffix.suffix )
AS pop_suffix_sample
ON pop_suffix_sample.target64 = content_length.sha1_git64 )
GROUP BY suffix
ORDER BY AVG( length ) DESC;
The provided dataset forms a graph, which can be difficult query with sql. Therefore, questions associated with the graph’s charac-teristics, such as closeness, distance, and centrality, will require the use of other methods, like Spark (see Section E). Yet, interesting metrics can be readily obtained by limiting scans to specific cases, such as merge commits. As an example, Listing 4 calculates the average number of parents of each revision (1.088, after scanning 23 gb in 22′′) by grouping revisions by their parent identifier. Such
queries can be used to examine in depth the characteristics of merge operations.
Although the performance of Athena can be impressive, there are cases where the available memory resources will be exhausted causing an expensive query to fail. This typically happens when joining two equally large tables consisting of hundreds of mil-lions of records. This restriction can be overcome by sampling the corresponding tables. Listing 5 demonstrates such a case. The objective here is to determine the modularity at the level of files among diverse programming languages, by examining the size of popular file types. The query joins two 5 billion row tables: the file names and the content metadata. To reduce the number of joined rows a 1% sample of the rows is processed, thus scan-ning 317 gb in 1′20′′. The order of the resulting language files
(JavaScript>C>C++>Python>php>C#> Ruby) hints that, with the exception of JavaScript, languages offering more abstraction facili-ties are associated with smaller source code files.
Appendix E
SPARK USAGE
For a more fine-grained control of the computing resources, it is also possible to use the dataset on Spark, through a local install or using the public dataset on Azure Databricks.
Once the tables are loaded in Spark, the query in Listing 6 can be used to generate an outdegree distribution of the directories.
Listing 6: Outdegree distribution of directories
%sql
s e l e c t degree , count(*) from (
s e l e c t source , count(*) as degree from ( s e l e c t hex( source ) as source ,
hex( target ) as dest from ( s e l e c t id as source ,
explode ( dir_entries ) as dir_entry
from directory )
inner join directory_entry_file
on directory_entry_file.id = dir_entry ) group by source ) group by degree order by degree
To analyze the graph structure, the GraphFrames library [10] can also be used to perform common operations on the graph. Listing 7 demonstrates how one can load the edges and nodes of the revision tables as a GraphFrame object, then compute the distribution of the connected component sizes in this graph.
Listing 7: Connected components of the revision graph
from graphframes i m p o r t GraphFrame
revision_nodes = spark .sql(" SELECT id FROM revision ")
revision_edges = spark .sql(" SELECT id as src , parent_id as dst " " FROM revision_history ")
revision_graph = GraphFrame ( revision_nodes , revision_edges ) revision_cc = revision_graph . connectedComponents () distribution = ( revision_cc . groupby (['component ']). count ()
. withColumnRenamed ('count ', 'component_size ') . groupby (['component_size ']). count ()) display ( distribution )
By allowing users to choose the amount of resources in the cluster, Spark lifts the constraints imposed by limits in Athena, such as timeouts and limited scale-out factor. This is important for computationally intensive experiments or very large join operations, which can only be achieved through sampling in Athena.
Spark is also more flexible in terms of the computations it can perform, thanks to User-Defined Functions [4] that can be used to specify arbitrary operations to be performed on the rows, which isn’t possible with Athena.
Appendix F
DATA SAMPLE
A sample of the data as well as instructions to run live queries on the dataset using Amazon Athena can be found at: https://annex. softwareheritage.org/public/dataset/graph/2018-09-25/
REFERENCES
[1] 2019. Amazon Athena. https://aws.amazon.com/athena/. [2] 2019. Apache Parquet. https://parquet.apache.org.
[3] 2019. Azure Databricks. https://azure.microsoft.com/en-in/services/databricks/. [4] 2019. User-Defined Functions (UDFs) · The Internals of Spark SQL. https:
//jaceklaskowski.gitbooks.io/mastering-spark-sql/spark-sql-udfs.html. [5] Pietro Abate, Roberto Di Cosmo, Louis Gesbert, Fabrice Le Fessant, Ralf Treinen,
and Stefano Zacchiroli. 2015. Mining Component Repositories for Installability Issues. In 12th IEEE/ACM Working Conference on Mining Software Repositories, MSR 2015, Florence, Italy, May 16-17, 2015, Massimiliano Di Penta, Martin Pinzger, and Romain Robbes (Eds.). IEEE Computer Society, 24–33. https://doi.org/10. 1109/MSR.2015.10
[6] Jean-François Abramatic, Roberto Di Cosmo, and Stefano Zacchiroli. 2018. Build-ing the Universal Archive of Source Code. Commun. ACM 61, 10 (October 2018), 29–31. https://doi.org/10.1145/3183558
[7] Uri Alon, Meital Zilberstein, Omer Levy, and Eran Yahav. 2019. Code2Vec: Learning Distributed Representations of Code. Proc. ACM Program. Lang. 3, POPL, Article 40 (Jan. 2019), 29 pages. https://doi.org/10.1145/3290353 [8] Paolo Boldi, Marco Rosa, Massimo Santini, and Sebastiano Vigna. 2011. Layered
Label Propagation: A MultiResolution Coordinate-Free Ordering for Compressing Social Networks. In Proceedings of the 20th international conference on World Wide Web, Sadagopan Srinivasan, Krithi Ramamritham, Arun Kumar, M. P. Ravindra, Elisa Bertino, and Ravi Kumar (Eds.). ACM Press, 587–596.
[9] Paolo Boldi and Sebastiano Vigna. 2004. The WebGraph Framework I: Com-pression Techniques. In Proc. of the Thirteenth International World Wide Web Conference (WWW 2004). ACM Press, Manhattan, USA, 595–601.
[10] Ankur Dave, Alekh Jindal, Li Erran Li, Reynold Xin, Joseph Gonzalez, and Matei Zaharia. 2016. Graphframes: an integrated api for mixing graph and relational queries. In Proceedings of the Fourth International Workshop on Graph Data Man-agement Experiences and Systems. ACM, 2.
[11] Roberto Di Cosmo, Morane Gruenpeter, and Stefano Zacchiroli. 2018. Identifiers for Digital Objects: the Case of Software Source Code Preservation. In iPRES
2018: 15th International Conference on Digital Preservation.
[12] Roberto Di Cosmo and Stefano Zacchiroli. 2017. Software Heritage: Why and How to Preserve Software Source Code. In iPRES 2017: 14th International Conference on Digital Preservation.
[13] Michael Freeman. 2019. Programming Skills for Data Science: Start Writing Code to Wrangle, Analyze, and Visualize Data with R. Addison-Wesley, Boston. [14] Riivo Kikas, Georgios Gousios, Marlon Dumas, and Dietmar Pfahl. 2017.
Struc-ture and evolution of package dependency networks. In Proceedings of the 14th International Conference on Mining Software Repositories, MSR 2017, Buenos Aires, Argentina, May 20-28, 2017, Jesús M. González-Barahona, Abram Hindle, and Lin Tan (Eds.). IEEE Computer Society, 102–112. https://doi.org/10.1109/MSR.2017.55 [15] Ralph C. Merkle. 1987. A Digital Signature Based on a Conventional Encryption Function. In Advances in Cryptology - CRYPTO ’87, A Conference on the Theory and Applications of Cryptographic Techniques, Santa Barbara, California, USA, August 16-20, 1987, Proceedings (Lecture Notes in Computer Science), Carl Pomerance (Ed.), Vol. 293. Springer, 369–378. https://doi.org/10.1007/3-540-48184-2_32 [16] Antoine Pietri, Diomidis Spinellis, and Stefano Zacchiroli. 2019. The Software
Heritage Graph Dataset: Public software development under one roof. In MSR 2019: The 16th International Conference on Mining Software Repositories. IEEE, 138–142. https://doi.org/10.1109/MSR.2019.00030
[17] Diomidis Spinellis. 2005. Version control systems. IEEE Software 22, 5 (2005), 108–109.
[18] Megan Squire. 2017. The Lives and Deaths of Open Source Code Forges. In Proceedings of the 13th International Symposium on Open Collaboration, OpenSym 2017, Galway, Ireland, August 23-25, 2017, Lorraine Morgan (Ed.). ACM, 15:1–15:8. https://doi.org/10.1145/3125433.3125468
[19] Michael Stonebraker and Greg Kemnitz. 1991. The POSTGRES next generation database management system. Commun. ACM 34, 10 (1991), 78–92.
[20] Matei Zaharia, Reynold S Xin, Patrick Wendell, Tathagata Das, Michael Armbrust, Ankur Dave, Xiangrui Meng, Josh Rosen, Shivaram Venkataraman, Michael J Franklin, et al. 2016. Apache Spark: a unified engine for big data processing. Commun. ACM59, 11 (2016), 56–65.