HAL Id: hal-00002045
https://hal.archives-ouvertes.fr/hal-00002045v3
Preprint submitted on 26 Oct 2004
HAL is a multi-disciplinary open access
archive for the deposit and dissemination of
sci-entific research documents, whether they are
pub-lished or not. The documents may come from
teaching and research institutions in France or
abroad, or from public or private research centers.
L’archive ouverte pluridisciplinaire HAL, est
destinée au dépôt et à la diffusion de documents
scientifiques de niveau recherche, publiés ou non,
émanant des établissements d’enseignement et de
recherche français ou étrangers, des laboratoires
publics ou privés.
MHD-calibrated ELM model in simulations of ITER
Thawatchai Onjun, Vassili Parail, Glenn Bateman, Arnold H. Kritz, Gerrard
Corrigan, David Heading, Johnny Lönnroth, Howard R. Wilson, Alex
Dnestrovskij, Guido T. A. Huysmans, et al.
To cite this version:
Thawatchai Onjun, Vassili Parail, Glenn Bateman, Arnold H. Kritz, Gerrard Corrigan, et al..
MHD-calibrated ELM model in simulations of ITER. 2004. �hal-00002045v3�
MHD-calibrated ELM model in simulations of ITER
T. Onjun
a, V. Parail
b, G. Bateman
c, A.H. Kritz
c, G. Corrigan
b,
D. Heading
b, J. Lönnroth
d, H. R. Wilson
b, A. Dnestrovskij
e,
G.T.A. Huysmans
f, and A. Pankin
ga Sirindhorn International Institute of Technology, Klong Luang, Pathumthani 12121, Thailand
b EURATOM/UKAEA Fusion Association, Culham Science Centre, Abingdon OX14 3DB, UK
c Lehigh University Physics Department, 16 Memorial Drive East, Bethlehem, PA, USA d Association EURATOM-TEKES, Helsinki University of Technology, Finland
e Russian Science Centre Kurchatov Institute, Moscow, Russian Federation
f Association Euratom-CEA, Cadarache 13108 SAINT PAUL LEZ DURANCE, France
g SAIC, San Diego, CA 92121, USA
INTRODUCTION
Self-consistent simulations of ITER are carried out using the JETTO predictive integrated modeling code [1] in which theory motivated models are used for the H-mode pedestal and for the stability conditions that lead to the ELM crashes. Each ELM crash results in a rapid loss of particles and energy from the edge of the plasma, which can reduce the average global energy content by 10-20%. In addition, ELMs play an essen-tial role in the control of the height of the pedestal in H-mode plasmas. A stability analysis is carried out using the stability analysis codes, HELENA and MISHKA, to confirm the stability criterion used to trigger ELM crashes in the JETTO code. Possible access to second stability of the ballooning mode is investigated using the HELENA and MISHKA stability analyses. With access to second stability, the edge pressure gradient can in-crease to a higher level, which results in a higher temperature at the top of the pedestal and, consequently, bet-ter plasma performance. The issue of ELM behavior and access to second stability is important for the success of ITER.
PREDICTIONS FOR ITER
In this study, it is assumed that the ITER plasma is a type I ELMy H-mode discharge. The core trans-port is described by combining the Mixed Bohm/gyro-Bohm anomalous transtrans-port model with the NCLASS neoclassical transport model. In the pedestal region, it is assumed that all anomalous transport is completely suppressed and the ion neoclassical transport at the top of the pedestal is used to compute all channels of the transport within the pedestal. The reduction of transport within the pedestal results in a steep pressure gradient at the edge of the plasma, which, in turn, produces a large bootstrap current density in the pedestal. In the
simulation, an ELM crash is triggered by a pressure-driven ballooning mode if anywhere within the pedestal region the normalized pressure gradient exceeds the ballooning mode stability limit or by a current-driven peeling mode if the edge current density exceeds the critical edge current density of the peeling condition. Dur-ing each ELM crash in the JETTO simulations, transport within the pedestal is increased significantly, result-ing in the loss of plasma energy and particles. The transport model and instability criteria employed in this paper have been calibrated against JET H-mode experimental data [2].
Simulations are carried out for the baseline ITER parameters: major radius (6.20 m); minor radius (2.00 m); plasma current (15.0 MA); toroidal magnetic field (5.3 T); elongation at the separatrix (1.85); trian-gularity at the separatrix (0.48); electron line average density (1.05x10²⁰ m-3), and effective charge (1.4). The effects of sawtooth oscillations, which periodically reduce the central plasma profiles, are also included. For simplicity, it is assumed that the mixing radius of each sawtooth oscillation extends from the plasma center to the q = 2 radius, and that a sawtooth oscillation occurs every 10.0 s. Total plasma radiated power is assumed to be 30 MW and the radiated power density profile is taken from that for JET discharge 52009. In the JETTO simulation, it is assumed that the deuterium and tritium mix is 50:50 and that the fixed pedestal width is 6 cm.
0 2 4 6 8 0.80 0.85 0.90 0.95 1.00
ρρρρ
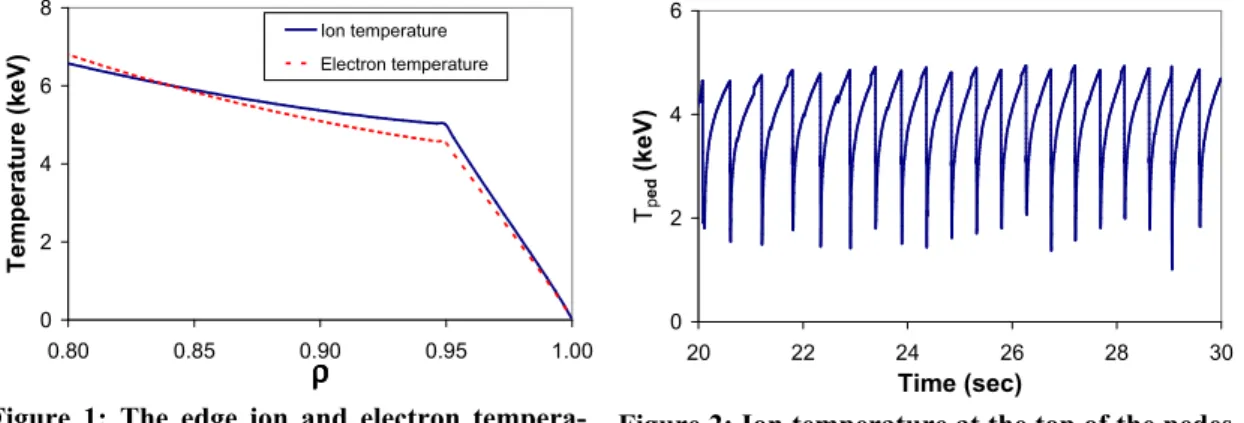
T e m p e ra tu re ( k e V ) Ion temperature Electron temperatureFigure 1: The edge ion and electron tempera-ture profiles are plotted at the time prior to an ELM crash from ρρρρ = 0.80 to the separatrix.
0 2 4 6 20 22 24 26 28 30 Time (sec) Tp e d ( k e V )
Figure 2: Ion temperature at the top of the pedes-tal is plotted as a function of time. A decrease in pedestal temperature indicates an ELM crash. It is found that the ion and electron temperature profiles are peaked at the center of the plasma while the electron density profile is relatively flat. The edge ion and electron temperature profiles prior to an ELM crash are shown in Fig. 1. The ion and electron temperatures at the top of the pedestal just prior to an ELM crash are found to be approximately 4.9 keV and 4.5 keV, respectively. It is also found in the simulations that as a result of the strong bootstrap current density within the edge barrier, the total current density has a local
peak in the pedestal region. Because of the large current density near the edge of the plasma, the magnetic shear within the pedestal decreases to a low value, which can lead to access to the region of second stability on the s-α plane. In the JETTO simulations of ITER, it is found that the ELM frequency is about 2 Hz, as shown in Fig. 2. All ELM crashes appear as compound ELM crashes in which a pressure-driven ballooning mode is unstable first and then the current-driven peeling mode becomes unstable. These compound ELM crashes have been observed in previous JETTO simulations [3]. The current-driven peeling mode becomes unstable after the first part of the ELM crash because of the reduction in the pressure gradient associated with the initial balloon-ing mode instability. The reduced pressure gradient results in a reduction of the current density required in the pedestal region for the occurrence of a current-driven peeling instability. It is also found that associated with each ELM crash, the stored energy is reduced by approximately 10%. It’s worth noting that such a high level of energy losses during each individual ELM crash can lead to a strong sputtering of target plate and, therefore, minimization of the ELM amplitude will be required in the ITER base scenario.
STABILITY ANALYSIS
In order to confirm the validity of the criteria used to trigger ELM crashes in JETTO simulation, the JETTO results are evaluated using the HELENA and MISHKA MHD stability analysis codes. The HELENA code takes as input the self-consistent equilibrium produced by the JETTO code together with the correspond-ing magnetic configuration, at a time just prior to an ELM crash. The HELENA code then refines the equilib-rium in order to provide the resolution required for the stability analysis. This refined equilibequilib-rium is then used in the HELENA code to generate a ballooning stability diagram of magnetic shear versus normalized pressure gradient (s-α). The output of HELENA is also used in the MISHKA code to evaluate the stability criteria for finite-n ballooning and low-n kink/peeling modes, for toroidal mode numbers in the range of n = 1 to n = 14.
Fig. 3 shows the stability s-α diagram computed using the HELENA and MISHKA codes for the ITER simulation. In the figure, the stability s-α diagram is plotted for the ρ = 0.94, 0.95, 0.96, 0.97, 0.98 and 0.99 flux surfaces. The circle symbol represents the location of the operational point for the pressure gradient at that flux surface. The region of instability associated with the infinite-n ideal ballooning modes is indicated with crosses and the numbers indicate the most unstable mode of finite-n ballooning and low-n kink/peeling modes at each location on the s-α plane. As shown in Fig. 3, the normalized edge pressure gradient appears to
be in the second stability region and to be limited by a finite-n ballooning mode (n = 14 toroidal mode). The access to the second stability region is probably a result of the strong shaping of the ITER plasma, particularly since the ITER design considered has a triangularity of 0.48 at the separatrix.
4 6 8 10 12 14 0 2 4 6 8 14 14 14 12 10 14 14 14 14 14 14 14 14 14 14 14 14 14 14 14 14 14 14 14 14 14 14 14 14 14 14 14 s α ρ = 0.94 4 6 8 10 12 14 0 2 4 6 8 14 14 14 14 12 10 14 14 14 14 14 14 14 14 14 14 14 14 14 14 14 14 14 14 14 14 14 s α ρ = 0.95 4 6 8 10 12 14 0 2 4 6 8 14 14 14 14 12 10 14 14 14 14 14 14 14 14 14 14 14 14 14 14 14 14 14 14 14 14 14 14 14 s α ρ = 0.96 4 6 8 10 12 14 0 2 4 6 8 14 14 14 14 12 14 14 14 14 14 14 14 14 14 14 14 14 14 14 14 14 14 14 14 14 14 14 14 14 s α ρ = 0.97 4 6 8 10 12 14 0 2 4 6 8 14 14 14 14 12 14 14 14 14 14 14 14 14 14 14 14 14 14 14 14 14 14 14 14 14 14 14 14 14 14 14 14 s α ρ = 0.98 4 6 8 10 12 14 0 2 4 6 8 12 14 14 14 14 14 10 14 14 14 14 14 14 14 10 14 14 14 14 14 14 14 14 14 14 14 14 14 14 14 4 12 14 14 14 14 3 6 14 14 4 6 3 4 s α ρ = 0.99
Figure 3: Stability results obtained using the HELENA and MISHKA stability codes are plotted on an s-αααα stability diagram at ρρρρ = 0.94, 0.95, 0.96, 0.97, 0.98 and 0.99 for ITER simulation.
CONCLUSIONS
Self-consistent core-edge simulations of ITER are carried out using the JETTO integrated modeling code. In these simulations, ELM frequency is about 2 Hz. Each ELM crash appears as a compound ELM crash, where the first part of the ELM crash is triggered by a pressure-driven ballooning mode and the rest is trig-gered by a current-driven peeling mode. It is found that the ion and electron temperatures at the top of the ped-estal prior to an ELM crash are 4.9 and 4.5 keV, respectively. The high values of the ion and electron pedped-estal temperatures mainly result from access to the second stability of ballooning modes, where the edge pressure gradient is limited by finite-n ballooning modes.
ACKNOWLEDGMENTS
This work is supported by U.S. DOE contract DE-FG02-92-ER-54141 and by the UK Department of
Trade and Industry and by EURATOM.
REFERENCES 1. G. Cennachi and A. Taroni, JET-IR (88) 1988.
2. T. Onjun, A. H. Kritz, G. Bateman, et al., Phys. Plasmas 11 (2004), 3006.