HAL Id: hal-00295356
https://hal.archives-ouvertes.fr/hal-00295356
Submitted on 3 Nov 2003
HAL is a multi-disciplinary open access
archive for the deposit and dissemination of
sci-entific research documents, whether they are
pub-lished or not. The documents may come from
teaching and research institutions in France or
abroad, or from public or private research centers.
L’archive ouverte pluridisciplinaire HAL, est
destinée au dépôt et à la diffusion de documents
scientifiques de niveau recherche, publiés ou non,
émanant des établissements d’enseignement et de
recherche français ou étrangers, des laboratoires
publics ou privés.
Characteristics and direct radiative effect of
mid-latitude continental aerosols: the ARM case
M. G. Iziomon, U. Lohmann
To cite this version:
M. G. Iziomon, U. Lohmann. Characteristics and direct radiative effect of mid-latitude continental
aerosols: the ARM case. Atmospheric Chemistry and Physics, European Geosciences Union, 2003, 3
(6), pp.1903-1917. �hal-00295356�
Atmos. Chem. Phys., 3, 1903–1917, 2003
www.atmos-chem-phys.org/acp/3/1903/
Atmospheric
Chemistry
and Physics
Characteristics and direct radiative effect of mid-latitude
continental aerosols: the ARM case
M. G. Iziomon and U. Lohmann
Department of Physics and Atmospheric Science, Dalhousie University, Halifax, Canada Received: 3 February 2003 – Published in Atmos. Chem. Phys. Discuss.: 13 May 2003 Revised: 23 October 2003 – Accepted: 23 October 2003 – Published: 3 November 2003
Abstract. A multi-year field measurement analysis of the characteristics and direct radiative effect of aerosols at the Southern Great Plains (SGP) central facility of the Atmo-spheric Radiation Measurement (ARM) Program is pre-sented. Inter-annual mean and standard deviation of sub-micrometer scattering fraction (at 550 nm) and ˚Angstr¨om exponent ˚a (450 nm, 700 nm) at the mid-latitude continen-tal site are indicative of the scattering dominance of fine mode aerosol particles, being 0.84±0.03 and 2.25±0.09, re-spectively. We attribute the diurnal variation of submicron aerosol concentration to coagulation, photochemistry and the evolution of the boundary layer. Precipitation does not seem to play a role in the observed afternoon maximum in aerosol concentration. Submicron aerosol mass at the site peaks in the summer (12.1±6.7 µg m−3), with the summer value
be-ing twice that in the winter. Of the chemically analyzed ionic components (which exclude carbonaceous aerosols), SO=4 and NH+4 constitute the dominant species at the SGP sea-sonally, contributing 23–30% and 9–12% of the submicron aerosol mass, respectively. Although a minor species, there is a notable rise in NO−3 mass fraction in winter. We con-trast the optical properties of dust and smoke haze. The sin-gle scattering albedo ω0shows the most remarkable
distinc-tion between the two aerosol constituents. We also present aircraft measurements of vertical profiles of aerosol opti-cal properties at the site. Annually, the lowest 1.2 km con-tributes 70% to the column total light scattering coefficient. Column-averaged and surface annual mean values of hemi-spheric backscatter fraction (at 550 nm), ω0(at 550 nm) and
˚a (450 nm, 700 nm) agree to within 5% in 2001. Aerosols produce a net cooling (most pronounced in the spring) at the ARM site.
Correspondence to: M. G. Iziomon
(iziomon@mathstat.dal.ca)
1 Introduction
Aerosols in the atmosphere (which include sulfate, black car-bon, organic carcar-bon, mineral dust, sea-salt, volcanic ash, pollen, nitrate and ammonium) evolve in size and composi-tion by homogenous and heterogeneous nucleacomposi-tion, conden-sation, coagulation as well as dry and wet deposition. By influencing the geochemical and hydrological cycles as well as the surface radiation budget, aerosols exhibit a significant impact on the Earth’s climate. On one hand, aerosols ab-sorb and scatter radiation (direct aerosol effect). On the other hand, they act as ice/cloud condensation nuclei and thus de-termine the initial ice/cloud droplet number concentration, cloud albedo, precipitation efficiency and cloud lifetime (in-direct aerosol effect) (Twomey, 1991; Lohmann et al., 2000; Br´eon et al., 2002).
While aerosols may produce a net radiative cooling in some regions, other regions may experience a net heating, and the long-term climatic impact of these changes are not well known (Penner et al., 1994; Haywood et al., 1999). Aerosol campaigns such as the Southern African Regional Science Initiative (SAFARI) (Le Canut et al., 1996; Andreae et al., 1996), Transport and Atmospheric Chemistry near the Equatorial Atlantic (TRACE A) (Anderson et al., 1996), Smoke, Clouds, and Radiation-Brazil (SCAR-B) (Kauf-man et al., 1998), Indian Ocean Experiment (INDOEX) (Lelieveld et al., 2001), Large-scale Biosphere-Atmosphere Experiment in Amazonian – Cooperative LBA Airborne Re-gional Experiment 98 (LBA-CLAIRE-98) (Andreae et al., 2001) have provided samples of tropical biomass burning aerosol size distributions from aircraft measurements. How-ever, aerosol type and size distributions vary considerably in space and time. Furthermore, since most aircraft aerosol measurements only cover a relatively short period, current understanding of the vertical distribution of aerosol optical properties and the extent to which surface observations rep-resent column properties is still evolving. The long-term
1904 M. G. Iziomon and U. Lohmann: Continental aerosols
22
Fig. 1: ARM map showing the Southern Great Plains Region and surrounding locations.
Fig. 1. ARM map showing the Southern Great Plains Region and
surrounding locations.
measurement of aerosol optical and chemical properties, as well as surrounding meteorological conditions provides a formidable way of characterizing aerosols and evaluating the climatic impact of aerosols. This in turn will lead to a re-duction in the high uncertainties associated with aerosols in climate forcing assessments.
The U. S. Southern Great Plains (SGP) Cloud and Ra-diation Testbed was the first and largest field measurement site established by the Atmospheric Radiation Measurement (ARM) Program for the measurement of radiation, cloud, aerosol and atmospheric properties. The SGP covers an area of approximately 142, 450 km2 in north central Oklahoma and south central Kansas (see Fig. 1). The central facility (CF) of the SGP Cloud and Radiation Testbed is located on 65 hectares of cattle pasture and wheat fields southeast of Lamont, Oklahoma (36.60◦N, 97.50◦W, 315 m asl). Sheri-dan et al. (2001) present surface aerosol measurement at the SGP CF for aerosols with aerodynamic diameter less than 10 µm. Here, we focus primarily on submicron aerosols (as they have the greatest radiative impact on climate in the vis-ible wavelengths) and address the issue of the temporal and altitudinal variability, chemical composition and net radiative impact of aerosols at the site.
We utilize a variety of ARM data products from 1997 to 2001. Relative to most aerosol measurements in literature (which are short-spanned), the length of data considered here is sufficiently long enough to provide a representative picture of continental aerosol characteristics on time scale of days to seasons. In particular, the objectives of the present study are to (i) examine the factors driving the variability of submi-cron aerosols on diurnal and seasonal time scales at the site, (ii) compare observed aerosol properties at the site with those measured at some other sites and those proposed for average continental sites, as this will aid air quality assessment, (iii) determine the extent to which surface aerosol measurements differ from column properties, (iv) examine the optical
prop-erties of dust aerosols about which there is still much uncer-tainty to date (IPCC, 2001; Sokolik et al. 2001; Korhonen et al., 2003) and contrast these properties with those of smoke aerosols previously studied (Iziomon and Lohmann, 2003), and (v) determine the sign of aerosol direct forcing at the ARM site.
2 Field measurements at the Southern Great Plains Central Facility
2.1 Aerosol measurements: optical properties and number
concentration
The Aerosol Observing System (AOS) at the SGP CF is the major ARM platform for conducting in-situ aerosol measurements at 10 m above the surface since April 1996. The NOAA Climate Monitoring and Diagnostics Labora-tory (CMDL) in Boulder Colorado operates the AOS, which measures the optical properties of ambient aerosol parti-cles obtained from the top of a ≈21.4 cm inner diame-ter stainless steel intake stack. Aerosol optical proper-ties measured include light absorption coefficient (σa),
to-tal light scattering coefficient (σs) and hemispheric
backscat-tering coefficient (σb). Measurements of the aerosol
scattering coefficient as a function of relative humidity (f (RH)=σs(RH =85%)/σs(RH =40%)) commenced at the SGP
CF in December 1998. In addition, the total number concen-tration of condensation particles (Na) with sizes from 0.01–
3.0µm, and number concentration for particles with aerody-namic diameter (Dp) ranging from 0.1–10 µm diameter (Np)
are measured.
σsand σbat three wavelengths (450, 550, and 700 nm) are
measured by a TSI nephelometer over integration angles of ∼7–170◦and 90–170◦. These measurements were corrected for the SGP to the full 0–180◦ and 90–180◦ ranges based on the ˚Angstr¨om exponent (Anderson and Ogren, 1998). σs
as a function of relative humidity at three wavelengths (450, 550, and 700 nm) is measured by a system of two TSI neph-elometers connected to a humidity scanning system. σa is
measured using a filter-based radiance research particle soot absorption photometer (PSAP), which is calibrated to esti-mate suspended-state aerosol light absorption at 550 nm us-ing an extinction cell and a nephelometer (Bond et al., 1999). Nais measured by a TSI condensation nuclei counter (CNC)
while Npis measured by an optical particle counter (OPC).
The Np used here refers to the sampled number
concentra-tion of particles over the entire OPC size range.
The aerosol sample stream is heated (by a control unit) just enough to maintain its relative humidity below 40% before it enters the sampling lines, and subsequently into the instruments. This relative humidity control minimizes the effects of changing relative humidity on the measure-ments and provides a reference point where the properties of ambient aerosols are measured. Bergin et al. (1997) and
M. G. Iziomon and U. Lohmann: Continental aerosols 1905 Peppler et al. (2000) reported that losses of ammonium
ni-trate (and less volatile species) due to evaporation under the sampling conditions used in ARM aerosol observing system are small. Size-segregated measurements of σs and σawere
made through a switch impactor system, such that only
par-ticles with aerodynamic diameter Dp smaller than 10 µm
were sampled. Except for Np and where otherwise stated,
the aerosol optical properties examined here are associated with submicron aerosols with Dp<1 µm at 550 nm. Details
on the calibration and maintenance of the aerosol instruments are available online at http://www.arm.gov/docs/instruments/ static/aos.html. We derive intensive aerosol optical quantities including the hemispheric backscatter fraction b, single scat-tering albedo ω0, ˚Angstr¨om exponent ˚a and submicrometer
scattering fraction Rspas follows:
b = σb(550 nm)/σs(550 nm) (1)
ω0=σs(550 nm)/(σs(550 nm)+σa(550 nm)) (2)
˚a = − log[σs(450 nm)/σs(700 nm)]/log(450)/(700)] (3)
Rsp = [σs(Dp<1 µm)/σs(Dp<10 µm)] (4)
In March 2000, a joint project between the ARM pro-gram and the Climate Monitoring and Diagnostics Labora-tory (CMDL) to obtain a statistically significant data set of the vertical distribution of aerosol properties commenced. The aerosol measurements are made by flying a light air-craft (Cessna C-172N) over the SGP site and utilizing an aerosol instrument package similar to the one used for sur-face measurements. The sampled air is heated to maintain a relative humidity below 40% (similar to surface measure-ments). Only particles smaller than 1 µm aerodynamic di-ameter are sampled. The aircraft flies 9 level legs (450, 610, 915, 1220, 1525, 1830, 2440, 3050, 3660 m asl) twice or thrice per week.
The CIMEL Sun Photometer CSPHOT is a multichanel automatic sun- and sky-scanning narrow field-of-view ra-diometer/sunphotometer. The primary quantities measured by the sun photometer include aerosol optical thickness τ and water vapor column abundance at predetermined discrete wavelengths in the ultraviolet, visible and near-infrared (340, 380, 440, 500, 670, 870, 940 and 1020 nm). Measurements are made during daylight hours only.
2.2 Uncertainties in aerosol measurements
In line with Anderson et al. (1999), the measurement uncer-tainty associated with the TSI 3563 nephelometer can be at-tributed to noise in the filtered air scattering coefficient, drift in the calibration, uncertainty in the instrument calibration due to Rayleigh scattering of dry air and CO2, the
trunca-tion of near forward scattered light and uncertainty in in-strument pressure and temperature in conversion of data to STP. All these sources result into a total analytical uncer-tainty of about 10% in the measured raw data (Sheridan et
al. 2001). Losses within the nephelometer itself have been found to be negligible for submicron particles but account for 5–10% uncertainty for supermicron particles (Anderson and Ogren, 1998). The uncertainties in the CNC and OPC measurements at the SGP have been described by Sheridan et al. (2001). Asphericity has little effect on particle sizing, probably less than 5%, due to wide collection angle used in the optical particle counter. The uncertainties in the PSAP have been described by Bond et al. (1999) and the appro-priate corrections have been applied to PSAP measurements made at SGP. Uncertainties in the measurements are associ-ated with the variability of each PSAP unit and from instru-ment noise. Bond et al. (1999) found instruinstru-mental variabil-ity to be 6% of the measured absorption. The accuracy in CSPHOT aerosol optical thickness measurements is ±0.01 at one air mass.
2.3 Aerosol chemical composition and other
supplemen-tary data
In early 2000, an aerosol filter sampling system was added to the AOS to collect particles for subsequent physical and chemical analysis. Submicron samples (Dp<1.0 µm) at the
SGP site are collected on a daily basis and supermicron sam-ples (1.0 µm<Dp<10 µm) are collected on a weekly basis.
Here we focus on submicron samples. The submicron – su-permicron split is made with a Berner-type cascade impactor. The relative humidity of the sampled aerosol is less than 40%. Samples are analyzed by ion chromatography for ma-jor cations (Na+, NH+4, K+, Mg+2, and Ca+2) and anions (Cl−, NO−3, SO=4). All ion and mass concentrations are given in µg m−3 (see Quinn et al. (2000) for more details on the sampling methods and measurement uncertainties). Sea salt concentrations in this study are calculated as
sea salt (µg m−3)=Cl−(µg m−3) +Na+(µg m−3) ×1.47 (5) where 1.47 is the seawater ratio of (Na+ + K+ + Mg+2 + Ca+2+ SO=4 + HCO−3)/Na+(Holland, 1978). According to Quinn et al. (2002), we do not include Cl− in excess of the Cl−to Na+seawater ratio of 1.8 in the sea salt mass. Here the residual mass concentration (mass of the chemically un-analyzed species) is calculated as the difference between the gravimetrically determined aerosol mass and the mass of the analyzed ionic components. We do not estimate water mass. Mass fractions of the submicron ionic chemical components were calculated as the ratio of the mass concentration of the component to the gravimetric mass.
The ARM Microwave Water Radiometer (MWR) mea-sures column-integrated amounts of water vapor and cloud liquid water. Liquid water path (LW P ) recorded during pe-riods of precipitation are excluded from our analysis. The Atmospheric Emitted Radiance Interferometer (AERI) mea-sures the absolute infrared spectral radiance of the sky di-rectly above the instrument every 10 minutes. Among oth-ers, the AERI data can be used for evaluating line-by-line
1906 M. G. Iziomon and U. Lohmann: Continental aerosols
23
Fig. 2: Monthly mean values of air temperature (Ta), liquid water path (LWP), precipitable
water (PW), cloud cover fraction (Ac), wind speed (v) and precipitation (Pp) at the ARM SGP
site.
Fig. 2. Monthly mean values of air temperature (Ta), liquid water path (LW P ), precipitable water (P W ), cloud cover fraction (Ac), wind speed (ν) and precipitation (Pp) at the ARM SGP site.
radiative transport codes and calculating vertical atmospheric profiles of temperature and water vapor. The ARM surface meteorology observation system provides measurements of meteorological variables including air temperature Ta,
rela-tive humidity RH, wind speed ν, wind direction and precipi-tation Pp. Shortwave radiation at the SGP CF is measured by
the ARM solar infrared radiation station. The raw sampling interval of most ARM surface data is 1 min. We utilize ARM data for a period ranging from 1997 to 2001.
In order to complement field measurements, weather con-ditions at the SGP central facility are recorded hourly by trained operators throughout periods of intensive operation and usually from 04:30 to 08:30 and from 10:30 to 22:30 TC on workdays. Recorded weather conditions by ARM trained observers include cloud cover fraction (Ac) as well as the
presence of smoke, dust and fog in the atmosphere. We ob-tained ARM Metadata weather records for the period 1997 to 2001.
3 Meteorological conditions at the Southern Great Plains Central Facility
In view of its mid-latitude location and continental position, SGP records a wide range of aerosols, thermodynamic, mois-ture and cloud fields. The site is influenced by continental polar air from source regions in Canada, pacific maritime
polar air that is greatly modified in traversing the mountain-ous western United States, and maritime tropical air passing over the warm waters of the Gulf of Mexico. The SGP lo-cale is representative of the broad region of plains between the Rocky Mountains and the Mississippi basin. It is be-ing impacted from time to time by large point source emis-sions (particularly oil refineries and power plants) as well as local aerosol sources including automobile and biomass burning aerosols. Figure 2 presents the annual variation of air temperature, precipitable water vapor, liquid water path, cloud fraction, wind speed and precipitation at the
ARM site. The bottom and top bars in Fig. 2 represent
the lowest and highest monthly mean from 1998 to 2001 while the data points represent the overall monthly mean over this period. Surface air temperature and precipitable water (P W ) exhibit a typical mid-latitude annual variation, with mean values ranging, respectively, between 2–6◦C and
1.1–1.2 cm in winter, and 24–29◦C and 3.6–4.2 cm in sum-mer. LW P , cloud fraction, wind speed and precipitation are relatively small in late summer (August). The annual mean of Ta, P W , LW P , Ac, ν, Pp at the site are 15.2±0.4◦C,
2.3±0.1 cm, 54.6±4.1 g m−2, 45±4%, 5.6±0.1 m s−1 and 2.33±0.63 mm d−1, respectively. The most dominant wind direction at the ARM site is associated with a southerly flow.
M. G. Iziomon and U. Lohmann: Continental aerosols 1907 24
Fig. 3 Mean diurnal variation of (a) submicron aerosol number concentration Na for all-sky (denoted by “all”) conditions as well as clear and cloud sky conditions (b) wind speed v (c) submicron number concentration for v < 5 m s-1 and v > 5 m s-1 (d) precipitation frequency (fpp) (e) precipitation amount Pp (f) submicron number concentration for rainy and non-rainy periods. The dash-dot line at 1800 UTC highlights local standard time noon.
Fig. 3. Mean diurnal variation of (a) submicron aerosol number concentration Nafor all-sky (denoted by “all”) conditions as well as clear and cloud sky conditions (b) wind speed ν (c) submicron number concentration for ν<5 m s−1and ν>5 m s−1(d) precipitation frequency
(fpp) (e) precipitation amount Pp(f) submicron number concentration for rainy and non-rainy periods. The dash-dot line at 18:00 UTC highlights local standard time noon.
4 Results and Discussion
4.1 Diurnal variation of submicron aerosol number concen-tration
An analysis of the diurnal variation of submicron aerosol number concentration is capable of providing an insight into processes responsible for new particle formation. Figure 3a presents the diurnal variation of submicron aerosol number concentration (averaged from 1997 to 2001) at the SGP CF under all sky conditions (denoted by “all”). Nashows a
pro-nounced diurnal cycle, with the lowest hourly Narecorded in
the morning and peak values between 19:00 and 21:00 UTC (13:00 and 15:00 Local Standard Time). It is obvious from Fig. 3b that wind speeds are high in the afternoon, but much lower in the night and early morning hours when the mixing height gets lower, accompanied by a near-surface tempera-ture inversion (up to about 215 m above the ground in May 1999, see Fig. 4). To further investigate the effect of wind speed on the diurnal cycle of Na, we grouped the wind speed
data into low (ν<5 ms−1) and moderate/high wind speeds (ν>5 ms−1). Figure 3c presents the mean diurnal course of aerosol concentration for the two classes of wind speeds. As shown in Fig. 3c, one could expect an increase (build-up) of aerosol concentration with low wind speed, (particularly
when stagnation occurs and atmospheric dilution is mini-mal). Since this is not the case in Fig. 3a, it is very likely that the morning and night minimum in Na is partly the
re-sult of coagulation as well as highly reduced sources and OH production when there is little or no solar insolation.
The afternoon diurnal maximum of Na at the SGP CF is
suggestive of a photochemically-driven aerosol production. To affirm this, we show also in Fig. 3a the mean diurnal cycle of Na for clear skies (with Ac=0%) and cloudy skies (with Ac>30%). It is notable from Fig. 3a that the highest
val-ues of Naare recorded under clear skies (relative to cloudy
sky and all-sky conditions) with increasing difference in the afternoon hours. Since the observed diurnal cycle of Na is
mostly driven by that of clear days, photochemistry must be the reason for the afternoon peak. As stated in Sect. 3, the SGP site is impacted by SO2 emissions from local plants.
The onset of solar radiation in the morning triggers the photo-chemical production of low vapor pressure products that ini-tiates the nucleation and growth of new aerosol particles (We-ber et al., 1997). However, the condensation nuclei counter only detects these particles, whose formation also depends on the concentration of precursor gases and ions, later when they exceed the lower size detection limit (Weingartner et al., 1999).
1908 M. G. Iziomon and U. Lohmann: Continental aerosols
25
Fig. 4: Mean boundary layer temperature profile in May 1999 (from AERI) at the ARM site. Dotted line shows the extent of the temperature inversion (about 215 m above the ground) at 0600 and 1200 UTC.
Fig. 4. Mean boundary layer temperature profile in May 1999 (from
AERI) at the ARM site. Dotted line shows the extent of the tem-perature inversion (about 215 m above the ground) at 06:00 and 12:00 UTC.
Another possible explanation for the morning minimum and afternoon maximum of Na could lie in the relative
fre-quency and amount of precipitation. We observe a much lower frequency fpp and amount Pp of precipitation in the
afternoon (see Fig. 3d and e), which would mean less scav-enging of aerosol particles for this period (relative to the morning). As a next step, we examined separately the diurnal cycle in aerosol concentration for rainy and non-rainy peri-ods (Fig. 3e). Although the diurnal cycle of aerosol concen-trations is well preserved for the non-rainy days (which also record much higher aerosol concentration), Nahardly shows
any diurnal cycle on rainy days. Given that the diurnal cycle of Nais weak on cloudy days and even weaker on rainy days,
there does not seem to be any correlation between precipita-tion occurrence (as well as amount) and the aerosol number density on rainy days. In effect, precipitation does not play a role in the afternoon peak in Na. However, Figs. 3d–f clearly
portray the aerosol scavenging effects of precipitation. In addition, since rainy periods (most frequent in the morning) are normally overcast, there are no photochemical sources at these times. There is also a delay between the end of precip-itation and new aerosol formation (see also Fig. 3a).
4.2 Seasonal variation of aerosol number concentration,
chemical and optical properties
In order to estimate the seasonal local radiative effects of aerosols, several aerosol optical properties must be measured or estimated. Figure 5 presents the seasonal mean and stan-dard deviation of OPC measured particle concentration, sub-micron total light scattering coefficient, (at 550 nm wave-length), submicron single scattering coefficient (at 550 nm), submicron ˚Angstr¨om exponent ˚a (450, 700 nm) and
sub-micrometer scattering fraction Rsp (550 nm) averaged from
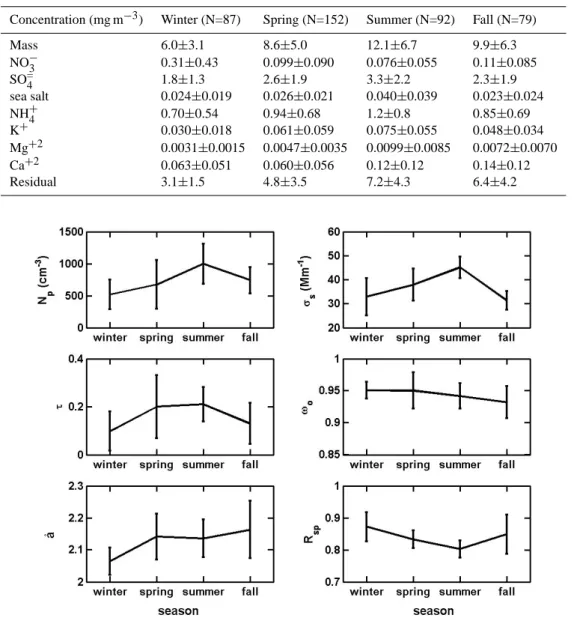
1997 to 2001. Also presented in Fig. 5 is the correspond-ing seasonal mean and standard deviation of the daytime CSPHOT aerosol optical depth (at 500 nm). Table 1 summa-rizes the seasonal mean and standard deviation of submicron aerosol mass and ionic chemical component concentrations at SGP from February 2000 to December 2001, while Fig. 6 presents the mean seasonal variation of mass fraction of ionic components. Meteorological seasons are implied here (i.e. winter: December to February, spring: March to May, sum-mer: June to August and fall: September to November). We first examine submicron aerosol composition at the ARM site and then use this as a basis for analyzing the observed sea-sonal aerosol number concentration and optical properties at the site.
The gravimetrically-measured submicron aerosol mass at the ARM site show a strong seasonality, exhibiting a
mini-mum in winter (6.0±3.1 µg m−3) and a maximum in
sum-mer (12.1±6.7 µg m−3). Of the chemically analyzed ionic components, SO=4 and NH+4 constitute the dominant species at the SGP, contributing 23–30% and 9–12% of the sub-micron aerosol mass, respectively, seasonally (see Fig. 6). SO=4 and NH+4 ionic components follow similar annual cy-cles, recording their peak concentrations in the summer and lowest concentrations in winter (Table 1). Fossil fuel com-bustion is a major anthropogenic source of SO=4. SO2
emis-sions from local power plants, oil refineries and automobiles are major sources of anthropogenic sulfate aerosols over the SGP. Reaction of gas phase NH3with acidic sulfate aerosols
or other particulate anionic species gives rise to particulate NH+4. Natural sources of NH3include emissions from soils
and vegetation while anthropogenic sources include fertil-izer application and production, biomass burning and animal dung (Dentener and Crutzen, 1994; Prospero et al., 1996). As noted in Sect. 1, the SGP site is located on a cattle pas-ture and wheat fields. It is therefore expected that significant amounts of NH+4 aerosols will be sampled particularly in the spring and summer, when agricultural practices are intense.
K+ is a useful tracer of biomass burning aerosols (Gau-dichet et al., 1995). Similar to SO=4 and NH+4, submicron
K+ concentration are highest in the summer followed by
spring. Lowest K+ concentrations are recorded in winter. Although local field burning occurs in the vicinity of the SGP many times in the year, these activities are most pronounced in May, June and July (Peppler et al., 2000; Iziomon and Lohmann, 2003). Wind blown soil dust contains a signifi-cant amount of Ca, Mg, Al, Fe, Ti and Si (Barie and Barrie 1990, Malm et al. 1996). Higher submicron concentrations of Mg+2and Ca+2are measured at the ARM site in summer and fall. Windblown dust from farm fields are commonly observed around the ARM site (see Sect. 4.5). These dust episodes are prominent in the summer and fall due to wind associated with convective activity and frontal passage. High amounts of airborne dust in summer over the Southeast U.S. have been reported by Prospero (1999).
M. G. Iziomon and U. Lohmann: Continental aerosols 1909
Table 1. Seasonal mean and standard deviation of submicron aerosol mass and ionic chemical component concentrations at SGP from
February 2000 to December 2001. N refers to sample size for each season 2000-2001
Concentration (mg m−3) Winter (N=87) Spring (N=152) Summer (N=92) Fall (N=79)
Mass 6.0±3.1 8.6±5.0 12.1±6.7 9.9±6.3 NO−3 0.31±0.43 0.099±0.090 0.076±0.055 0.11±0.085 SO=4 1.8±1.3 2.6±1.9 3.3±2.2 2.3±1.9 sea salt 0.024±0.019 0.026±0.021 0.040±0.039 0.023±0.024 NH+4 0.70±0.54 0.94±0.68 1.2±0.8 0.85±0.69 K+ 0.030±0.018 0.061±0.059 0.075±0.055 0.048±0.034 Mg+2 0.0031±0.0015 0.0047±0.0035 0.0099±0.0085 0.0072±0.0070 Ca+2 0.063±0.051 0.060±0.056 0.12±0.12 0.14±0.12 Residual 3.1±1.5 4.8±3.5 7.2±4.3 6.4±4.2 26
Fig. 5: Seasonal mean and standard deviation of OPC-measured particle number concentration (Np), submicron total light scattering coefficient (σs) at 550 nm, daytime optical depth (τ) at
500 nm, submicron single scattering coefficient (ω0) at 550 nm, submicron Ångström
exponent (å) (450, 700 nm) and submicrometer scattering fraction (Rsp) at 550 nm.
Fig. 5. Seasonal mean and standard deviation of OPC-measured particle number concentration (Np), submicron total light scattering co-efficient (σs) at 550 nm, daytime optical depth (τ ) at 500 nm, submicron single scattering coefficient (ω0) at 550 nm, submicron ˚Angstr¨om
exponent ( ˚a) (450, 700 nm) and submicrometer scattering fraction (Rsp) at 550 nm.
In contrast to SO=4and NH+4 (as well as most of the other ionic components), NO−3 exhibits low concentrations in the summer (possibly because it is semi-volatile and thus the higher the temperature, the more NO−3 goes back in the gas phase). There is, however, a notable rise in NO−3 mass frac-tion during winter (being 5.2%) relative to other seasons, which suggests that a significant amount of NO−3 exist in the condensed phase at low temperature. Sea salt aerosols are highest in summer. Carbonaceous aerosols are most likely a large component of the residual mass (particularly in the summer). Organic carbon is the largest single aerosol
com-ponent in the Central (44%) and Northern Rockies (57%), Northern Great Plains (34%) and Great Basin (40%) of the
United States (Malm et al. 1994). Moreover,
carbona-ceous aerosols constitute about 50% of the dry aerosol mass sampled during the Tropospheric Aerosol Radiative Forcing Observational Experiment (TARFOX) off the mid-Atlantic coast of the United States in July, 1996 (Hegg et al., 1997) and a major percentage of the aerosols sampled during the U.S. New England Air Quality Study (NEAQS) in the sum-mer of 2002 (Quinn and Bates, 2003).
1910 M. G. Iziomon and U. Lohmann: Continental aerosols
27
Fig. 6: Seasonal variation of mass fraction of ionic components at the SGP site.
Fig. 6. Seasonal variation of mass fraction of ionic components at the SGP site. 28
Fig. 7: Annual (daytime) CSPHOT aerosol optical depth variation with wavelength.
Fig. 7. Annual (daytime) CSPHOT aerosol optical depth variation
with wavelength.
In view of the foregoing, the observed high mean val-ues of σs and Np in the summer (relative to winter) at this
mid-latitude site could be the consequence of increased SO2
emissions (from local power plants, oil refineries and auto-mobile), ammonium aerosols (from cattle pasture and wheat fields at the SGP) as well as additional sources including lo-cal agricultural field burning activities, smoke from remote forest fires, wind-enhanced dust episodes and biogenics. As indicated by the seasonal variation of τ , there is a substantial extinction in spring and summer. The low ω0recorded in fall
coincides with a high ˚a. In fall, there is a clear increase in small absorbing particles, which are not contributing to scat-tering. In summer, the low Rspsuggests that dust contributes
more to scattering than in autumn. We shall examine dust aerosols at the SGP in more details in Sects. 4.5 and 4.7. 4.3 Annual mean aerosol characteristics
This section complements the preceding discussion on sea-sonal aerosol variation at the ARM site by providing rep-resentative annual mean quantities of aerosol number
con-centration, optical and chemical properties. Of the
an-alyzed ionic mass (2000–2001), SO=4 and NH+4 consti-tute the major chemical species, with a mass fraction of
28% and 10%, respectively, annually. Over a five-year
period (1997–2001), annual means and standard devia-tions of total submicron aerosol concentration for particles with Dp<1 µm, OPC-measured particle concentration for
aerosols with Dp<10 µm, submicron light absorption
coef-ficient (at 550 nm) and submicron single scattering albedo (at 550 nm) amount to 5306±392 cm−3, 654±290 cm−3,
2.0±0.7 Mm−1and 0.94±0.02 at the SGP CF, respectively,
while those of submicron total scattering coefficient, submi-cron hemispheric backscatter fraction, submicrometer scat-tering fraction (all at 550 nm) and submicron ˚Angstr¨om
exponent (450 nm, 700 nm) are 36±2 Mm−1, 0.12±0.01,
0.84±0.03, 2.25±0.09, respectively. The order of magni-tude of b, Rsp and ˚a are indicative of the scattering
domi-nance of fine mode aerosol particles at the ARM site. The annual mean of the hygroscopic growth factor (f (RH)) for submicron aerosols at the SGP from 1999 to 2001 amounts to 1.84±0.10.
Based on the Koshmeider equation (Husar et al., 1979; Schichtel, 2001), annual mean visibility Vs at the ARM site
M. G. Iziomon and U. Lohmann: Continental aerosols 1911
Table 2. Mean and standard deviation of aerosol light absorbing coefficient σa, total light scattering coefficient σs, hemispheric backscatter-ing fraction b, ˚Angstr¨om exponent ˚a, single scattering albedo ω0and hygroscopic growth factor f (RH) (at 550 nm) for June and July at the
ARM site with those measured over the same period (except for Linan, China) during some major aerosol field campaigns (see text for more details) Location σa(Mm−1) σs(Mm−1) b ˚a ω0 f(RH) SGP CFa 2.8±1.2 41±6 0.11 2.1±0.1 0.94±0.2 1.8±0.2 Sagresb – 43±19 0.12±0.02 2.5±0.1 – 1.5±0.1 Linanc 23±14 353±202 – – 0.93±0.04 1.7–2.0 Beijingd 83±40 488±370 – – 0.81±0.08 –
apresent study;bCarrico et al., 2000;cXu et al. (2002);dBergin et al. (2001)
from 1997 to 2001 is 38±2 km. Furthermore, the annual mean and standard deviation of daytime CSPHOT aerosol optical thickness (500 nm) and ˚Angstr¨om turbidity coeffi-cient (κ=τ λ˚afrom Fig. 7) are 0.16±0.07 and 0.064±0.025, respectively. Both Vs and κ at the ARM site are
consis-tent with those proposed for average continental aerosols (i.e. Vs≈35 km and κ≈0.1) ( ˚Angstr¨om, 1961; Hess et al., 1998).
4.4 Comparison of aerosol optical properties
measure-ments at the SGP with those at selected continental sites during major aerosol field campaigns
To further put the observed aerosol optical properties at the SGP CF into perspective, Table 2 compares the mean σa, σs, b, ˚a, ω0and f (RH) for June and July at the ARM site with
those measured in China and Portugal. The gaps in Table 2 imply missing data. Aerosol measurements at Sagres, Por-tugal, were carried out from 15 June to 25 July 1997 dur-ing the North Atlantic Aerosol Characterization Experiment (ACE-2) (Carrico et al., 2000). Bergin et al. (2001) and Xu et al. (2002) measured aerosol optical properties in June 1999 at Beijing, China (a large urban area) and in November 1999 at Linan, China (a rural location), respectively.
σsat the SGP is slightly lower than that recorded at Sagres,
which receives anthropogenically perturbed air masses from Europe. As indicated by its slightly higher ˚a, it follows that the aerosols at Sagres are finer and that the location is more anthropogenically influenced than the ARM site. σa and σs at the SGP are much lower than those recorded
in Linan and Beijing, signifying a major anthropogenic in-fluence at the latter locations. In particular, the extremely high absorption coefficient recorded in Beijing is attributed mainly to emissions of elemental carbon from diesel en-gines (Xu et al., 2002). This is also evident by the very low ω0 value of 0.81 in Beijing relative to a mean value
of 0.94 observed at the ARM site. Low ω0 values have
also been recorded at other locations with high level of in-dustrial pollution/biomass burning, including Mexico city (ω0=0.90), Maldives (INDOEX; aerosol transported largely
from the Indian subcontinent) (ω0=0.89), Zambia (African
29
Fig. 8: Hourly values of å (450, 700 nm) from 4 to 22 UTC on October 29, 1999 (heavy dust haze was visible over the SGP from about 15 to 17 UTC).
Fig. 8. Hourly values of ˚a (450, 700 nm) from 4 to 22 UTC on 29
October 1999 (heavy dust haze was visible over the SGP from about 15 to 17 UTC).
Savanna) (ω0=0.88), Athens, Greece (ω0=0.88) and Tokyo,
Japan (ω0=0.77) (Scheff and Valiozis, 1990; Horvath, 1993;
Vasilyev et al., 1995; Baumgardner et al., 2000; Eck et al., 2001; Dubovik et al. 2002). For Mexico city, with a very turbid atmosphere, Vasilyev et al. (1995) report κ from 0.27–
0.37 and Vs from 7–13 km in the spring-summer of 1992.
Thus, as with Vs and κ (see Sect. 4.3 above), aerosol single
scattering albedo at the ARM site could be considered inter-mediate relative to other continental sites. This claim is fur-ther supported by the lower hemispheric backscatter fraction and higher hygroscopic growth factor of aerosols at the ARM site relative to other sites (Table 2). Pueschel et al. (1969) re-port that organic compounds, possibly of anthropogenic ori-gin, might cause the inhibition of particle growth.
4.5 Dust aerosols
In this section, we examine the optical properties of dust-dominated aerosols. Dust observations were made by trained ARM personnel and logged in the ARM Meta-data weather
system. Dust plumes over the SGP originate from
sur-rounding agricultural fields and from long-range transport,
1912 M. G. Iziomon and U. Lohmann: Continental aerosols
Table 3. Inter-seasonal mean of hourly single scattering albedo ω0(at 550 nm), ˚Angstr¨om exponent ˚a (450 nm, 750 nm), and hygroscopic
growth factor f (RH) (at 550 nm) for smoke and dust episodes at the ARM site
Optical Properties Dust Smoke
Dp<1 µm Dp<10 µm Dp<1 µm Dp<10 µm
ω0 0.95±0.02 0.96±0.03 0.91±0.03 0.92±0.03
˚a 1.9±0.3 1.6±0.2 2.0±0.1 1.6±0.1
f(RH) 1.5±0.6 1.4±0.6 1.6±0.2 1.7±0.3
enhanced by gusty winds. As an example, Fig. 8 presents hourly values of ˚a (450, 700 nm) from 4 to 22 UTC on 29 October 1999, with heavy dust from farm fields very visi-ble over the SGP from about 15 to 17 UTC. Note the sharp decline in ˚a during the dust episode relative to other times. The dust haze was most intense at 16 UTC. Table 3 presents the inter-seasonal means and standard deviations of aerosol properties ( ˚a, ω0 and f (RH)) during periods when dust
was observed over the SGP. For the purpose of comparison, we also present in Table 3 the corresponding properties for smoke-dominated haze.
Since ˚a is remarkably similar for both smoke and dust episodes, it reflects more of aerosol sizes than it does of composition here and suggests the potential for both dust and smoke aerosols to exhibit similar wavelength-dependent scattering properties. Of the three aerosol properties pre-sented in Table 3, ω0 shows the most significant
distinc-tion between smoke and dust aerosols. While ω0 is 0.95
and 0.96 (for Dp<1 µm and Dp<10 µm, respectively)
dur-ing dust episodes, smoke episodes are characterized by a ω0
of 0.91 and 0.92, respectively. Dubovik et al. (2002) report 0.92≤ω0≤0.99 for desert dust.
Dust dominated haze is less hygroscopic than smoke-dominated haze. For dust-smoke-dominated aerosols (Dp<10 µm)
we observe f (RH)=1.4±0.6. Li-Jones et al. (1998) report hygroscopic growth factors up to 1.69 for high dust periods in April 1994 over Barbados. H¨anel (1976) estimated a much higher f (RH) for dust dominated particles, 1.9 when RH changes from 40 to 80%. At 80% RH level, Winkler (1969) reports that pure mineral dust has a f (RH) of less than 1.1, which is lower than that obtained for dust haze here. It should be recalled that the hygroscopic growth factors reported here are those obtained from the ratio of total light scattering at a RH of 85% to that at 40%. Relative to Winkler (1969), the higher f (RH) obtained here could indicate that, while the aerosols being sampled during the dust periods are dom-inated by dust, they could have been internally mixed and coated with other minor aerosol constituents such as sulfate (a major aerosol component at the SGP), which will increase f(RH). Measurements in the eastern Mediterranean have re-vealed that mineral dust particles are often coated with sul-fate and other soluble material (Levin et al., 1996). Some suggested coating mechanisms, which are consistent with the
occasional observations of a patchy rather than uniform sul-fate coating (Levin et al., 1996), include coagulation of dust and sulfate particles, and the oxidation of SO2 to SO4 on
dry mineral aerosol (Dentener et al., 1996, Korhonen et al. 2003).
4.6 Vertical aerosol distribution
Here we investigate the vertical distribution of submicron aerosols and the extent to which surface measurements of intensive aerosol properties represent column averages. We analyze 189 flight segments extending from April 2000 to December 2001. Measured aerosol variables include σs, σb
and σa. Unfortunately, aerosol number concentration was
not measured during this time. Figure 9 presents the mean seasonal vertical profiles of total light scattering coefficients, hemispheric backscatter fraction, single scattering albedo and ˚Angstr¨om exponent at the same wavelengths as those used for the surface observations. We also present in Fig. 9 the corresponding vertical profile of air temperature for al-titudes ranging from the surface to ∼3500 m agl. Since the ARM aircraft data for 2000 only commenced in the spring, Fig. 9 presents the annual data for 2001. It should be noted that the surface data plotted in Fig. 9 are obtained from sur-face measurements corresponding with the times of flight.
σs, which depends on aerosol amount and type, is
high-est within the surface layer. It tends to decline with altitude during all seasons, exhibiting highest values in the summer and the lowest in the winter. Annually, the lowest 1.2 km contributes 70% to the column σs. Beyond 2 km from the
surface in winter, σs dwindles to a very small value. This
could introduce some noise in the derived aerosol properties and may be partly responsible for the notable winter varia-tion in ˚a above 2 km from the surface (Fig. 9c). Relative to winter (with very steep boundary layer temperature profile), b, ω0 and ˚a show the least altitudinal variation in the
sum-mer, when the boundary-layer is generally well-mixed (see Fig. 9e). While ˚a and ω0tend to show a slow decline with
altitude annually, there is no notable trend in b. In terms of variability, b and ω0(parameters usually required for
ra-diative forcing calculations) only show a variability of 3.5 and 1%, respectively, annually within the lowest 2 km, and 3 and 3% respectively up to ≈3.5 km. ˚a varies by 2% annu-ally within the lowest 2 km and by 6.5% up to ≈3.5 km. We
M. G. Iziomon and U. Lohmann: Continental aerosols 1913
30
Fig. 9: Mean vertical profiles of (a) submicron total light scattering coefficient (σs) at 550 nm,
(b) single scattering albedo (ω0) at 550 nm (c) Ångström exponent (å) (450nm, 700 nm), (d)
hemispheric backscatter fraction at 550 nm and temperature at the ARM site
Fig. 9. Mean vertical profiles of (a) submicron total light scattering coefficient (σs) at 550 nm, (b) single scattering albedo (ω0) at 550 nm
(c) ˚Angstr¨om exponent ( ˚a) (450 nm, 700 nm), (d) hemispheric backscatter fraction (b) at 550 nm and (e) temperature (Ta) at the ARM site.
also compared surface measurements with column averaged aircraft measurements. Column-averaged and surface annual values of b, ω0and ˚a agree generally to within 5% in 2001.
This shows that near-surface observations of b, ω0and ˚a are
(on an annual average) representative of lower column prop-erties (particularly up to 2 km), where the bulk of the aerosols are situated.
4.7 Direct radiative effect of aerosols
Here we attempt to determine the sign of the top of the at-mosphere direct aerosol forcing. The effect of aerosols on the Earth’s radiative balance can be deduced from ω0, α and
β, where β is the fraction of radiation scattered upwards by aerosols and α is the albedo of the underlying surface. β is an integral of the scattering phase function over the up-ward hemisphere in the plane parallel coordinates and on the illumination directions expressed by the cosine of the solar zenith angle ϕ (Seinfeld and Pandis, 1998; Kaufman and
1914 M. G. Iziomon and U. Lohmann: Continental aerosols
31
Fig. 10: Difference (∆ω) between aeorosol single scattering albedo and critical single scattering albedo for dust haze (Dp <10 µm) as well as for submicron aerosols and all aerosols with Dp <10 µm.
Fig. 10. Difference (1ω) between aeorosol single scattering albedo
and critical single scattering albedo for dust haze (Dp<10 µm) as well as for submicron aerosols and all aerosols with Dp<10 µm.
Holben 1996). Radiative transfer theory to calculate β as a function of particle size and solar zenith angle was developed by Wiscombe and Grams (1976). When the solar zenith an-gle is directly overhead (i.e. ϕ=0), β=β(1) coincides with
b (Boucher 1998). For ϕ=0, seasonal values of β(1) for
submicron aerosols lie between 0.11±0.002 and 0.12±0.1 at 550 nm at the ARM site, respectively. Guyon et al. (2003) report β(1) values of 0.12±0.1 and 0.10±0.1 during the first and second periods of the LBA-EUSTACH 1 campaign, re-spectively.
However, for models used to assess the effect of aerosols on radiative forcing, it is desirable to average the forcing and hence the upscatter fraction over solar zenith angle (Seinfeld and Pandis, 1998). A value of 60◦, the mean value of the solar zenith angle over the sunlit earth, is often suggested (Wiscombe and Grams, 1976). We adapt this approach here (see also Haywood and Shine, 1995; Hobbs et al., 1997; and Lesins et al., 2002) and utilize Eq. (6) proposed by Anderson et al. (1999) and Sheridan and Ogren (1999) for the average aerosol upscatter fraction β. Although other methods of esti-mating β abound, our use of Anderson et al.’s (1999) parame-terization allows the direct utilization of local measurements. Equation (6) is an approximate relation based on the rela-tionship between b, β and the asymmetry parameter for the Henyey-Greenstein phase function (Wiscombe and Grams, 1976) with a root mean square error in β of 0.02 for b in the range of 0.05–0.29.
β =0.0817 + 1.8495b − 2.9682b2 (6)
The boundary between cooling and heating by aerosols can be expressed relative to a critical single scattering albedo ωc(Hegg et al., 1996; Seinfeld and Pandis, 1998):
ωc= n
2α/[β(1 − α)2+2α]o (7)
Aerosol impact is a warming if
ω0−ωc<0 (8)
and cooling otherwise. We obtain α from measurements of upwelling and downwelling shortwave radiation, and esti-mate β at 550 nm for dust haze (Dp<10 µm) as well as for
all submicron aerosols and for all aerosols with (Dp<10 µm)
from Eq. (6).
Mean seasonal values of β for aerosols at the SGP range from 0.25 to 0.28. This is in agreement with estimates of β reported by Charlson et al. (1992), Chylek and Wong (1995), and Hobbs et al. (1997). Furthermore, Seinfeld and Pandis (1998) report the value of the spectrally and solar angle av-eraged β to be about 0.29. Figure 10 presents 1ω (=ω0−ωc)
for dust haze as well as for all aerosols combined at the SGP. Since 1ω (which ranges from 0.18 to 0.28 for the exam-ined cases) is positive in all seasons, it follows that dust-dominated haze as well as all aerosols combined, produce a net cooling at the ARM site. This is quite different from the effect of Arctic haze, which produces a net warming in win-ter (Ackerman et al., 1986). In general, the cooling produced by dust haze (with high aerosol load) and that of all aerosols with Dp<10 µm exceed that of submicron aerosols. The
closeness between 1ω for submicron aerosols and aerosols with Dp<10 µm at the SGP again shows the dominance of
scattering by submicron aerosols at the ARM site. The net cooling of aerosols at the ARM site is most pronounced in the spring owing to high aerosol single scattering albedo and low surface albedo (≈0.21) during this season. We recog-nize that at decreasing solar zenith angle, β would decrease, increasing ωc and decreasing 1ω. However, at ϕ=0◦, we
observe that the sign of 1ω still remains positive although much lower (0.07–0.10 for submicron aerosols) at the site.
5 Summary and conclusion
Although tropospheric aerosols are of significance to climate change and contribute substantially to the radiative forcing of the Earth’s climate, the current level of scientific under-standing of their climatic influence is still rated as very low (IPCC, 2001). The continuous measurements of aerosol and meteorological variables by the ARM program help us to im-prove our understanding of continental aerosol properties as well as aerosol-related processes and effects. In this study, we present aerosol characteristics and net radiative impact at the ARM SGP site based on ARM data extending from 1997 to 2001. The observed range of annual mean visi-bility Vs (38±2 km) and ˚Angstr¨om turbidity coefficient κ
(0.064±0.025) at the site are consistent with those proposed for average continental aerosols (i.e. Vs≈35 km and κ≈0.1)
( ˚Angstr¨om, 1961; Vasilyev et al., 1995; Hess et al., 1998). The diurnal variation of submicron aerosol number concen-tration Naat the SGP site shows a pronounced diurnal cycle
M. G. Iziomon and U. Lohmann: Continental aerosols 1915 at the site, with the lowest hourly Narecorded in the
morn-ing and peak values between 19:00 and 21:00 UTC (13:00 and 15:00 Local Standard Time). We attribute the morning
minimum in Na to coagulation and the afternoon maximum
to photochemical production of aerosols. Given that the diur-nal cycle of Nais weak on cloudy days and even weaker on
rainy days, there does not seem to be any correlation between precipitation occurrence (as well as amount) and the aerosol number density on rainy days.
Of the chemically analyzed ionic components, SO=4 and NH+4 constitute the dominant species at the SGP seasonally, contributing 23–30% and 9–12% of the submicron aerosol mass, respectively. SO=4 and NH+4 follow similar annual cy-cles, recording their peak concentrations in the summer and lowest concentrations in winter. Consequently, the observed high mean values of σs and Np in the summer (relative to
winter) at the SGP could stem from increased SO2emissions
(from local power plants, oil refineries and automobiles), am-monium aerosols (from cattle pastures and wheat fields at the SGP) as well as from local agricultural field burning ac-tivities, smoke from remote forest fires, wind-enhanced dust episodes and biogenic emissions of organic carbon. In fall, there is a clear increase in small absorbing particles, which are not contributing to scattering. In summer, the low Rsp
suggests that dust contributes more to scattering than in fall. By comparing the aerosol properties at the SGP with those measured at other sites, it appears that absorbing pollutants tend to suppress hygroscopic growth and elevate backscat-ter fraction. We contrast the optical properties of dust and smoke dominated haze observed at the site. Of the aerosol optical properties examined here, ω0 show the most
signif-icant distinction between smoke and dust aerosols over two size ranges. While dust episodes have a mean ω0 of 0.95
and 0.96 at 550 nm (for Dp<1 µm and Dp<10 µm,
respec-tively), smoke episodes exhibit a ω0of 0.91 and 0.92,
respec-tively.
Annually, the lowest 1.2 km contributes 70% to the col-umn total light scattering coefficient. In relation to winter and the other seasons, b, ω0and ˚a show the least altitudinal
variation in the summer, when the boundary-layer is well-mixed. In general, column-averaged and surface annual val-ues of b, ω0 and ˚a agree to within 5% in 2001. Aerosols
produce a net cooling at the ARM site (most pronounced in the spring owing to relatively high aerosol single scat-tering albedo and low surface albedo during this season). Aerosol measurements of ionic organic and black carbon are presently not carried out at the SGP. We recommend that these measurements be initiated to complement the existing ones on the aerosol chemical composition at the SGP. Future studies should be aimed at estimating both the direct and in-direct aerosol forcing at the site by using detailed numerical models in conjunction with ARM in-situ measurements.
Acknowledgements. The data used for this study were obtained
from the Atmospheric Radiation Measurement (ARM) Program sponsored by the U.S. Department of Energy, Environmental Sci-ences Division. The authors thank the awarding agency as well as ARM staff for operating the ARM sites and maintaining the database, the aerosol group at NOAA Climate Monitoring and Di-agnostics Laboratory for operating the Aerosol Observing System, Kathy Doty for providing us with the ARM weather meta-data, Pa-tricia Quinn for providing us with the aerosol chemical composition data and the Dalhousie University Killam Trust for support. We also thank two anonymous reviewers and Glen Lesins for helpful com-ments.
References
Ackerman, T. P., Stenback, J. M., and Valero, F. P. J.: The impor-tance of Arctic haze for the energy budget of the Arctic, in Artic Air Pollution, edited by Stonehouse, B., pp. 151–158, Cambridge Univ. Press, New York, 1986.
Anderson, B. E. Grant, W. B., Gregory, G. L., Browell, E. V., Collins Jr., J. E., Sachse, D. W., Bagwell, D. R., Hudgins, C. H., Blake, D. R., and Blake, N. J.: Aerosols from biomass burn-ing over the tropical South Atlantic region: Distributions and im-pacts, J. Geophys. Res., 101, 24 117–24 137, 1996.
Anderson, T. L. and Ogren, J. A.: Determining aerosol radiative properties using the TSI 3563 integrating nephelometer, Aerosol Sci. Technol., 29, 57–69, 1998.
Anderson, T. L., Covert, D. S., Wheeler, J. D., Harris, J. M., Perry, K. D., Trost, B. E., Jaffe, D. J., and Ogren, J. A.: Aerosol back scatter fraction and single scattering albedo: Measured values and uncertainties at a coastal station in the Pacific Northwest. J Geophys. Res., 104, 26 793–26 807, 1999.
Andreae, M. O., Atlas, E., Cachier, H. Cofer, W. R., Harris, G. W., Helas, G., Koppman, R., Lacaux, J.P, and Ward, D. E.: Trace gas and aerosol emissions from savanna fires, in Biomass Burning and Global Change, edited by Levine, J. S., pp 278–295, MIT Press, Cambridge, Mass., 1996.
Andreae, M. O., Artaxo, P., Fischer, H., Freitas, S. R., Gr´egoire, J.M, Hansel, A, Hoor, P., Kormann, R., Krejci, R, Lange, L., Lelieveld, J., Lindinger W., Longo L., Peters W., De Reus M., Scheeren, B., Silva Dias, M. A. F., Str¨om, J., Van Velthoven, P. F. J., and Williams, J.: Transport of biomass burning smoke to the upper troposphere by deep convection in the equatorial region, Geophys. Res. Lett., 28, 951–954, 2001.
˚
Angstr¨om, A.: Technique of determining turbidity of the atmo-sphere, Tellus, 13, 214, 1961.
Barrie, L. A. and Barrie, M. J.: Chemical components of lower tro-pospheric aerosols in the high Arctic: Six years of observations, J. Atmos. Chem., 11, 211–226, 1990.
Baumgardner, D., Raga, G. B., Kok, G., Ogren, J., Rosas, I., Baez, A., and Novakov, T.: On the evolution of aerosol properties at a mountain site above Mexico City, J. Geophys. Res., 105, 22 243– 22 253, 2000.
Bergin, M. H., Ogren, J. A., Schwartz S. E., and McInnes, L. M.: Evaporation of ammonium nitrate aerosol in a heated neph-elometer: Implications for field measurements. Environ. Sci Technol., 31, 2878–2883, 1997
Bergin, M. H., Cass, G. R., Xu, J., Fang, C., Zeng, L. M., Yu, T., Salmon, L. G., Kiang, C. S., Tang, X. Y., Zhang, Y. H., and
1916 M. G. Iziomon and U. Lohmann: Continental aerosols
Chameides, W. L.: Aerosol Radiative, Physical, and Chemical Properties in Beijing During June, 1999, J. Geophys. Res., 106, 17 969–17 980, 2001.
Bond, T. C., Anderson, T. L., and Campbell, D.: Calibration and intercomparison of filter-based measurements of visible light ab-sorption by aerosols, Aerosol Sci. Technol., 30, 582–600, 1999. Boucher, O.: On aerosol direct shortwave forcing and the
Henyey-Greenstein Phase function, J. Atmos. Sci. 55, 128–134, 1998. Br´eon, F.-M., Tanr´e, D., and Generoso, S.: Aerosol effect on cloud
droplet size monitored from satellite, Science, 295, 834–838, 2002.
Carrico, C. M., Rood, M. J., Ogren, J. A., Neusuess, C., Wieden-sohler, A., and Heintzenberg, J.: Aerosol optical properties at Sagres, Portugal during ACE-2, Tellus, 52B, 694–715, 2000. Charlson, R. J., Schwartz, S. E., Hales, J. M., Cess, R. D., Coakley
Jr, J. A., Hansen, J. E., and Hofmann, D. J.: Climate forcing by anthropogenic aerosols, Science, 255, 423–430, 1992.
Chylek, P. and Wong, J.: Effect of absorbing aerosols on global radiation budget, Geophys. Res. Lett., 22, 929–931, 1995. Dentener, F. J. and Crutzen, P. J.: A three dimensional model of the
global ammonia cycle. J. Atmos. Chem., 19, 331–369, 1994. Dentener, F. J., Carmichael, G. R., Zhang, Y., Lelieveld J., and
Crutzen P.: The role of mineral aerosol as a reactive surface in the global troposphere, J. Geophys. Res., 101, 22 869–22 889, 1996. Dubovik, O., Holben, B., Eck, T. F., Smirnov, A., Kaufman, Y. J., King, M. D., Tanre, D., and Slutsker, I.: Variability of absorption and optical properties of key aerosol types observed in world-wide locations, J. Atmos. Sci., 59, 590–608, 2002.
Eck, T. F., Holben, B. N., Dubovik, O., Smirnov, A., Slutsker, I., Lobert, J. M., and Ramanathan, V.: Column integrated aerosol optical properties over Maldives during NE Monsoon for 1998– 2000, J. Geophys. Res., 106, 28 555–28 566, 2001.
Gaudichet, A., Echalar, F., Chatenet, B., Quisefit, J. P., Malingre, G., Cachier, H., Buat-Menard, P., Artaxo, P., and Maenhaut, W.: Trace elements in tropical African Savanna biomass burn-ing aerosols, J. Atmos. Chem., 22, 19–39, 1995.
Guyon, P., Graham, B., Beck, J., Boucher, O., Gerasopoulos, E., Mayol-Bracero, O. L., Roberts, G. C., Artaxo, P., and Andreae, M. O.: Physical properties and concentration of aerosol parti-cles over the Amazon tropical forest during the background and biomass burning conditions, Atmos. Chem. Phys., 3, 951–967, 2003.
Haywood, J. M. and Shine, K. P.: The effect of anthropogenic sul-fate and soot aerosol on the clear sky planetary radiation budget, Geophys. Res. Lett., 22, 603–606, 1995.
Haywood, J. M., Ramaswamy, V., and Soden, B. J.: Tropospheric aerosol climate forcing in clear-sky satellite observations over the oceans, Science, 283, 1299–1303, 1999.
H¨anel, G.: The properties of atmospheric aerosol particles as func-tions of the relative humidity at thermodynamic equilibrum with the surrounding moist air, Adv. Geophys., 19, 73–188, 1976. Hegg, D. A., Hobbs, P. V., Gasso, S., Nance, J. D., and Rangno,
A. L.: Aerosol measurements in the Arctic relevant to direct and indirect radiative forcing, J. Geophys. Res., 101, 23 349–23 363, 1996.
Hegg, D. A., Livingston, J., Hobbs, P. V., Novakov, T., and Russell, P.: Chemical apportionment of aerosol column optical depth off the mid-atlantic coast of the United States, J. Geophys. Res., 102, 25 293–25 303, 1997.
Hess, M., Koepke, P., and Schult, I.: Optical properties of aerosols and clouds: The software package OPAC, Bull. Amer. Meteorol. Soc., 79, 831–844, 1998.
Hobbs, P. V., Reid, J. S., Kotchenruther, R. A., Ferek, R. J., and Weiss, R.: Direct Radiative Forcing by Smoke from Biomass Burning, Science, 275, 1777–1778, 1997.
Holland, H. D.: The Chemistry of the Atmosphere and Oceans, p154, John Wiley, New York, 1978.
Horvath, H.: Atmospheric light absorption-a review, Atmos. Envi-ron., 27A, 293–317, 1993.
Husar, R. B., Poll, D. E., Holloway, J. M., Wilson, W. E., and Ellestad, T. G.: Trends of eastern U.S. haziness since 1948, Pre-pint Volume: Fourth symposium on turbulence, American Mete-orology Society, Boston, MA, pp. 249–256, 1979.
Intergovernmental Panel on Climate Change (IPCC): Climate Change 2001: The scientific basis, edited by Houghton, J. T., et al., Cambridge University Press, New York, 2001.
Iziomon, M. G. and Lohmann, U.: Optical and meteorologi-cal properties of smoke-dominated haze at the ARM South-ern Great Plains central facility, Geophys. Res. Lett., 30, 1123, doi:10.1029/2002GLO16606, 2003.
Kaufman, Y. J. and Holben, B. N.: Hemispheric backscattering by biomass burning and sulfate particles derived from sky measure-ments, J. Geophys. Res., 101, 19 433–19 445, 1996.
Kaufman, Y. J., Hobbs, P. V., Kirchhoff, V. W. J. H., Artaxo, P., Remer, L. A., Holben, B. N., King, M. D., Ward, D. E., Prins, E. M., Longo, K. M., Mattos, L. F., Nobre, C. A. Spinhirne, J. D., Ji, Q., Thompson, A. M., Gleason, J. F., Christopher, S. A., and Tsay, S.-C.: Smoke, Clouds, and Radiation-Brazil (SCAR-B) experiment, J. Geophys. Res., 103, 31 783–31 808, 1998. Korhonen, H., Napari, I., Timmreck, C., Vehkam¨aki, Pirjola,
L., Lehtinen, K. E. J., Lauri, A., and Kulmala, M.: Het-erogenous nucleation as a potential sulphate-coating mecha-nism of atmospheric mineral dust particles and implications of coated dust on new particle formation, J. Geophys. Res., 108, doi:10.1029/2003JD003553, 2003.
Koshmeider, H.: Theorie der horizontale Sichtweite, Beitrag. Atm. Physik., 12, 33–55, 1926
Le Canut, P., Andreae, M. O., Haris, G. W. Weinhold, F. G. and Zenker, T.: Airborne studies of emissions from savanna fires in southern Africa, 1, Aerosol emissions measured with a laser par-ticle counter, J. Geophys. Res., 101, 23 615–23 630, 1996. Lelieveld, J., Crutzen, P. J., Ramanathan, V., Andreae, M. O.,
Bren-ninkmeijer, C. A. M., Campos, T., Cass, G. R., Dickerson, R. R. Fischer, H., De Gouw, J. A., Hansel, A., Jefferson, A., Kley, D., De Laat, A. T. J., Lal, S., Lawrence, M. G., Lobert, J. M., Mayol-Bracero, L., Mitra, A. P., Novakov, T., Oltmans, S. J., Prather, K. A., Reiner, T., Rodhe, H., Scheeren, H. A., Sikka, D., and Williams, J.: The Indian Ocean Experiment: widespread air pol-lution from south and south east Asia, Science, 291, 1031–1036, 2001.
Lesins, G., Chylek, P., and Lohmann U.: A study of internal and ex-ternal mixing scenarios and its effect on aerosol optical proper-ties, J. Geophys. Res., 107, doi: 10.1029/2001JD000973, 2002. Levin, Z., Gaynor, E. and Gladstein V.: The effects of desert
parti-cles coated with sulfate on rain formation in the Eastern Mediter-ranean, J. Appl. Meteorol., 35, 1511–1523, 1996.
Li-Jones, X., Maring, H. B., and Prospero, J. M.: Effect of relative humidity on light scattering by mineral dust aerosol as measured
M. G. Iziomon and U. Lohmann: Continental aerosols 1917
in the marine boundary layer over the tropical Atlantic Ocean, J. Geophys. Res., 103, 31 113–31 121, 1998.
Lohmann, U., Feichter, J., Penner, J., and Leaitch, R.: Indirect ef-fect of sulfate and carbonaceous aerosols: A mechanistic treat-ment, J. Geophys. Res. 105, 12 193–12 206, 2000.
Malm, W. C., Sisler J. F., Huffman, D., Eldred, R. A., and Cahill, T. A.: Spatial and seasonal trends in particle concentration and op-tical extinction in the United States, J. Geophys. Res. 99, 1347– 1370, 1994.
Penner, J. E., Charlson, R. J., Hales, J. M., Laulainen, N. S., Leifer, R., Novakov, T., Ogren, J., Radke, L. F., Schwartz, S. E., and Travis, L.: Quantifying and minimizing uncertainty of climate forcing by anthropogenic aerosols, Bull. Am. Meteorol. Soc., 75, 375–400, 1994.
Peppler, R. A., Bahrmann, C. P, Barnard, J. C., Campbell, J. R., Cheng, M.-D., Ferrare, R. A, Halthore, R. N., Heilman, L. A., Hlavka, D. L., Laulainen, N. S., Lin, C.-J., Ogren, J. A., Poel-lot, M. R., Remer, L. A., Sassen, K., Spinhirne, J. D., Splitt, M. E., and Turner, D. D.: ARM Southern Great Plains site ob-servations of the smoke pall associated with the 1998 Central American fires, Bull. Amer. Met. Soc., 81, 2563–2591, 2000. Prospero, J. M., Barrett, K., Church, T., Dentener, F., Duce, R. A.,
Galloway, J. N., Levy, H., Moody, J., and Quinn P.: Atmospheric deposition of nutrients to the North Atlantic Basin, Biogeochem., 35, 27–73, 1996.
Prospero, J.: Long-term measurements of the transport of African mineral dust to the Southeastern United States: Implications for regional air quality, J. Geophys. Res., 104, 15 917–15 927, 1999. Pueschel, R. F., Charlson, R. J., and Ahlquist, N. C.: On the anoma-lous deliquescence of sea-spray aerosols, J. Appl. Met., 8, 995– 998, 1969.
Quinn, P. K., Bates, T. S., Miller, T. L., Coffman, D. J., Johnson, J. E., Harris, J. M., Ogren, J. A., Forbes, G., Anderson, T. L., Covert, D. S., and Rood, M. J.: Surface submicron aerosol chem-ical composition: What fraction is not sulfate? J. Geophys. Res., 105, 6785–6805, 2000.
Quinn, P. K., Miller, T. L., Bates, T. S., Ogren J. A., Andrews, E., and Shaw, G. E.: A 3-year record of simultaneously mea-sured aerosol chemical and optical properties at Barrow, Alaska, J. Geophys. Res., 107, No. D11, 10.1029/2001JD001248, 2002. Quinn, P. K. and Bates, T. S.: North American, Asian and Indian
Haze: Similar regional impacts on climate? Geophys. Res. Lett., 30, No. 11, 1555, doi:10.1029/2003GLO16934, 2003.
Scheff, P. A. and Valiozis, C.: Characterization and source identifi-cation of respirable particulate matter in Athens, Greece, Atmos. Environ., 24A, 203–211, 1990.
Schichtel, B. A., Husar, R. D., Falke, S. R., and Wilson W. E.: Haze trends over the United States, 1980–1995, Atmos. Environ., 35, 5205–5210, 2001.
Seinfeld, J. H. and Pandis, S. N.: Atmospheric chemistry and physics, John Wiley and Sons, INC, U.S., p1326, 1998. Sheridan, P. J. and Ogren, J. A.: Observations of the vertical and
regional variability of aerosol optical properties over central and eastern North America, J. Geophys. Res., 104, 16 793–16 805, 1999.
Sheridan, P. J., Delene, D. J., and Ogren, J. A.: Four years of contin-uous aerosol measurement from the Department of Energy’s At-mospheric radiation measurement program southern great plains cloud and radiation testbed site, J. Geophys. Res., 106, 20 735– 20 747, 2001.
Sokolik, I. N., Winker, D. M., Bergametti, G., Gillette D. A., Carmichael, G., Kaufman, Y. I., Gomes, L., Schuetz, L., and Pen-ner, J. E.: Introduction to special section: Outstanding problems in quantifying the radiative impacts of mineral dust, J. Geophys. Res., 106, 18 015–18 027, 2001.
Twomey, S. A.: Aerosols, clouds and radiation, Atmos. Environ., 25A, 2435–2442, 1991.
Vasilyev, O. B., Contreras, A. L, Velazquez, A. M., Fabi, R. P. Y., et al.: Spectral optical properties of the polluted atmosphere of Mexico City (spring summer 1992), J. Geophys. Res., 100, 26 027–26 044, 1995.
Weber, R. J., Marti, J. J., McMurry, M. J., Eisele, F. J., Tanner, D. J., and Jefferson, A.: Measurements of new particle formation and ultrafine particle growth rates at a clean continental site, J. Geophys. Res., 102, 4375–4385, 1997.
Weingartner, E., Nyeki, S., and Baltensperger, U.: Seasonal and diurnal variation of aerosol size distributions (10<D<750 nm) at a high-alpine site (Jungfraujoch 3580 m asl), J. Geophys. Res., 104, 26 809–26 820, 1999.
Winkler, P.: Untersuchungen uber das Grossenwachstum naturlicher Aerosolteilchen mit der relativen Feuchte nach einer Wagemethode, Ann. Meteorol., 4, 134–137, 1969. Wiscombe, W. J. and Grams, G. W.: The backscattered fraction
in two-stream approximations, J. Atmos. Sci., 33, 2440–2451, 1976.
Xu, J., Bergin, M. H., Yu, X., Liu, G., Zhao, J., Carrico, C. M., and Baumann, K.: Measurement of aerosol chemical, physical and radiative properties in the Yangtze delta region of China, Atmos. Environ. 36, 161–173, 2002.