HAL Id: inserm-00128557
https://www.hal.inserm.fr/inserm-00128557
Submitted on 1 Feb 2007
HAL is a multi-disciplinary open access
archive for the deposit and dissemination of sci-entific research documents, whether they are pub-lished or not. The documents may come from teaching and research institutions in France or abroad, or from public or private research centers.
L’archive ouverte pluridisciplinaire HAL, est destinée au dépôt et à la diffusion de documents scientifiques de niveau recherche, publiés ou non, émanant des établissements d’enseignement et de recherche français ou étrangers, des laboratoires publics ou privés.
Mitochondrial energy metabolism in a model of
undernutrition induced by dexamethasone.
Jean-François Dumas, Gilles Simard, Damien Roussel, Olivier Douay,
Françoise Foussard, Yves Malthiery, Patrick Ritz
To cite this version:
Jean-François Dumas, Gilles Simard, Damien Roussel, Olivier Douay, Françoise Foussard, et al.. Mitochondrial energy metabolism in a model of undernutrition induced by dexamethasone.. Br J Nutr, 2003, 90 (5), pp.969-77. �inserm-00128557�
Mitochondrial energy metabolism in an experimental dexamethasone malnutrition model.
Jean-François Dumas, Gilles Simard, Damien Roussel, Olivier Douay, Françoise Foussard, Yves Malthiery and Patrick Ritz*
INSERM EMI-U 00.18, Laboratoire de Biochimie et de Biologie Moléculaire. *For correspondence, Medecine B, CHU, F-49033 ANGERS Cedex 01 Phone: +33 241354499, fax : +33 241354969, e-mail : paritz@chu-angers.fr
Short title: Mitochondrial energetics in DEX-treated rats.
Keywords: glucocorticoid, mitochondrion, oxidative phosphorylation, and respiratory chain
complexes.
HAL author manuscript inserm-00128557, version 1
HAL author manuscript
Abstract
This investigation was undertaken to evaluate whether mitochondrial energy metabolism is altered in a malnutrition model associated with dexamethasone treatment (1.5mg/kg/day for 5 days). Gastrocnemius and liver mitochondria were isolated from dexamethasone (DEX)-treated, pair-fed (PF) and control (CON) rats. Body weight was significantly more reduced in DEX-treated group (-16%) than in PF group (-9%). Dexamethasone increased the liver mass (+59% vs. PF and +23% vs. CON) and decreased gastrocnemius mass. Moreover, in DEX-treated rats, liver mitochondria exhibited an increased rate of non-phosphorylative oxygen consumption with all substrates (approximately +42%). There was no difference in enzymatic complex activities in liver mitochondria between rat groups. Collectively, these results suggest an increased proton leak and/or redox slipping in liver mitochondria of DEX-treated rats. In addition, dexamethasone decreased the thermodynamic coupling and efficiency of oxidative phosphorylation. We therefore suggest that this increase in the proton leak and/or of redox slip in liver is responsible for the decrease in the thermodynamic efficiency of energy conversion. In contrast, none of the determined parameters of energy metabolism were altered by dexamethasone in gastrocnemius mitochondria. Therefore, it appears that dexamethasone specifically affects mitochondrial energy metabolism in liver.
Introduction
1
Malnutrition is highly prevalent among patients, especially elderly people. It is responsible for an 2
increased mortality, significant hospital expenditure, reduced muscle and immune function, and 3
decreased quality of life (Wallace et al. 1995; Tucker & Miguel, 1996; Chima et al. 1997; Lesourd 4
& Mazzari, 1997; Landi et al. 2000). Malnutrition results from a negative energy balance, a 5
situation where energy intake fails to meet energy requirements. Although anorexia and a reduced 6
energy intake are always associated with malnutrition, in some clinical circumstances, an increased 7
resting oxygen consumption rate (referred to as an increased energy requirements) can be shown 8
(Nguyen et al. 1999). On the contrary, most human and non-human studies show that energy 9
restriction decreases energy expenditure (Ramsey et al. 2000). Therefore it appears that in these 10
clinical states, adaptive mechanisms which lead to a reduction of energy requirements, fail to 11
operate. However, the biochemical nature of this negative energy balance phenomenon is poorly 12
understood at the present time. A wasting of energy may be a possible explanation. In other words, 13
oxidative phosphorylation may be less efficient. 14
High-dose glucocorticoid treatment affects body weight and body composition (Kochakian 15
& Robertson, 1951; Hausberger & Hausberger, 1958). It has also been found to induce a 16
hypercatabolic state which leads to a reduced muscle mass (Marone et al. 1994; Minet-Quinard et 17
al. 1999), suppressed protein synthesis, a transient increase in protein degradation and a negative 18
nitrogen balance (Bowes et al. 1996; Max et al. 1988; Odedra et al. 1983). Moreover, it is a model 19
of hypercortisolism, which occurs during metabolic stress in humans and which is associated with 20
an increased energy expenditure (Woodward & Emery, 1989; Brillon et al. 1995; Tataranni et al. 21
1996). On the other hand, acute high-dose treatment (<1 week) of rats with dexamethasone 22
decreases food intake (Kaur et al. 1989; Minet-Quinard et al. 1999). Therefore, a negative energy 23
balance ensues, both because of an increased energy expenditure and a decreased energy intake. 24
The mechanisms leading to this increased energy expenditure are not fully understood. There are 25
arguments to suggest that mitochondrial energy production could be affected. However, the effects 26
of glucocorticoids on cellular energy metabolism depend on the tissues being investigated and on 27
the duration of treatment. In the liver for example, short-term administration (<24 hours) of 28
dexamethasone appears to increase oxidative phosphorylation while having no effect on non-29
phosphorylative respiration (Wakat & Haynes, 1977; Allan et al. 1983). On the contrary, longer 30
administration (<1 week) of glucocorticoids, results in decreased liver oxidative phosphorylation 31
and ATP synthesis when fuelled through complex I, however remaining unchanged when fuelled 32
through complex II or IV (Kerppola, 1960; Kimura & Rasmussen, 1977; Jani et al. 1991). In 33
isolated skeletal muscle mitochondria, studies show either no change, a decrease or an increase in 34
oxidative capacity (Cytochrome c oxidase activity) or in oxidative phosphorylation (Vignos & 35
Greene, 1973; Koski et al. 1974; Capaccio et al. 1985; Marone et al. 1994; Weber et al., 2002). 36
Since liver and muscle contribute approximately 50% of body oxygen consumption (Rolfe 37
& Brown, 1997), most of it being coupled with ATP synthesis, we undertook this study to 38
investigate the effects of 5 days of high dose (1.5mg/kg/day) dexamethasone on energy metabolism 39
particularly in muscle and liver mitochondria. The comparison with caloric restriction helps in the 40
understanding of the increased energy expenditure observed at the whole body level. 41
42
Materials and methods
42
Animals 43
The present investigation was performed in accordance with the French guiding principles in the 44
care and use of animals. Thirty-two male Sprague-Dawley rats, born and bred in our animal facility, 45
were housed in individual cages at 9 weeks of age (300-350g). Animals were provided with water 46
ad libitum and a standard diet (U.A.R A04) consisting (% weight) of 16% protein, 3% fat, 60% 47
carbohydrate and 21% water, fibre, vitamins and minerals. The metabolizable energy content was 48
12 kJ/g. Rats were divided into 4 groups of 8 as follows: dexamethasone(DEX)-treated rats received 49
a daily intraperitoneal injection of 1.5 mg/kg of dexamethasone for 5 days. Due to the fact that 50
dexamethasone treatment induces anorexia, pair-fed (PF) rats were used to discriminate between the 51
effect of anorexia and the effect of dexamethasone itself on the parameters measured. PF rats were 52
pair-fed with DEX-treated animals (rats received the same food quantity consumed by DEX-treated 53
rats the previous day) and were injected daily with an isovolumic solution of 0.9% NaCl. Rats from 54
the control group (CON) were healthy, received no treatment, and were fed ad libitum. Animals of 55
the control injected group (CI) were fed ad libitum and were injected with an isovolumic solution of 56
0.9% NaCl. This group was used to study the effects of NaCl injection. As results were similar 57
between the two control groups, the CI group was omitted in the presentation of data. Experiments 58
were conducted over a 5-day period. The dose and duration of the dexamethasone treatment was 59
chosen with reference to the literature and is known to induce a reproducible maximum 60
hypercatabolic state (Minet-Quinard et al. 2000). On the 4th day, following an overnight fast, the
61
animals were killed by decapitation. Gastrocnemius, liver and interscapular brown adipose tissue 62
were removed rapidly and weighed. Some tissue samples were immediately used for respiratory 63
measurements and the remainder were frozen in liquid nitrogen and stored at -80°C in order to 64
measure enzyme activity levels. Gastrocnemius muscle was chosen because this mixed-fibers tissue 65
is representative of muscle fiber types contained in the hindlimb of the Sprague-Dawley rat 66
(Armstrong & Phelps, 1984). 67
68
Mitochondrial enzyme activities 69
Frozen liver and gastrocnemius (10-30 mg) were thawed and homogenized with a Potter-Elvehjem 70
homogeniser (7 strokes) in an isolation medium consisting of 220 mM mannitol, 75 mM sucrose, 10 71
mM Tris and 1 mM EGTA, pH 7.2. Each homogenate was centrifuged at 600 g for 10 min and the 72
resulting supernatants were filtered through cheesecloth. All procedures were performed at 4°C. 73
The activity of citrate synthase, succinate dehydrogenase and complexes I, III and IV was measured 74
spectrophotometrically at 37°C in the supernatant fraction via an adaptation of that as described by 75
Malgat et al. (1999), and in agreement with the Mitochondrial Diseases Group of the Association 76
Française de Myopathie (AFM). Protein concentration was determined using the Bicinchoninic acid 77
Assay kit (Interchim, Montluçon, France) with bovine serum albumin (BSA) used as a control. 78
The activity of citrate synthase (CS) was measured in a reaction medium consisting of 100 79
mM Tris/HCl, 40 µg/ml 5,5'-dithio-bis(2-nitrobenzoic acid), 1 mM oxaloacetate, 0.3 mM acetyl 80
CoA and 4 % of Triton X 100, pH 8.1. After 3 min of incubation, the reaction was initiated by 81
adding the homogenate (20 to 50 µg proteins) and the change in optical density at 412 nm was 82
recorded for 3 min. 83
The activity of succinate dehydrogenase was measured by following the reduction of 2,6-84
dichlorophenolindophenol (DCPIP), in the presence of phenazine methosulfate (PMS) at 600 nm. 85
Homogenate (20 to 50 µg proteins) was preincubated in a buffer containing 50 mM KH2PO4, 16
86
mM succinate, 1.5 mM KCN, 100 µM PMS, pH 7.5 for 5 min. The reaction began with the addition 87
of 103 µM DCPIP and the optical density was recorded for 3 min. 88
The activity of complex I was determined by monitoring the oxidation of NADH at 340 nm. 89
Homogenate (40 to 100 µg proteins) was preincubated for 3 min in 820 µl of distilled water. 90
Following this, 10 mM KH2PO4, 2 mM KCN, 5 µg/ml antimycin A, 100 µM decylubiquinone, 1.3
91
mg/ml BSA, 5 mM MgCl2, pH 7.5 were added. The reaction was initiated by the addition of 200
92
µM NADH and the change in the optical density was analysed for 3 min. The NADH 93
decylubiquinone reductase activity was also measured in the presence of 12.7 µM rotenone. The 94
specific activity of complex I represented the difference between NADH oxidation activity, both 95
with and without the rotenone. 96
The activity of complex III was determined by monitoring the reduction of cytochrome c at 97
550 nm. Homogenate (20 to 50 µg proteins) was incubated for 30 sec in a reaction medium 98
consisting of 35 mM KH2PO4, 5 mM MgCl2, 2.5 mg/ml BSA, 1.8 mM KCN, 125 µM oxidized
99
cytochrome c, 12.5 µM rotenone and 62.5 mM EDTA, pH 7.5. The reaction was initiated by adding 100
80 µM decylubiquinol and the optical density was measured for 3 min. The nonenzymatic reduction 101
of cytochrome c was measured under identical conditions after the addition of 10 µg/ml antimycin 102
A. The specific activity of complex III was calculated by subtracting the activity of the 103
nonenzymatic reaction from that of the total activity of complex III. 104
The activity of complex IV was measured by monitoring the oxidation of reduced 105
cytochrome c at 550 nm. A 50 µM solution of reduced cytochrome c (92 to 97% reduced using 106
dithionite) in 10 mM KH2PO4, pH 7.0 was preincubated for 5 min. The reaction was initiated by
107
adding the homogenate (20 to 50 µg proteins) and the change in optical density was measured for 108 1.5 min. 109 110 Mitochondrial isolations 111
Gastrocnemius muscle and liver were removed, weighed and immediately placed in an ice-cold 112
isolation medium consisting of 250 mM sucrose, 1 mM EGTA and 10 mM Tris/HCl, pH 7.4. 113
Muscle mitochondria were isolated from gastrocnemius via an adaptation of the differential 114
centrifugation procedure, as used previously by Roussel et al. (2000). All steps were performed at 115
4°C. 116
Muscles (2-2.5 g) were cut with scissors, minced using a Polytron (4 to 5 sec.) in an isolation 117
medium (20 ml/g tissue) then homogenized with a Potter-Elvehjem homogeniser (7 strokes). The 118
homogenate was centrifuged at 600 g for 10 min. The resulting supernatant was filtered through 119
cheesecloth and then centrifuged at 10 000 g for 10 min. The pellet was resuspended in the isolation 120
medium and then centrifuged at 10 000 g for 10 min. Finally, the pellet was resuspended in a 121
minimal volume of respiratory medium consisting of 120 mM KCl, 5 mM KH2PO4, 3 mM
122
HEPES, 1 mM EGTA, 2 mM MgCl2 and 0.3 % (w/v) BSA, pH 7.4. Liver mitochondria were
123
isolated by using a modification of the differential centrifugation procedure used previously by 124
Krahenbuhl et al. (1994). The liver (6-7 g) was cut with scissors and homogenized using a Potter-125
Elvehjem homogeniser (7 strokes) in the isolation medium (8 ml/g tissue). The homogenate was 126
centrifuged at 600 g for 10 min. The resulting supernatant was filtered through cheesecloth, then 127
centrifuged at 7 000 g for 10 min. The pellet was resuspended in the isolation medium (10 ml/g 128
tissue) and then centrifuged at 3 500 g for 10 min. The resulting pellet was resuspended in a minute 129
volume of respiratory medium. The lower g force of the last centrifugation step (3500 g) gives a 130
more homogeneous mitochondrial preparation and is known to minimize the cytoplasmic 131
contamination and mitochondrial damage done to the pellet (< 10% in the present study) in addition 132
to maximizing the respiratory parameters (Goglia et al. 1988; Lanni et al. 1996). 133
134
Mitochondrial respiration 135
Oxygen was measured using a Clark oxygen electrode (oxygraph Hansatech), in a 2 ml glass cell, 136
via continuous stirring at a constant temperature of 30°C. Mitochondria (0.4-0.6 mg protein/ml) 137
were incubated in the respiratory reaction medium as described above and saturated with room air. 138
Substrate concentrations from liver measurements were 5 mM glutamate, 5 mM succinate and 5 139
mM ascorbate + 0.5 mM N,N,N',N'-tetramethyl-p-phenylenediamine (TMPD). With regards to 140
gastrocnemius measurements, 5 mM pyruvate + 5 mM malate, 5 mM succinate and 2 mM ascorbate 141
+ 0.5 mM TMPD were used. Inhibitor concentrations included 5 µM rotenone (to inhibit complex I 142
of the respiratory chain), and 3 mM myxothiazole (to inhibit complex III). The active state of 143
respiration (state 3) was initiated by the addition of ADP (150 µM to the liver mitochondria or 200 144
µM to the gastrocnemius mitochondria). The basal non-phosphorylating respiration rate (state 4) 145
was obtained by the addition of 3 µg/ml of oligomycin. RCR was the ratio of oxygen consumed 146
after the addition of ADP to that consumed in the presence of oligomycin. The uncoupled state of 147
respiration was initiated by the addition of 2 µM of FCCP (carbonyl cyanide p-148
trifluoromethoxyphenylhydrazone). The respiratory parameters measured in isolated mitochondria 149
were normalized in relation to the specific activity of citrate synthase. 150
151
Calculation of thermodynamic coupling and efficiency of oxidative phosphorylation 152
Parameters were calculated using the methodology of Cairns et al (1998). The thermodynamic 153
coupling of the energy conversion is designated by the dimensionless parameter q, known as the 154
degree of coupling of oxidative phosphorylation. 155
q = (1- (Jsh/Junc))1/2
156
Jsh is the net oxygen consumption in state 4-oligomycin respiration, in the presence of oligomycin
157
that inhibits ATP synthase. Junc is the uncoupled rate of oxygen uptake induced by the addition of
158
FCCP, which dissipates the transmitochondrial proton gradient, and as a result ATP production 159
becomes nil. 160
Kedem and Caplan (1965) have defined the efficiency of the energy conversion for oxidative 161
phosphorylation (η). Between state 4-oligomycin and state 3-uncoupled respiration, which represent
162
two steady states, an optimal thermodynamic efficiency of the energy conversion (ηopt) can be
163
discerned for any value of q (Stucki, 1980). 164
ηopt = tan² (α/2), where α=arcsin q
165
Oxidative phosphorylation should operate at a steady state for optimal efficiency for any given 166
degree of coupling. In addition, q can represent several well-defined values depending on the 167
energetic needs of the cell (Stucki, 1980). This theory is based on the thermodynamic trade-off of 168
reducing efficiency to produce the maximum phosphate potential or increasing the efficiency to 169
economize phosphate potential. Stucki (1980) has defined some physiological meanings for the 170
degrees of mitochondrial oxidative coupling. The specific thermodynamic degrees of coupling 171
correspond to the following set points with an unique maximal value of q: qecp (0.972) which is the
172
economic net output power (phosphate potential) at optimal efficiency, qecf (0.953) being the
173
economic net output flow (ATP), qp (0.910) as the maximal net output power and qf (0.786) as the
174
maximal net output flow at optimal efficiency. 175
In comparison to conventional measurements (RCR, ATP/O), non-equilibrium thermodynamics 176
analysis provides a quantitative description and a better estimation of stoichiometry and the 177
efficiency of energy conversion. 178
179
Statistical analysis 180
Results were expressed as mean ± standard deviation (SD). Means were compared by ANOVA
181
using a Fisher Post-hoc test. A P value of < 0.05 was considered significant in all cases. All 182
analyses were performed using StatView version 5.0 (SAS Institute, Cary, NC, USA). 183
184
Results
184
Dexamethasone induced a significant reduction in food intake from day 2 (Fig. 1). 185
Animals in the 3 groups did not differ, with respect to body weight, at the beginning of the 186
experimental procedure. Body weight decreased in DEX-treated rats from day 1, and PF animals 187
from day 2 (Fig. 2). This decrease was significantly greater in DEX-treated rats than in PF animals, 188
corresponding to 16% (DEX-treated) and 9% (PF) of initial body mass on the 4th day of treatment. 189
At the same time, CON rats increased their body mass by 3.2% (Fig. 2). 190
The overnight fasting decreased body weight in the 3 rats groups (Table 1). Liver weight 191
was increased in DEX-treated animals by 23% vs. CON (P<0.01) and by 59% vs. PF (P<0.01) 192
(Table 1). Conversely food restriction significantly decreased liver mass by 20% (PF rats vs. CON 193
rats). This difference in liver mass was not related to a change in hydration, as the dexamethasone-194
treatment or the food restriction did not affect relative water contents (62.0 ± 3.0 vs. 66.0 ± 8.4 vs. 195
62.1 ± 4.3 % per liver in DEX-treated, PF and CON rats). In DEX-treated rats, gastrocnemius mass 196
was significantly decreased in comparaison with PF rats (-19%) and CON animals (-19%) (Table 197
1). There was a significant increase in interscapular BAT mass in the DEX-treated group (+117% 198
compared to PF and 90% compared to CON) (Table 1). 199
In the liver, complex I activity was significantly higher in the DEX-treated group than in the 200
PF group (+120%), but it was not different in comparison to the CON group (Table 2). 201
Dexamethasone treatment significantly decreased the specific activity of complex IV (-28% 202
compared to PF rats), although it was not different when compared to controls. There were no 203
significant difference in the specific activities of citrate synthase, succinate dehydrogenase and 204
complex III between the DEX-treated and other groups (Table 2). 205
In gastrocnemius, none of the enzymatic activities were significantly affected by 206
glucocorticoid treatment (Table 3). 207
In the isolated liver mitochondria, the specific citrate synthase activity was significantly 208
lower in the DEX-treated group than in the CON group (-28%) and PF group (-20%) (data not 209
shown). Basal non-phosphorylative respiration (state 4-oligomycin respiration) rates, normalized by 210
the specific citrate synthase activity, are shown in Figure 3. With succinate and TMPD/ascorbate 211
used as substrates, the state 4-oligomycin respiration was significantly increased (+46%) in isolated 212
liver mitochondria from DEX-treated rats compared to other groups. In the liver glutamate-respiring 213
mitochondria, dexamethasone treatment significantly increased (+33%) the state 4-oligomycin 214
oxygen consumption in comparison to PF rats, but not when compared to CON rats. 215
Table 4 shows that the respiratory parameters in the liver, expressed per mg of mitochondria 216
protein, were similar, across groups regardless of the respiratory substrate. 217
In gastrocnemius none of the respiratory parameters were affected by dexamethasone 218
treatment whatever the substrate used (Table 5). When gastrocnemius respiratory parameters were 219
normalized by the CS activity, no difference was observed between groups (data not shown). 220
In liver succinate-respiring mitochondria, q was significantly decreased by dexamethasone 221
treatment. With glutamate, q was marginally (P=0.12) lower in DEX-treated and PF than in CON 222
rats (Table 6). Similar results were obtained for the determined thermodynamic optimal efficiency 223
of oxidative phosphorylation (ηopt).
224
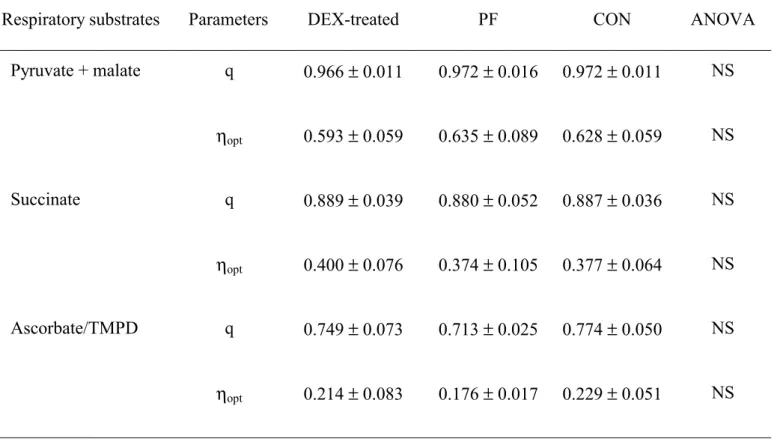
In gastrocnemius, q and ηopt were similar in the 3 rats groups (Table 7).
225 226
Discussion
226
The present study reports that the induction of a catabolic state, by dexamethasone, results in an 227
increased liver mass and increased non-phosphorylative oxygen consumption in liver mitochondria. 228
In addition, we found a decreased thermodynamic coupling and efficiency of the oxidative 229
phosphorylation in the complex I and II respiratory pathways in the liver mitochondria of DEX-230
treated rats. In contrast, dexamethasone induced gastrocnemius mass atrophy without affecting 231
mitochondrial energy metabolism. 232
While the citrate-synthase activity was not modified in the 600 g homogenate it was 233
decreased in isolated mitochondria of liver in DEX-treated rats. Moreover, we found a lower 234
percentage of intact mitochondria in isolated liver mitochondria of DEX-treated rats (91% 235
compared to 96% and 94% in CON and PF groups). Therefore, for the measurement of parameters 236
in isolated mitochondria preparations, we used the specific citrate synthase activity as a 237
mitochondrial marker enzyme. These parameters/CS ratios may reflect a change originating from 238
the mitochondria themselves, rather than from the homogeneization or measurement procedures. 239
Of particular interest is the finding that dexamethasone treatment significantly increased 240
liver non-phosphorylative oxygen consumption using succinate (+46%) and ascorbate as substrates 241
(+46%; versus CON and PF). With regard to glutamate, state 4-oligomycin respiration was not 242
different compared to control rats, but it was higher (+33%) in DEX-treated relative to PF animals. 243
Therefore, it appears that there is a specific catabolic state-related increase (+42%) in the non-244
phosphorylative oxygen consumption of liver mitochondria. Indeed, state 4-oligomycin respiration 245
was increased in DEX-treated rats compared to CON rats, except in complex I (effect of food 246
restriction and/or hypercatabolism), and consistent increases were found when DEX-treated animals 247
were compared to PF animals (effect of hypercatabolism). On the other hand, food restriction 248
appears to reduce state 4-oligomycin oxygen consumption (via complex I) in PF compared to CON 249
rats. Such a change in these non-phosphorylative conditions could be due to modifications in 250
respiratory chain activity, inner membrane conductance (proton leak) or the intrinsic coupling of the 251
respiratory chain (H+/2e-). The present acute treatment using dexamethasone did not modify
252
respiratory chain complex activities in the liver. As a result, this strongly suggests that basal 253
proton conductance and/or the efficiency at the level of the respiratory chain did change in the liver 254
mitochondria. In the latter case, we can speculate an effect located on the cytochrome oxidase as 255
state 4-oligomycin respiration by using ascorbate/TMPD as substrate was increased. Moreover, it 256
has been demonstrated that cytochrome oxidase H+/2e- stoichiometry is variable and represents a
257
possible location for intrinsic uncoupling at the level of the respiratory chain (Capitanio et al. 1991; 258
Papa et al. 1991; Piquet et al. 2000). However, further experiments are necessary to confirm these 259
possibilities. Whatever the mechanism involved, this represents a substantial increase in state 4 260
energy wastage. Moreover, it is interesting to note that proton leak and redox slipping may affect 261
the oxidative phosphorylation yield. Our results agree with data obtained from the long-term 262
administration (3-7 days) of high-dose glucocorticoids, which are reported to decrease liver 263
oxidative phosphorylation (state 3 respiration) via complex I respiratory substrates while remaining 264
unchanged when fuelled through complex II or IV (Kerppola, 1960; Kimura & Rasmussen, 1977; 265
Jani et al. 1991). Our findings that state 4 respiration is increased are therefore complementary to 266
those studies since it has never been studied in DEX-treated rats, although inconsistencies were 267
shown in corticosterone-treated rats (Jani et al. 1991). 268
Mitochondria can vary the efficiency of oxidative phosphorylation in order to respond to one 269
of four physiological missions: 1) maximizing ATP production with a corresponding value qf for
270
the thermodynamic degree of coupling, 2) maximizing the cellular phosphate potential (qp), 3)
271
minimizing the cost of production (qecf ) and 4) a combination of all three (qecp) (Stucki JW, 1980).
272
In the control animals used in our study, the experimentally derived q value for the complex I and II 273
pathways were between that of qp and qecf. Therefore, the liver mitochondria of the control animals
274
adapted their function for the economic production of ATP in addition to maintaining the phosphate 275
potential. Dexamethasone decreases the degree of thermodynamic coupling of oxidative 276
phosphorylation in both complex I and II respiratory pathways. Their values were between qf and qp
277
and nearly that of qp. In relation to this result, the thermodynamic optimal efficiency of energy
278
conversion (ηopt) was also decreased by dexamethasone. These results therefore suggest that in
279
DEX-treated rats, liver mitochondria adapt their function for maximum ATP production and also 280
to maintain cellular phosphate potential at the expense of the energy conversion efficiency. Similar 281
adaptive reductions in the efficiency of oxidative phosphorylation has already been noted by 282
Nogueira et al (2001) who showed that cellular respiratory rate increases in liver mitochondria of 283
either hyperthyroid rats or animals exposed to a polyunsatured fatty acid deficient diet. 284
It is well known that liver mass is decreased during energy restriction, which in turn could 285
partly explain why energy expenditure falls in response to a reduced food intake (Ramsey et al. 286
2000). In the present study, liver weight was decreased by food restriction (PF versus control rats) 287
and higher (23 to 59%) in DEX-treated rats compared with other rat groups. Such an increase in 288
liver mass could result from an increased glycogen content (Weber & Kletzien, 1982; Michaels & 289
Cardell, 1997; Bollen et al. 1998) although we did not find any difference in hydratation. 290
Alternatively, hepatic lipid content is increased in DEX-treated rats, but is insufficient to fully 291
explain the increased liver mass (Kaur N et al. 1989; Palacios et al. 1995; Franco-Colin et al. 2000). 292
Finally, dexamethasone treatment increase liver protein synthesis and therefore metabolic tissue 293
(Odedra et al. 1983; Savary et al. 2001). This suggests that both maintenance and growth costs may 294
be increased. 295
Our study demonstrated that a dexamethasone-induced hypercatabolic state results in 296
skeletal muscle atrophy without any change in mitochondrial energy metabolism. Indeed, none of 297
the respiratory complex activities, oxygen consumption rates or the thermodynamic degree of 298
coupling of oxidative phosphorylation, were altered in the mitochondria of DEX-treated rats. This is 299
in agreement with previously reported effects of glucocorticoid treatment (Vignos & Greene, 1973; 300
Capaccio et al. 1985; Marone et al, 1994). These results suggest that the mitochondrial metabolism 301
of skeletal muscle produces enough ATP to fulfil either the cellular energy requirement and/or the 302
energy-dependent pathways induced by glucocorticoids, such as the energy-ubiquin-dependent 303
proteolytic pathway (Tiao G et al. 1996; Mitch et al. 1999), and the energy-dependent glutamine 304
synthase activity pathway (Max SR et al, 1988; Minet-Quinard et al. 1999, 2000). 305
The main thermogenic tissue in rats is brown adipose tissue, the weight of which is largely 306
increased (+100%, present study) by glucocorticoid injection. Previous studies have clearly 307
demonstrated that such an increase in the BAT mass was due to increased lipid storage rather than 308
an increased thermogenic capacity of this tissue (Mazzuccheli et al. 1960; Strack et al. 1995). 309
Furthermore, glucocorticoids are known to reduce the activity or the gene expression of UCP1 310
(Tokuyama & Himms-Hagen, 1989; Moriscot et al. 1993; Strack et al. 1995). Moreover, in our 311
study we found no effect of dexamethasone on mitochondrial oxidative capacity (cytochrome c 312
oxidase activity; data not shown). Therefore, it is unlikely that interscapular BAT increases energy 313
expenditure in DEX-treated rats. 314
A reduction in body size (a 16% weight loss in the present study) generally results in 315
lowering of energy expenditure per whole rat, because of the reduced maintenance requirement 316
(Ramsey et al. 2000). In the present study, the dexamethasone-related decrease in the body weight 317
was greater than that observed in the PF rats, highlighting an increased whole body energy 318
expenditure. This is paradoxical in view of the reducing effect of food restriction on energy 319
expenditure (Ramsey et al. 2000). Furthermore, in our study, dexamethasone treatment increased 320
the liver-to-body weight ratio while the relative skeletal muscle mass remained unchanged. Since 321
liver and muscle are the main contributors to standard metabolic rate in rats (Rolfe & Brown, 1997), 322
it is likely that the liver would effectively contribute to the increased energy expenditure despite the 323
body weight loss (Woodward & Emery, 1989). Indeed, if we assume that liver contributes 20% to 324
the metabolic rate of a rat (Rolfe & Brown, 1997), then the 60-80% gain in the liver-to-body weight 325
ratio reported herein, could increase total energy expenditure by 12-16%. Glucocorticoids 326
administered in humans and rats results in an increased energy expenditure by 10-20% (Woodward 327
& Emery, 1989; Brillon et al. 1995; Tataranni et al. 1996). Obviously, we can not rule out the 328
influence of other biochemical mechanisms or possible determinants of energy balance which have 329
accounted also for the weight loss. 330
In conclusion, 5 days of high-dose dexamethasone treatment induced a significant increase 331
in liver mass, an increase in liver mitochondrial non-phosphorylative oxygen consumption rate from 332
all substrates used, and a decrease in the thermodynamic coupling of oxidative phosphorylation in 333
liver respiratory pathways. We suggest therefore that dexamethasone increases proton leak and/or 334
redox slipping in liver mitochondria, which in turn is probably responsible for the decrease in the 335
thermodynamic efficiency of energy conversion. Thus, rats would adapt their mitochondrial energy 336
functions to a dexamethasone-induced hypermetabolic state by maximizing ATP production in 337
addition to maintaining their cellular energy state, regardless of the cost. This treatment has no 338
effect on energy metabolism in the muscle. Together with a decreased food intake, the increase in 339
energy expenditure induced by high dose of dexamethasone results in a negative energy balance and 340
thus weight loss. 341
Acknowledgements
Authors thank Pierre Legras, Jérôme Roux and Dominique Gilbert for animal care, Antoine Augeraud for technical assistance and to Miriam Ryan for her assistance in correcting the english. This work was supported by grants from Contrat de Plan Etat Region 2000-2004.
Textes footnotes
BAT, brown adipose tissue; CS, citrate synthase; DCPIP, 2,3-dichlorophenollindophenol; FCCP, carbonyl cyanide p-trifluoromethoxyphenylhydrazone; PMS, phenazine methosulfate; RCR, respiratory control ratio; TCA, tricarboxylic acid; TMPD, N,N,N',N'-tetramethyl-p-phenylenediamine; TNB, thio-bis(2-nitrobenzoic acid).
References
Allan EH, Chisholm AB & Titheradge MA (1983) The stimulation of hepatic oxidative phosphorylation following dexamethasone treatment of rats. Biochimica and Biophysica Acta 725, 71-76.
Armstrong RB & Phelps RO (1984) Muscle fiber type composition of the rat hindlimb. American Journal of Anatomy 171, 259-272.
Bollen M, Keppens S & Stalmans W (1998) Specific features of glycogen metabolism in the liver. Biochemical Journal 336, 19-31.
Bowes SB, Jackson NC, Papachristodoulou D, Umpleby AM & Sonksen PH (1996) Effect of corticosterone on protein degradation in isolated rat soleus and extensor digitorum longus muscles. Journal of Endocrinology 148, 501-507.
Brand MD, Chien LF, Ainscow EK, Rolfe DF & Porter RK (1994) The causes and functions of mitochondrial proton leak. Biochimica and Biophysica Acta 1187, 132-139.
Brand MD, Hafner RP & Brown GC (1988) Control of respiration in non-phosphorylating mitochondria is shared between the proton leak and the respiratory chain. Biochemical Journal 255, 535-539.
Brillon DJ, Zheng B, Campbell RG & Matthews DE (1995) Effect of cortisol on energy expenditure and amino acid metabolism in humans. American Journal of Physiology
268, E501-513.
Cairns CB, Walther J, Harken AH & Banerjee A (1998) Mitochondrial oxidative phosphorylation thermodynamic efficiencies reflect physiological organ roles. American Journal of Physiology 274, R1376-1383.
Capaccio JA, Galassi TM & Hickson RC (1985) Unaltered aerobic power and endurance following glucocorticoid-induced muscle atrophy. Medicine Sciences Sports Exercise
17, 380-384.
Capitanio N, Capitanio G, De Nitto E, Villani G & Papa S (1991) H+/e- stoichiometry of mitochondrial cytochrome complexes reconstituted in liposomes. Rate-dependent changes of the stoichiometry in the cytochrome c oxidase vesicles. FEBS Letters 288, 179-182.
Chima CS, Barco K, Dewitt ML, Maeda M, Teran JC & Mullen KD (1997) Relationship of nutritional status to length of stay, hospital costs, and discharge status of patients hospitalized in the medicine service. Journal of the American Dietetic Association 97, 975-978; quiz 979-980.
Franco-Colin M, Tellez-Lopez AM, Quevedo-Corona L & Racotta R (2000) Effects of long-term high-sucrose and dexamethasone on fat depots, liver fat, and lipid fuel fluxes through the retroperitoneal adipose tissue and splanchnic area in rats. Metabolism 49, 1289-1294.
Goglia F, Liverini G, Lanni A, Iossa S & Barletta A (1988) Light mitochondria and cellular thermogenesis. Biochemical and Biophysical Research Communications 151, 1241-1249.
Hausberger FX & Hausberger BC (1958) Effect of insulin and cortisone on weight gain, protein and fat content of rats. American Journal of Physiology 103, 455-460.
Hill JO, Latiff A & DiGirolamo M (1985) Effects of variable caloric restriction on utilization of ingested energy in rats. American Journal of Physiology 248, R549-559.
Jani MS, Telang SD & Katyare SS (1991) Effect of corticosterone treatment on energy metabolism in rat liver mitochondria. Journal of Steroid Biochemistry and Molecular Biology 38, 587-591.
Kaur N, Sharma N & Gupta AK (1989) Effects of dexamethasone on lipid metabolism in rat organs. Indian Journal of Biochemistry and Biophysics 26, 371-376.
Kedem O & Caplan SR (1965) Degree of coupling and its relation to efficiency of energy conversion. Transactions Faraday Society 21, 1897-1911.
Kerppola W (1960) Uncoupling of the oxidative phosphorylation with cortisone in liver mitochondria. Endocrinology 67, 252-263.
Kimura S & Rasmussen H (1977) Adrenal glucocorticoids, adenine nucleotide translocation, and mitochondrial calcium accumulation. Journal of Biological Chemistry 252, 1217-1225.
Kochakian CD & Robertson E (1951) Adrenal steroids and body composition. Journal of Biological Chemistry 190, 495-503.
Koski CL, Rifenberick DH & Max SR (1974) Oxidative metabolism of skeletal muscle in steroid atrophy. Archives of Neurology 31, 407-410.
Krahenbuhl S, Talos C, Fischer S & Reichen J (1994) Toxicity of bile acids on the electron transport chain of isolated rat liver mitochondria. Hepatology 19, 471-479.
Landi F, Onder G, Gambassi G, Pedone C, Carbonin P & Bernabei R (2000) Body mass index and mortality among hospitalized patients. Archives of Internal Medicine 160, 2641-2644.
Lanni A, Moreno M, Lombardi A & Goglia F (1996) Biochemical and functional differences in rat liver mitochondrial subpopulations obtained at different gravitational forces. International Journal of Biochemistry and Cell Biology 28, 337-343.
Lesourd B & Mazzari L (1997) Immune responses during recovery from protein energy malnutrition. Clinical Nutrition 16, 37-46.
Malgat M, Durrieu G & Mazat JP (1999) Enzymatic and polarographic measurements of the respiratory chain complexes. In Mitochondrial deases, pp. 357-377 [P Lestienne, editor]. Paris: Springer Verlag.
Marone JR, Falduto MT, Essig DA & Hickson RC (1994) Effects of glucocorticoids and endurance training on cytochrome oxidase expression in skeletal muscle. Journal of Applied Physiology 77, 1685-1690.
Max SR, Mill J, Mearow K, Konagaya M, Konagaya Y, Thomas JW, Banner C & Vitkovic L (1988) Dexamethasone regulates glutamine synthetase expression in rat skeletal muscles. American Journal of Physiology 255, E397-402.
Mazzuccheli MV, Confalonieri C & Schlechter P (1960) The nervous system and lipid metabolism of adipose tissue. 2. Influence of denervation on the lipogenetic activity of adrenocortical hormones. Metabolism 10, 330-334.
Michaels JE & Cardell RR (1997) Localization of glycogen phosphorylase activity in liver of fasted normal and adrenalectomized rats and in fasted adrenalectomized rats after injection of dexamethasone. Anatomical Record 248, 406-412.
Minet-Quinard R, Moinard C, Villie F, Walrand S, Vasson MP, Chopineau J & Cynober L (1999) Kinetic impairment of nitrogen and muscle glutamine metabolisms in old glucocorticoid-treated rats. American Journal of Physiology 276, E558-564.
Minet-Quinard R, Moinard C, Walrand S, Villie F, Normand B, Vasson MP, Chopineau J & Cynober L (2000) Induction of a catabolic state in rats by dexamethasone: dose or time dependency? Journal of Parenteral and Enteral Nutrition 24, 30-36.
Mitch WE, Bailey JL, Wang X, Jurkovitz C, Newby D & Price SR (1999) Evaluation of signals activating ubiquitin-proteasome proteolysis in a model of muscle wasting. American Journal of Physiology 276, C1132-1138.
Moriscot A, Rabelo R & Bianco AC (1993) Corticosterone inhibits uncoupling protein gene expression in brown adipose tissue. American Journal of Physiology 265, E81-87.
Nguyen LT, Bedu M, Caillaud D, Beaufrere B, Beaujon G, Vasson M, Coudert J & Ritz P (1999) Increased resting energy expenditure is related to plasma TNF-alpha concentration in stable COPD patients. Clinical Nutrition 18, 269-274.
Nogueira V, Rigoulet M, Piquet MA, Devin A, Fontaine E & Leverve XM (2001) Mitochondrial respiratory chain adjustment to cellular energy demand. Journal of Biological Chemistry 276, 46104-46110.
Odedra BR, Bates PC & Millward DJ (1983) Time course of the effect of catabolic doses of corticosterone on protein turnover in rat skeletal muscle and liver. Biochemical Journal 214, 617-627.
Palacios E, Pinon-Lopez MJ, Racotta IS & Racotta R (1995) Effect of lipectomy and long-term dexamethasone on visceral fat and metabolic variables in rats. Metabolism 44, 1631-1638.
Papa S, Capitanio N, Capitanio G, De Nitto E & Minuto M (1991) The cytochrome chain of mitochondria exhibits variable H+/e- stoichiometry. FEBS Letters 288, 183-186. Piquet MA, Nogueira V, Devin A, Sibille B, Filippi C, Fontaine E, Roulet M, Rigoulet M &
Leverve XM (2000) Chronic ethanol ingestion increases efficiency of oxidative phosphorylation in rat liver mitochondria. FEBS Letters 468, 239-242.
Ramsey JJ, Harper ME & Weindruch R (2000) Restriction of energy intake, energy expenditure, and aging. Free Radical Biology and Medicine 29, 946-968.
Rolfe DF & Brown GC (1997) Cellular energy utilization and molecular origin of standard metabolic rate in mammals. Physiological Reviews 77, 731-758.
Roussel D, Lhenry F, Ecochard L, Sempore B, Rouanet JL & Favier R (2000) Differential effects of endurance training and creatine depletion on regional mitochondrial adaptations in rat skeletal muscle. Biochemical Journal 350, Pt 2: 547-553.
Savary I, Debras E, Dardevet D, Rambourdin F, Vasson MP, Obled C & Grizard J (2001) Evidence for an alteration of plasma and liver proteins response to dexamethasone in aging rats. Mechanisms of Ageing and Development 122, 105-120.
Strack AM, Bradbury MJ & Dallman MF (1995) Corticosterone decreases nonshivering thermogenesis and increases lipid storage in brown adipose tissue. American Journal of Physiology 268, R183-191.
Stucki JW (1980) The optimal efficiency and the economic degrees of coupling of oxidative phosphorylation. European Journal of Biochemistry 109, 269-283.
Tataranni PA, Larson DE, Snitker S, Young JB, Flatt JP & Ravussin E (1996) Effects of glucocorticoids on energy metabolism and food intake in humans. American Journal of Physiology 271, E317-325.
Tiao G, Fagan J, Roegner V, Lieberman M, Wang JJ, Fischer JE & Hasselgren PO (1996) Energy-ubiquitin-dependent muscle proteolysis during sepsis in rats is regulated by glucocorticoids. Journal of Clinical Investigation 97, 339-348.
Tokuyama K & Himms-Hagen J (1989) Enhanced acute response to corticosterone in genetically obese (ob/ob) mice. American Journal of Physiology 257, E133-138.
Tucker HN & Miguel SG (1996) Cost containment through nutrition intervention. Nutrition Reviews 54, 111-121.
Vignos PJ & Greene R (1973) Oxidative respiration of skeletal muscle in experimental corticosteroid myopathy. Journal of Laboratory Clinical Medicine 81, 365-378.
Wakat DK & Haynes RC, Jr. (1977) Glucocorticoid-stimulated utilization of substrates in hepatic mitochondria. Archives of Biochemistry and Biophysics 184, 561-571.
Wallace JI, Schwartz RS, LaCroix AZ, Uhlmann RF & Pearlman RA (1995) Involuntary weight loss in older outpatients: incidence and clinical significance. Journal of the American Geriatrics Society 43, 329-337.
Weber CA & Kletzien RF (1982) Hormonal and nutritional factors influencing glycogen deposition in primary cultures of rat liver parenchymal cells. Journal of Cellular Physiology 110, 300-303.
Weber K, Bruck P, Mikes Z, Kupper JH, Klingenspor M & Wiesner RJ (2002) Glucocorticoid hormone stimulates mitochondrial biogenesis specifically in skeletal muscle. Endocrinology 143, 177-184.
Woodward CJ & Emery PW (1989) Energy balance in rats given chronic hormone treatment. 2. Effects of corticosterone. British Journal of Nutrition 61, 445-452.
Figure 1. Daily food intake during the last 4 days of treatment, for control (CON) (▲) and dexamethasone
(DEX)-treated (♦) rats. For details of procedure see Materials and methods section. Values expressed as the
mean for eight rats per group (standard deviation denoted by vertical bars). Significant differences indicated: † P < 0.01 vs. CON.
Figure 2. Body weight changes during the first 4 days of treatment for pair-fed (PF) (■), control (CON)
(▲) and dexamethasone (DEX)-treated (♦) rats. For details of procedure see Materials and methods section.
Values expressed as the mean for eight rats per group (standard deviation denoted by vertical bars). Significant differences indicated: † P < 0.01 vs. CON; ** P < 0.05 vs. PF.
Figure 3. State 4-oligomycin respiration normalized by the specific citrate synthase activity in liver
isolated mitochondria from pair-fed (PF), control (CON) and dexamethasone (DEX)-treated rats. For details of procedure see Materials and methods section. Values expressed as the mean for eight rats per group (standard deviation denoted by vertical bars). Significant differences indicated: ‡ P < 0.05 vs. CON; ** P < 0.05 vs. PF.
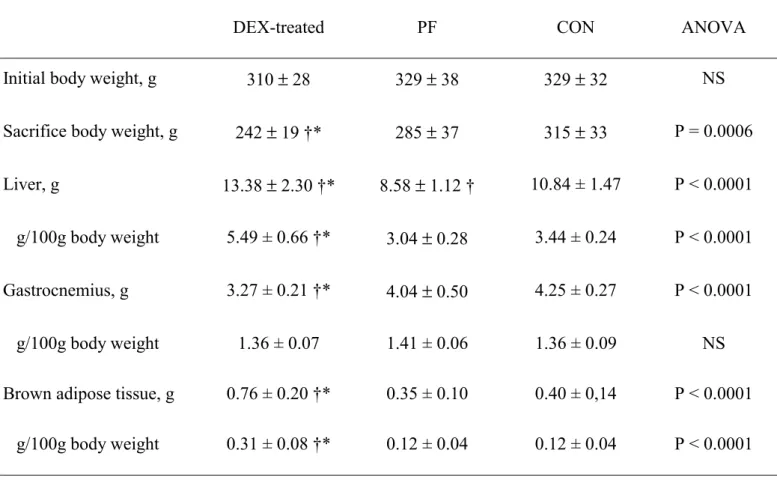
Table 1. Body weight and organ mass: liver, gastrocnemius muscle and interscapular brown adipose tissue
in pair-fed (PF), control (CON) and dexamethasone (DEX)-treated rats.
(Values expressed as mean ± standard deviation for eight rats per group)
DEX-treated PF CON ANOVA
Initial body weight, g 310 ± 28 329 ± 38 329 ± 32 NS
Sacrifice body weight, g 242 ± 19 †* 285 ± 37 315 ± 33 P = 0.0006
Liver, g 13.38 ± 2.30 †* 8.58 ± 1.12 † 10.84 ± 1.47 P < 0.0001
g/100g body weight 5.49 ± 0.66 †* 3.04 ± 0.28 3.44 ± 0.24 P < 0.0001
Gastrocnemius, g 3.27 ± 0.21 †* 4.04 ± 0.50 4.25 ± 0.27 P < 0.0001
g/100g body weight 1.36 ± 0.07 1.41 ± 0.06 1.36 ± 0.09 NS
Brown adipose tissue, g 0.76 ± 0.20 †* 0.35 ± 0.10 0.40 ± 0,14 P < 0.0001
g/100g body weight 0.31 ± 0.08 †* 0.12 ± 0.04 0.12 ± 0.04 P < 0.0001
Significant differences indicated: * P < 0.01 vs. PF, † P < 0.01 vs. CON; NS: not significant. For details of procedure see Materials and methods.
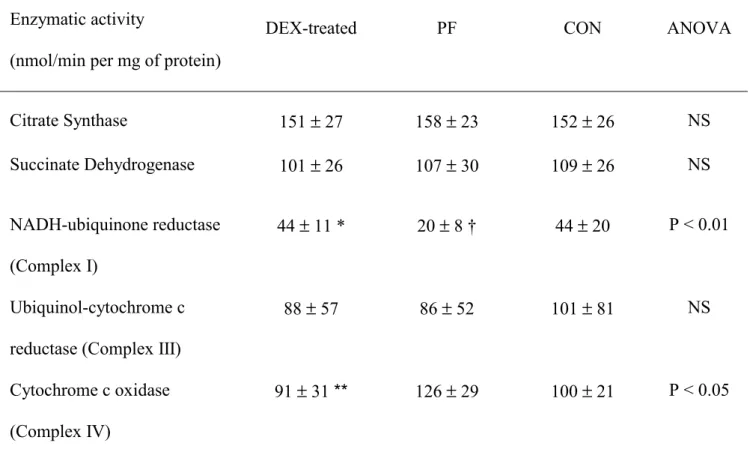
Table 2. Mitochondrial enzyme activities in liver 600 g homogenate from pair-fed (PF), control (CON)
and dexamethasone (DEX)-treated rats.
(Values expressed as mean ± standard deviation for eight rats per group)
Enzymatic activity
(nmol/min per mg of protein)
DEX-treated PF CON ANOVA
Citrate Synthase 151 ± 27 158 ± 23 152 ± 26 NS Succinate Dehydrogenase 101 ± 26 107 ± 30 109 ± 26 NS NADH-ubiquinone reductase (Complex I) 44 ± 11 * 20 ± 8 † 44 ± 20 P < 0.01 Ubiquinol-cytochrome c reductase (Complex III)
88 ± 57 86 ± 52 101 ± 81 NS
Cytochrome c oxidase (Complex IV)
91 ± 31 ** 126 ± 29 100 ± 21 P < 0.05
Significant differences indicated: * P < 0.01 vs. PF, † P < 0.01 vs. CON; ** P < 0.05 vs. PF; NS: not significant.
For details of procedures see materials and methods section.
Table 3. Mitochondrial enzyme activities in gastrocnemius muscle 600 g homogenate from pair-fed (PF),
control (CON) and dexamethasone (DEX)-treated rats. (Mean values with their standard deviation for eight rats per group) Enzymatic activity
(nmol/min per mg of protein)
DEX-treated PF CON ANOVA
Citrate Synthase 602 ± 239 653 ± 314 538 ± 183 NS Succinate Dehydrogenase 130 ± 65 147 ± 63 125 ± 49 NS NADH-ubiquinone reductase (Complex I) 111 ± 57 99 ± 76 85 ± 32 NS Ubiquinol-cytochrome c reductase (Complex III)
382 ± 190 363 ± 208 409 ± 170 NS
Cytochrome c oxidase (Complex IV)
166 ± 66 213 ± 112 194 ± 84 NS
NS: not significant.
For details of procedures see materials and methods section.
Table 4. Respiratory parameters of liver isolated mitochondria from pair-fed (PF), control (CON) and
dexamethasone (DEX)-treated rats.
(Values expressed as mean ± standard deviation for eight rats per group)
Respiratory substrates Parameters DEX-treated PF CON ANOVA
Glutamate State 3 35 ± 16 26 ± 13 43 ± 19 NS State 4 5 ± 1 5 ± 1 6 ± 1 NS RCR 7 ± 3 5 ± 3 7 ± 3 NS Uncoupled state 29 ± 17 24 ± 13 46 ± 24 NS Succinate State 3 76 ± 29 79 ± 28 98 ± 16 NS State 4 18 ± 5 14 ± 3 18 ± 2 NS RCR 4.2 ± 1.4 5.6 ± 1.4 5.4 ± 0.8 NS Uncoupled state 93 ± 26 103 ± 31 121 ± 21 NS TMPD/ascorbate State 3 131 ± 34 122 ± 13 147 ± 27 NS State 4 98 ± 26 81 ± 16 96 ± 16 NS RCR 1.3 ± 0.1 1.5 ± 0.2 1.5 ± 0.1 NS Uncoupled state 167 ± 39 163 ± 30 190 ± 41 NS NS: not significant.
State 3, state 4 and uncoupled state respiration expressed as natomes of oxygen/min per mg mitochondrial protein. For details of procedures see materials and methods section.
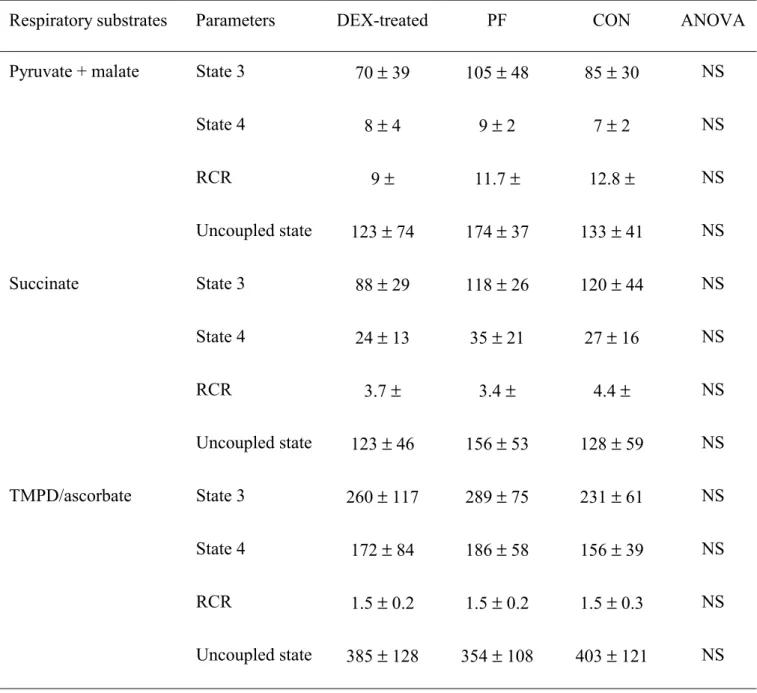
Table 5. Respiratory parameters of gastrocnemius isolated mitochondria from pair-fed (PF), control
(CON) and dexamethasone (DEX)-treated rats.
(Values expressed as mean ± standard deviation for eight rats per group)
Respiratory substrates Parameters DEX-treated PF CON ANOVA
Pyruvate + malate State 3 70 ± 39 105 ± 48 85 ± 30 NS
State 4 8 ± 4 9 ± 2 7 ± 2 NS RCR 9 ± 11.7 ± 12.8 ± NS Uncoupled state 123 ± 74 174 ± 37 133 ± 41 NS Succinate State 3 88 ± 29 118 ± 26 120 ± 44 NS State 4 24 ± 13 35 ± 21 27 ± 16 NS RCR 3.7 ± 3.4 ± 4.4 ± NS Uncoupled state 123 ± 46 156 ± 53 128 ± 59 NS TMPD/ascorbate State 3 260 ± 117 289 ± 75 231 ± 61 NS State 4 172 ± 84 186 ± 58 156 ± 39 NS RCR 1.5 ± 0.2 1.5 ± 0.2 1.5 ± 0.3 NS Uncoupled state 385 ± 128 354 ± 108 403 ± 121 NS NS: not significant.
State 3, state 4 and uncoupled state respiration expressed as natomes of oxygen/min per mg mitochondrial protein. For details of procedures see materials and methods section.
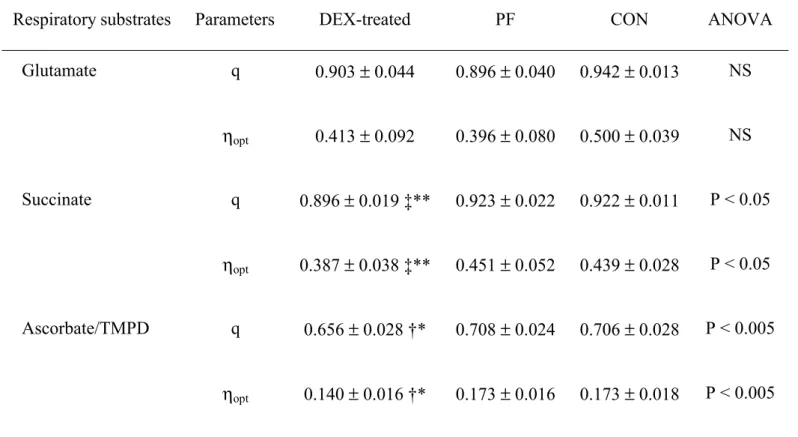
Table 6. Thermodynamic degree of coupling (q ) and optimal efficiency (ηηηηopt ) of the oxidative
phosphorylation in liver isolated mitochondria from pair-fed (PF), control (CON) and dexamethasone (DEX)-treated rats.
(Values expressed as mean ± standard deviation for eight rats per group)
Respiratory substrates Parameters DEX-treated PF CON ANOVA
Glutamate q 0.903 ± 0.044 0.896 ± 0.040 0.942 ± 0.013 NS ηopt 0.413 ± 0.092 0.396 ± 0.080 0.500 ± 0.039 NS Succinate q 0.896 ± 0.019 ‡** 0.923 ± 0.022 0.922 ± 0.011 P < 0.05 ηopt 0.387 ± 0.038 ‡** 0.451 ± 0.052 0.439 ± 0.028 P < 0.05 Ascorbate/TMPD q 0.656 ± 0.028 †* 0.708 ± 0.024 0.706 ± 0.028 P < 0.005 ηopt 0.140 ± 0.016 †* 0.173 ± 0.016 0.173 ± 0.018 P < 0.005
Significant differences indicated: ** P < 0.05 vs. PF; ‡ P < 0.05 vs. CON; * P < 0.01 vs. PF; † P < 0.01 vs. CON. NS: not significant.
For details of procedures see materials and methods section.
Table 7. Thermodynamic degree of coupling (q ) and optimal efficiency (ηηηηopt ) of the oxidative
phosphorylation in gastrocnemius isolated mitochondria from pair-fed (PF), control (CON) and dexamethasone (DEX)-treated rats.
(Values expressed as mean ± standard deviation for eight rats per group)
Respiratory substrates Parameters DEX-treated PF CON ANOVA
Pyruvate + malate q 0.966 ± 0.011 0.972 ± 0.016 0.972 ± 0.011 NS ηopt 0.593 ± 0.059 0.635 ± 0.089 0.628 ± 0.059 NS Succinate q 0.889 ± 0.039 0.880 ± 0.052 0.887 ± 0.036 NS ηopt 0.400 ± 0.076 0.374 ± 0.105 0.377 ± 0.064 NS Ascorbate/TMPD q 0.749 ± 0.073 0.713 ± 0.025 0.774 ± 0.050 NS ηopt 0.214 ± 0.083 0.176 ± 0.017 0.229 ± 0.051 NS NS: not significant.
For details of procedures see materials and methods section.
37
0
5
10
15
20
25
30
35
day
1
day
2
day
3
day
4
food intake (g)
† † †38
75
80
85
90
95
10
0
10
5
d
a
y 0
d
ay
1
d
ay
2
d
ay
3
d
ay
4
relative body weight (%)
†
†
†
†**
†**
†**
†**
39 gl ut am at e succi nat e ascorbat e/ TMP D State 4-olig omycine respir ation (10e -3 natomes O/nmoles) b a b 0 5 10 15 20 25 a b b 0 10 20 30 40 50 60 70 80 90 100 a, b b a 0 100 200 300 400 500 600 DEX-t reat ed PF CON