HAL Id: inserm-02518882
https://www.hal.inserm.fr/inserm-02518882
Submitted on 25 Mar 2020HAL is a multi-disciplinary open access archive for the deposit and dissemination of sci-entific research documents, whether they are pub-lished or not. The documents may come from teaching and research institutions in France or abroad, or from public or private research centers.
L’archive ouverte pluridisciplinaire HAL, est destinée au dépôt et à la diffusion de documents scientifiques de niveau recherche, publiés ou non, émanant des établissements d’enseignement et de recherche français ou étrangers, des laboratoires publics ou privés.
Na+/H+ exchanger isoform 1-induced osteopontin
expression facilitates cardiac hypertrophy through p90
ribosomal S6 kinase
Nabeel Abdulrahman, Beatrice Jaspard-Vinassa, Larry Fliegel, Aayesha
Jabeen, Sadaf Riaz, Alain-Pierre Gadeau, Fatima Mraiche
To cite this version:
Nabeel Abdulrahman, Beatrice Jaspard-Vinassa, Larry Fliegel, Aayesha Jabeen, Sadaf Riaz, et al.. Na+/H+ exchanger isoform 1-induced osteopontin expression facilitates cardiac hypertrophy through p90 ribosomal S6 kinase. Physiological Genomics, American Physiological Society, 2018, 50 (5), pp.332-342. �10.1152/physiolgenomics.00133.2017�. �inserm-02518882�
Na+/H+ exchanger isoform 1-induced osteopontin expression facilitates
cardiac hypertrophy through p90 ribosomal S6 kinase
Nabeel Abdulrahman1, Beatrice Jaspard-Vinassa2, Larry Fliegel3, Aayesha Jabeen1, Sadaf Riaz1, Alain-Pierre Gadeau2, and Fatima Mraiche1
1College of Pharmacy, Qatar University, Doha, Qatar;
2University of Bordeaux, INSERM, Biology of Cardiovascular Disease, U1034, Pessac, France; 3Department of Biochemistry, Faculty of Medicine and Dentistry, University of Alberta,
Edmonton, Alberta, Canada
ABSTRACT
Cardiovascular diseases are the leading cause of death worldwide. One in three cases of heart failure is due to dilated cardiomyopathy. The Na+/H+ exchanger isoform 1 (NHE1), a
multifunctional protein and the key pH regulator in the heart, has been demonstrated to be increased in this condition. We have previously demonstrated that elevated NHE1 activity induced cardiac hypertrophy in vivo. Furthermore, the overexpression of active NHE1 elicited modulation of gene expression in cardiomyocytes including an upregulation of myocardial osteopontin (OPN) expression. To determine the role of OPN in inducing NHE1-mediated cardiomyocyte hypertrophy, double transgenic mice expressing active NHE1 and OPN knockout were generated and assessed by echocardiography and the cardiac phenotype. Our studies showed that hearts expressing active NHE1 exhibited cardiac remodeling indicated by increased systolic and diastolic left ventricular internal diameter and increased ventricular volume. Moreover, these hearts demonstrated impaired function with decreased fractional shortening and ejection fraction. Atrial natriuretic peptide (ANP) and brain natriuretic peptide (BNP) mRNA was upregulated, and there was an increase in heart cell cross-sectional area confirming the cardiac hypertrophic effect. Moreover, NHE1 transgenic mice also showed increased collagen deposition, upregulation of CD44 and phosphorylation of p90 ribosomal s6 kinase (RSK), effects that were regressed in OPN knockout mice. In conclusion, we
developed an interesting comparative model of active NHE1 transgenic mouse lines which express a dilated hypertrophic phenotype expressing CD44 and phosphorylated RSK, effects which were regressed in absence of OPN.
INTRODUCTION
Cardiovascular diseases (CVD) are the leading cause of death globally with an expectation of more than 23.6 million deaths per year by 2030. Mortality due to CVD represented 31% of all global deaths in the year 2013 (42). Cardiac hypertrophy is a type of cardiac remodeling characterized by enlargement of heart and individual myocytes. Cardiac hypertrophy is either due to physiological (pregnancy, exercise) or pathological (hypertension, ischemia)
conditions. Cardiac hypertrophy is a compensatory mechanism by the heart to adapt with the hemodynamic load exerted and, if prolonged, may result in heart failure (15, 26, 33).
Na+/H+ Exchanger Isoform 1 Induces Cardiac Hypertrophy
Na+/H+ exchangers are membrane proteins that function to regulate intracellular pH by extruding intracellular H+ in exchange of one extracellular Na+ (6, 24). Previous studies have reported that enhanced activity of Na+/H+ exchanger isoform 1 (NHE1), a cardiac-specific form of Na+/H+ exchanger family, promotes cardiac hypertrophy (44). Furthermore, inhibition
of Na+/H+ exchanger activity attenuated the characteristics of isoproterenol induced cardiac hypertrophy in rats (5). Moreover, NHE1 inhibition resulted in glycogen synthase 3-β activation and respective attenuation of hypertrophy in neonatal cardiomyocytes (12). A recent study has reported that specific silencing of myocardial NHE1 with short hairpin RNA is a therapeutic strategy to reduce cardiac hypertrophy (25). Another recent study has
demonstrated that an inhibitor of renal sodium glucose transporter (SGLT) 2, empagliflozin, has an effect on regulating intracellular ion homeostasis in cardiomyocytes through direct interaction with Na+/H+ exchanger without the involvement of SGLTs (1). Unfortunately, the positive results seen in animal model were not accomplished in clinical trials, where the administration of a NHE1 inhibitor produced serious cerebrovascular side-effects in patients with coronary heart disease (13). Therefore, exploring the signaling pathways downstream of NHE1 promoting cardiac hypertrophy would be highly desirable, resulting in an indirect inhibition of NHE1 and thereby evading the undesired side-effects of NHE1 inhibitors.
Osteopontin Mediates NHE1-induced Cardiac Hypertrophy
It was reported that activated NHE1 protein resulted in an increased activation of osteopontin (OPN) (44), a multifunctional protein that acts as a mediator in various cardiovascular
diseases (41) and whose expression is found to be increased in conditions that promote cardiac hypertrophy (10, 43). Furthermore, an increase in OPN expression is seen in a Type 2 diabetes mellitus embryopathy model inducing cardiac fibrosis and hypertrophy (16).
Moreover, serum- and glucocorticoid-inducible kinase (sgk1)-mediated cardiac hypertrophy and elevated NHE1 expression induced by dexamethasone are accompanied by increased OPN expression (40). Furthermore, it was demonstrated that NHE1-induced cardiac hypertrophy is mediated by OPN through the calcineurin/nuclear factor of activated T cell (NFAT) pathway (22). This infers that OPN is a regulator in NHE1-induced cardiac hypertrophy, and OPN will be a therapeutic target to cardiac hypertrophy. Therefore, experiments were performed on transgenic mice overexpressing NHE1 and OPN knockout overexpressing NHE1 mice to delineate signaling mechanisms by which NHE1 induces OPN expression and thereby contributes to cardiac hypertrophy.
p90 Ribosomal s6 Kinase as a Link between NHE1 and OPN?
Members of mitogen-activated protein kinase (MAPK) pathway including extracellular signal regulated kinase (ERK) and its downstream effectors have been implicated to play significant functions in pathogenesis of cardiac hypertrophy and heart failure (37). Previous research has demonstrated that the ERK pathway of the MAPK cascade activates NHE1 in response to growth factors (2). Moreover, foregoing studies have established that p90 ribosomal s6 kinase (RSK), a downstream mediator of ERK, is a mediator of Na+/H+ exchange activity (34, 36).
Therefore, we hypothesize that NHE1-induced cardiac hypertrophy mediated by OPN involves the activation of RSK. To support our hypothesis, characteristics and biomarkers of cardiac hypertrophy, activation of RSK, were analyzed and compared in wild-type (WT) mice, NHE1 overexpressing transgenic mice, OPN knockout NHE1 transgenic mice, and in OPN knockout mice. We found that overexpression of NHE1 induced cardiac hypertrophy manifested by increased ANP and BNP mRNA expression, increased heart cell cross-sectional area, and increased collagen deposition. The collagen deposition was significantly reduced when OPN was knocked out emphasizing the role of OPN in NHE1-induced cardiac hypertrophy. NHE1 overexpression also increased phosphorylation of RSK, which was regressed in the absence of OPN.
MATERIALS AND METHODS Materials
All routine chemicals were purchased from BD Biosciences (San Jose, CA), Fisher Scientific (Ottawa, ON, Canada), or Sigma (St. Louis, MO). Primary antibodies used for Western blotting included rabbit antibody connexin 43 (c6219, Sigma), rabbit antibody NFAT c4 (13036, Santa Cruz), rabbit antibody phospho-ERK 1/2 (9101, Cell Signaling), rabbit antibody ERK 1/2 (9102, Cell Signaling), rabbit antibody phospho p90RSK (9341, Cell Signaling), goat antibody RSK2 (1430, Santa Cruz), rabbit antibody α-tubulin (4074, Abcam), and mouse antibody α-tubulin (T5168, Sigma). Secondary antibodies were purchased from Jackson laboratories and Abcam.
Mice
NHE1-overexpressing FVB mice were produced by CNRS, SEAT/UPS 44, Villejuif, France. They were generated by transgenesis of a plasmid overexpressing specifically in cardiac muscle cells, a hemagglutinin (HA)-tagged human NHE1, rendered constitutively active by a mutation of the binding domain of calmodulin that normally causes auto inhibition of NHE1 (11). Mice genotyping was performed by standard PCR followed by agarose gel
electrophoresis with primers (forward: GAGACCGAGCAGGAGCTCGAG) and (reverse: CAGGTCCACAGACTCGGGTG), for characterizing NHE1 mutant.
OPN-deficient mice (OPN−/−) were obtained from Suzan Rittling (Forsyth Institute, Harvard Medical School) and transferred to FVB background. Mice genotyping was performed as previously described using primers (AATATGCGAAGTGGACCTGG) and
(GATCAAGCCATAGCCCTTCA) to characterize OPN interruption, and primers
(TCCAATGAAAGCCATGACC) and (GAAGAGTGAGTGAATCTGC) to detect WT OPN (29). We produced FVB double transgenic mice expressing mutated NHE1 in OPN−/− and verified genotype by PCR with primers described above.
Mice were handled in the animal facility of INSERM U1034 in accordance with the
guidelines established by French Ministry of Agriculture and complying with European Union regulations (license no. B33-318-701). Blinding was achieved by use of a numbering system, whereby each mouse was assigned a specific number, which was not revealed to the
individual analyzing the data. The protocol of this project was approved under no. 5012018A by the local Animal Care and Use Committee of Direction Départementale de la Protection des Populations. The Institutional Animal Care and Use Committee at Qatar University, Doha, Qatar, specifically approved this project (Research Ethics Approval Number: QU-IACUC 007/2012).
Western Blot Analysis
Heart tissues were lysed in ice-cold RIPA buffer along with protease inhibitors. Sonication (Branson SLPe) for a few seconds at 20% amplitude facilitated the lysis. Tissue lysates were centrifuged at 12,000 rpm for 15 min at 4°C. The supernatant containing protein was collected and assayed with Bio-Rad DC protein assay kit to determine the concentration. Protein
samples (30–40 μg) were denatured by heating at 95°C for 5 min in Laemmli buffer. The samples were then loaded on to SDS polyacrylamide gels. After the run, separated protein samples were transferred on to a nitrocellulose membrane. The membranes were incubated
with 5% (wt/vol) nonfat milk or bovine serum albumin, in Tris buffer saline, pH 7.4, with 0.1% Tween 20 for at least 1 h at room temperature. Following the blocking stage, the membranes were incubated overnight at 4°C with primary antibodies, namely, anti-connexin 43, anti-NFAT, anti-pERK, anti-ERK, anti-pRSK, and anti-RSK2. α-Tubulin served as a loading control. The membranes were then incubated with horseradish peroxidase-conjugated secondary antibodies at room temperature for 1 h and 30 min. Visualization of bands was based on enhanced chemiluminescence reaction. Imaging was done by Fluorchem M FM0564 imager and quantification of bands was performed with Scion software.
Reverse Transcription Quantitative PCR
RNAs were isolated by using Tri Reagent (Molecular Research Center), from cardiac muscle that had been snap-frozen in liquid nitrogen and homogenized, as instructed by the
manufacturer. For quantitative RT-PCR analysis, total RNA was reverse transcribed with M-MLV reverse transcriptase (Promega) and amplification was performed on a DNA Engine Opticon2 (MJ Research) using B-R SYBER Green SuperMix (Quanta Biosciences). The primers used are shown in Table 1. The relative expression of each mRNA was calculated by the comparative threshold cycle method and normalized to β-actin mRNA expression.
Table 1. List of primers used in quantitative PCR Enlarge table
Histology and Immunohistochemistry
The mouse hearts were fixed in methanol and embedded in paraffin. Paraffin blocks were sectioned in to 7 μm sections and dried overnight. The sections were then deparaffinized with xylene and rehydrated, after xylene removal, with alcohol.
Masson’s trichrome staining.
Sections were dipped successively 1) 30 s in hematoxylin and washed 5 min in water, 2) 1 min in acidic fuchsin and washed twice for 2 min in acetified water, 3) 5 min in
phosphomolybdic acid and washed quickly in acetified water, 4) 2 min in light green stain and washed twice quickly in acetified water. Finally, sections were dehydrated by rapid bath in ethanol and xylene and covered by coverslip with a xylene containing mounting resin.
Picrosirius red staining.
Sections were incubated for 1 h in Sirius red solution (1 g Sirius red F3B, Sigma-Aldrich) in 1 l of saturated aqueous solution of picric acid) and then washed twice with acidified water (0.5% acetic acid). Sections were than dehydrated by rapid bath in ethanol and in xylene and covered by coverslip with a xylene containing mounting resin. Observation was done with bright-field microscope (Nikon). Collagen appeared in red on a pale yellow background. Quantitative analysis was performed with Image J software.
Wheat germ hemagglutinin.
Wheat germ hemagglutinin (WGA) binds on interstitial matrix. Sections were incubated 1 h in the dark with lectin from triticum vulgaris FITC conjugate (# L4895; Sigma-Aldrich, St.
Louis, MO) diluted 1:100 (10 µg/ml) in the required buffer. After three washing steps, the sections were covered by coverslip with a water-soluble antifading mounting medium
containing DAPI. Observation was done with fluorescent microscope (Zeiss). FITC appeared in green, and DAPI stained nuclei blue. Axiovision was used for cell area measurement.
Immunohistology.
The antigens were retrieved with Ventana CC1 buffer (Tris/EDTA buffer, pH 8) by treating the sections for 4 min at 95°C and then for 12 min at 100°C. The endogenous peroxidase was quenched with 3% H2O2 in PBS for 30 min. Heart sections were then blocked with Ab
Diluent (ROCHE) for at least 20–30 min in a moist chamber. The sections were then probed with primary antibodies to HA tag, connexin 43 and CD44, in Ab Diluent (ROCHE) for 1 h at 37°C. Biotinylated anti-rabbit IgG secondary antibody (RPN1004V, GE Healthcare) was then added at a dilution of 1:100 in Ab diluent (ROCHE) for 1 h at 37°C. Finally, the
3,3-diaminobenzidine (DAB) kit was used. The nuclei were counterstained with hematoxylin. Images were acquired on NIKON microphot-FXA.
Transthoracic Echocardiography
Mice were lightly anesthetized with 1.5% isoflurane. Echocardiography was performed with Vevo 2100 high-frequency high-resolution ultrasound system (Fujifilm VisualSonics) to measure the lengths of interventricular septum in systole (IVSs), interventricular septum in diastole (IVSd), left ventricular internal diameter in systole (LVIDs), left ventricular internal diameter in diastole (LVIDd), left ventricular posterior wall in systole (LVPWs), left
ventricular posterior wall in diastole (LVPWd), ejection fraction (EF), fractional shortening (FS), and volumes of left ventricle in systole (LVs) and in diastole (LVd). The percentage of left ventricular (LV) fractional shortening (% FS) was defined as % FS = [(LVIDd − LVIDs) / LVIDd] * 100.
Statistical Analysis
All values expressed were compared with control ± SE. Student’s t-test was used to compute differences between groups where a P < 0.05 was considered a significant difference.
Bonferroni correction was utilized for analyzing multiple samples wherever applicable.
RESULTS
Characteristics of NHE1 Transgenic Mice
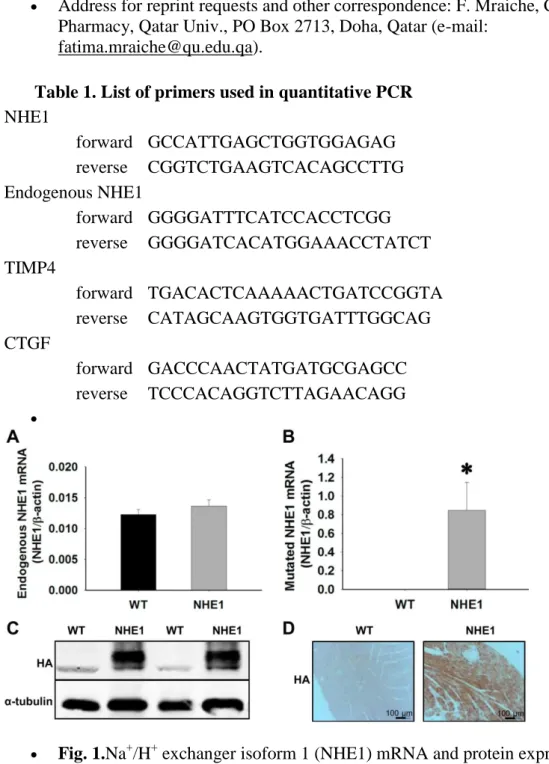
To determine the expression of NHE1 mRNA and protein in NHE1 transgenic mice, quantitative PCR, immunohistochemical analysis, and Western blot techniques were used. Figure 1A shows an increase in the ratio of endogenous NHE1 mRNA expression to β-actin, when compared with the WT (0.0122 ± 0.0008 WT vs. 0.0137 ± 0.001 NHE1). However, this increase was not significant, whereas the ratio of mutated or exogenous NHE1 mRNA
expression to β-actin was significantly increased when compared with the WT (0.85 ± 0.3 NHE1; P = 0.02) (Fig. 1B). Protein expression of NHE1 was also confirmed by Western blot and immunostaining, where anti-hemagglutinin (HA) tag binds to the HA portion of NHE1 protein (Fig. 1, C and D).
Heart Overexpression of NHE1 Modulates Extracellular Matrix Degradation, Transcription Factor Expression, Metabolism, and Inflammation of Cardiac Tissue
It is known that NHE1 overexpression induces cardiac hypertrophy. Signaling pathways that mediate this effect have yet to be understood. Quantitative PCR, immunohistochemical staining, and Western blot techniques were used to analyze extracellular matrix (ECM) degradation, transcription factors expression, metabolism, and inflammation. Figure 2A demonstrates the modulation of various genes involved in the ECM degradation in NHE1 transgenic mice. Metalloproteinase inhibitor 4 (TIMP4) mRNA expression was significantly reduced in NHE1 transgenic mice when compared with WT (0.0070 ± 0.00060 WT vs. 0.0035 ± 0.0004 NHE1; P < 0.001). Connective tissue growth factor (CTGF) (0.2030 ± 0.0306 WT vs. 0.5978 ± 0.1063 NHE1; P = 0.0057) and integrin-β3 (0.0005 ± 0.0001 WT vs. 0.0013 ± 0.0003 NHE1; P = 0.036) mRNA expression showed a significant increase in NHE1 group compared with the WT. The mRNA expressions of collagen3A (Col3A) (0.0901 ± 0.0151 WT vs. 0.0599 ± 0.0108 NHE1), collagen1 (Col1) (0.0320 ± 0.0049 WT vs. 0.0983 ± 0.0270 NHE1), and matrix metalloproteases 2 (MMP2) (0.0890 ± 0.0073 WT vs. 0.1326 ± 0.0233 NHE1) show no difference between NHE1 and WT groups.
The mRNA expression of transcription factors cFOS (0.0026 ± 0.0008 WT vs. 0.0056 ± 0.0012 NHE1), signal transducer and activator of transcription 3 (STAT3) (0.4624 ± 0.0810 WT vs. 0.5689 ± 0.1553 NHE1), and cyclic adenosine monophosphate response element binding protein (CREB) (0.0050 ± 0.0003 WT vs. 0.0036 ± 0.0008 NHE1) also show no difference between NHE1 and WT (Fig. 2B). The mRNA levels of peroxisome proliferator-activated receptor alpha (PPAR-α) and peroxisome proliferator-proliferator-activated receptor gamma coactivator 1-alpha (PGC-1α) in active NHE1 group are reduced compared with WT group, where the reduction is significant for PPAR-α (0.0494 ± 0.0068 WT vs. 0.0273 ± 0.0032 NHE1; P = 0.017) and PGC-1α (0.1042 ± 0.0153 WT vs. 0.0532 ± 0.0069 NHE1; P = 0.015) as demonstrated in Fig. 2C. Figure 2D demonstrates that gene expression of interleukin 6 (IL-6) has a significant increase in NHE1 group when related to WT (0.0001 ± 2.025 × 10⁻⁵ WT vs. 0.0008 ± 0.0002 NHE1; P = 0.0032). As in agreement with previous data, we have demonstrated that OPN mRNA expression is strongly increased in NHE1 group (0.00072 ± 0.00019 WT vs. 0.0016 ± 0.00017 NHE1; P = 0.0026) (Fig. 2E). As a control we verified that there is no more OPN expression detected in OPN−/− mice.
Furthermore, the mRNA levels of serum and glucocorticoid-regulated kinase 1 (SGK1) (0.0668 ± 0.0082 WT vs. 0.0416 ± 0.0043 NHE1; P = 0.024), protein expression of connexin 43 (100 ± 11.39% WT vs. 22.82 ± 3.04% NHE1; P = 0.023), and nuclear factor of activated T cells (NFAT) (100 ± 6.84% WT vs. 47.90 ± 10.08% NHE1; P = 0.0014) were also
investigated and found to be significantly reduced in the NHE1 group when compared with control (Fig. 2, F–H). The NHE1 group also showed a significant increase in phosphorylation of ERK when compared with WT (100 ± 11.97% WT vs. 282.84 ± 50.95% NHE1; P = 0.021) (Fig. 2I).
Overexpression of NHE1 in the Heart Increases CD 44 Protein Expression through OPN
Immunohistochemistry images of heart sections demonstrate that CD 44 was highly expressed in NHE1 transgenic mice when compared with WT (Fig. 3A). This was further confirmed by qPCR (CD 44 mRNA: 0.0047 ± 0.0004 WT vs. 0.0096 ± 0.0010 NHE1; P < 0.001) (Fig. 3B). Immunostaining and quantitative PCR results also show that the increase in CD 44 expression in NHE1 transgenic mice was inhibited in OPN knockout NHE1 transgenic mice (0.0096 ±
0.0010 NHE1 vs. 0.0057 ± 0.0007 NHE1 OPN−/−; P = 0.0073), explaining the role of OPN in the expression of CD 44. CD 44 mRNA expression was also significantly reduced in OPN−/− mice when compared with NHE1 overexpressed mice (0.0096 ± 0.0010 NHE1 vs. 0.0049 ± 0.00074 OPN−/−; P = 0.002).
Heart Overexpression of NHE1 Increases Phosphorylation of p90 Ribosomal S6 Kinase
Western blot image (Fig. 4A) and its quantification (Fig. 4B) demonstrate that NHE1 transgenic mice showed increased phosphorylation of p90RSK (100 ± 10.21% WT vs.
346.95 ± 82.98% NHE1; P = 0.016), the effect of which was significantly reduced when OPN was knocked out (346.95 ± 82.98% NHE1 vs. 82.17 ± 24.18% NHE1 OPN−/−; P = 0.012), indicating the importance of OPN in phosphorylation of RSK. Phosphorylation of RSK was also significantly reduced in OPN−/− mice when compared with NHE1-overexpressed mice (346.95 ± 82.98% NHE1 vs. 134.45 ± 31.54 OPN−/−; P = 0.03).
OPN Knockout Regressed Collagen Deposition in NHE1-expressing Transgenic Mice
Cardiac hypertrophic markers including ANP and BNP mRNA expression, cardiac cross-sectional cell area and collagen deposition were assessed to determine the effect of
overexpression of NHE1 in the heart. Figure 5A depicts an increase in the whole heart size of NHE1 transgenic mice when compared with the WT. Figure 5B is Masson’s trichrome staining and Fig. 5E is Picrosirius red staining of collagen, which showed a significant increase in collagen deposition in the heart cross sections of NHE1 group (2.9 ± 0.28 WT vs. 9.1 ± 0.75 NHE1; P < 0.001) and NHE1 OPN−/− group (2.9 ± 0.28 WT vs. 6.2 ± 0.19 NHE1 OPN−/−; P < 0.001). Figure 5C shows that there is a significant increase in the ANP (0.6951 ± 0.18 WT vs. 35.32 ± 5.59 NHE1; P < 0.001) and BNP (3.41 ± 0.70 WT vs. 9.19 ± 1.10 NHE1; P < 0.001) mRNA expression in the NHE1 transgenic mice. ANP (0.6951 ± 0.18 WT vs. 30.42 ± 2.84 NHE1 OPN−/−; P < 0.001) and BNP (3.41 ± 0.70 WT vs. 9.45 ± 1.54 NHE1 OPN−/−; P = 0.0067) mRNA expression also showed significant increase in NHE1 OPN−/− when compared with WT. However, both ANP (35.32 ± 5.59 NHE1 vs. 0.35 OPN−/− ; P < 0.001) and BNP (9.19 ± 1.10 NHE1 vs. 2.23 ± 0.32 OPN−/−; P < 0.001) mRNA expression was significantly reduced in OPN−/− when compared with NHE1 transgenic mice. Areas of cells of the internal part of the heart (100 ± 6.59% WT vs. 162.25 ± 37.01% NHE1; P = 0.051) and of the external part of the heart (100 ± 9.39% WT vs. 169.02 ± 30.75% NHE1; P = 0.021) were measured after WGA staining of heart sections. The NHE1 group showed a significant increase over WT (Fig. 5D). The NHE1 OPN−/− also showed significant increase in cell area of internal (100 ± 6.59% WT vs. 147.01 ± 11.64 NHE1 OPN−/−; P = 0.0013) and external (100 ± 9.39% WT vs. 167.92 ± 7.44 NHE1 OPN−/−; P < 0.001) parts of the heart when compared with WT. Moreover, cell areas of internal (162.25 ± 37.01% NHE1 vs. 84.23 ± 9.35% OPN−/−; P = 0.026) and external (169.02 ± 30.75% NHE1 vs. 99.35 ± 15.44% OPN−/−; P = 0.019) parts of the heart also showed significant reduction in OPN−/− mice when compared with NHE1 transgenic mice. Altogether, our results show that stimulation of NHE1 leads to cardiac hypertrophy, but this increase was not reversed when OPN was knocked out in the presence of NHE1 overexpression. However, there was a decrease in cardiac
hypertrophic parameters in OPN−/− when compared with NHE1-overexpressed transgenic mice.
Interestingly, we also show that when NHE1 and NHE1 OPN−/− groups were compared, collagen deposition was significantly reduced when OPN was knocked out in NHE1 transgenic mice (9.1 ± 0.75 NHE1 vs. 6.2 ± 0.19 NHE1 OPN−/−; P = 0.0031) (Fig. 5E).
Moreover, we also show that collagen deposition was significantly reduced in OPN−/− mice when compared with NHE1 transgenic mice (9.1 ± 0.75 NHE1 vs. 2.3 ± 0.18 OPN−/−; P < 0.001).
Heart Overexpression of NHE1 Degrades Echocardiographic Parameters
To determine the effect of heart overexpression of NHE1 in transgenic mice over WT mice, echocardiography was performed to measure lengths of interventricular septum in systole (IVSs), interventricular septum in diastole (IVSd), left ventricular internal diameter in systole (LVIDs), left ventricular internal diameter in diastole (LVIDd), left ventricular posterior wall in systole (LVPWs), left ventricular posterior wall in diastole (LVPWd), ejection fraction (EF), fractional shortening (FS), and volumes of left ventricle in systole (LVs) and in diastole (LVd). Figure 6, A and C, respectively, shows that the LVIDs (2.56 ± 0.09 WT vs. 3.42 ± 0.15 NHE1; P < 0.001), LVIDd (3.62 ± 0.08 WT vs. 4.08 ± 0.11 NHE1; P = 0.0043), LVs (24.09 ± 1.95 WT vs. 49.12 ± 5.30 NHE1; P = 0.0012), and LVd (55.70 ± 2.97 WT vs. 74.12 ± 4.94 NHE1; P = 0.0069) were significantly increased for NHE1 group compared with WT.
Moreover, EF (56.63 ± 2.79 WT vs. 34.95 ± 2.69 NHE1; P < 0.001) and FS (29.32 ± 1.96 WT vs. 16.56 ± 1.40 NHE1; P < 0.001) of ventricle were significantly reduced in the NHE1 group compared with WT as shown in Fig. 6B. However, LVIDs remained significantly increased in NHE1 transgenic mouse even when OPN was knocked out (2.56 ± 0.0854 WT vs. 3.69 ± 0.26 NHE1 OPN−/−; P = 0.0046) (Fig. 6A). Furthermore, EF (56.63 ± 2.79 WT vs. 30.18 ± 4.17; P < 0.001) and FS (29.32 ± 1.96 WT vs. 14.18 ± 2.07; P < 0.001) were significantly reduced in NHE1 OPN−/− compared with WT (Fig. 6B). When we compared the NHE1 group against OPN−/−, LVIDs (3.42 ± 0.15 NHE1 vs. 2.31 ± 0.13; P < 0.001), LVIDd (4.08 ± 0.11 NHE1 vs. 3.56 ± 0.09 OPN−/−; P = 0.002), LVs (49.12 ± 5.30 NHE1 vs. 19.21 ± 2.56 OPN−/−; P < 0.001), and LVd (74.12 ± 4.94 NHE1 vs. 53.52 ± 3.43 OPN−/−; P = 0.0039) were all significantly reduced in OPN−/− mice. Moreover, EF (34.95 ± 2.69 NHE1 vs. 64.70 ± 3.82 OPN−/−; P < 0.001) and FS (16.56 ± 1.40 NHE1 vs. 35.45 ± 3.03 OPN−/−; P < 0.001) were significantly increased in OPN−/− when compared with NHE1 transgenic mice.
DISCUSSION
Cardiac hypertrophy is associated with increased expression of active NHE1 and OPN (10, 43, 44). However, a recent finding demonstrated that plasma OPN level is significantly increased in dilated cardiomyopathy subtype rather than hypertrophic cardiomyopathy, indicating that plasma OPN level is associated with overall heart failure severity (28). Our previous research had demonstrated that OPN is involved as a regulator in NHE1-induced cardiac hypertrophy in vitro (22, 23). Moreover, we had previously described that OPN is increased in cardiomyocytes expressing active NHE1, and this increase is attributed partly by RSK (23). We hypothesized that OPN would be a key regulator and a therapeutic target in NHE1 induced cardiac hypertrophy. To support our hypothesis, we performed experiments on WT mice, NHE1-overexpressing transgenic mice, NHE1-overexpressing OPN knockout mice, and in OPN knockout mice, to delineate the signaling mechanisms involved in NHE1-induced cardiac hypertrophy.
Overexpression of Active NHE1 Induces Cardiac Hypertrophy
We investigated the effects of elevated expression of active NHE1 on the myocardium of mice. Transgenic mice expressing active NHE1 showed significant changes in cardiac
and increased interstitial fibrosis (Fig. 5), which are in accordance with previous reports (24, 44).
Elevated expression and activity of NHE1 also result in cardiac remodeling by regulating matrix metalloproteases (MMPs) and tissue inhibitor of metalloproteases (TIMPs) (44). We observed that expression of TIMP4 was significantly reduced in NHE1-overexpressed transgenic mice, which is in agreement with a previous study that reported decreased TIMP4 in compensatory heart (9). Our results show that PPARα and PGC1α were found to be
downregulated in NHE1-overexpressed transgenic mice (Fig. 2C), which is in agreement with a previous study performed on failing hearts from patients with dilated cardiomyopathies (30). A previous study demonstrated the role of SGK1 in NHE expression and activity, as well as its involvement in contributing various indices of cardiac hypertrophy including ANP mRNA expression, collagen deposition, and decreased EF finally leading to cardiac remodeling and heart failure (39). Moreover, it has been reported that SGK1 is involved in inflammatory, fibrotic, and oxidative pathways leading to cardiac hypertrophy (19). In contrast, our results demonstrate that NHE1-overexpressed transgenic mice showed a decreased expression of SGK1 (Fig. 2F). Previous research indicated that IL-6 mediates cardiac remodeling and cardiac hypertrophy (8, 21, 27), which is in accordance with our study, which showed an upregulation of IL-6 in NHE1-overexpressed transgenic mice (Fig. 2D). We show a decrease in connexin 43 protein in NHE1-overexpressed transgenic mice (Fig. 2G), in agreement with a previous study that showed decrease in connexin 43 in the presence of high mechanical load leading to hypertrophied myocardium (3). Furthermore, it was reported that NHE1 negatively regulates connexin 43 expression in phenylephrine-induced cardiac hypertrophy (32). Overall, these findings suggest that active NHE1 is sufficient to induce cardiac hypertrophy.
OPN Mediates NHE1-induced Cardiac Hypertrophy through p90 RSK
A previous study also reported that expression of active NHE1 upregulated OPN gene expression significantly (44). Our study confirms that overexpression of NHE1 in the heart upregulated cardiac mRNA expression of OPN, indicating the importance of active NHE1 in expression of OPN. It was previously reported that OPN is a ligand for receptor CD44 (14, 31). Cell adhesion, cell survival, and gene expression were modulated by integrin and CD44-mediated pathways signaled by OPN (7). OPN is susceptible to cleavage at integrin binding motifs (4). Moreover, our results show an increased upregulation of CD44 mRNA and protein expression in transgenic mice overexpressing NHE1, which was reduced when OPN was knocked out in NHE1 transgenic mice (Fig. 3). We are the first to report these findings. Together these findings confirm the correlation that OPN expression is upregulated in heart overexpressing NHE1. Moreover, our previous in vitro study on cardiomyocytes showed that NHE1-induced OPN expression facilitated cardiac hypertrophy as demonstrated by the increase in ANP mRNA expression, cell surface area, and protein content. These markers of hypertrophy were reversed when OPN was downregulated by transfection of siRNA directed against OPN in cardiomyocytes expressing active NHE1 (23). In contrast, in our present in vivo study the increase in ANP mRNA expression and cell surface area in NHE1 transgenic mice was not reversed when OPN was knocked out (Fig. 5C). The discrepancy observed with our in vitro (23) findings vs. our in vivo findings may be due to the study model with the former study being carried out in an in vitro cell line, whereas the current study was carried out in an in vivo model. The decrease in cell area and ANP mRNA expression observed in the in vitro model may have been compensated for by external factors in the in vivo model.
Previous reports revealed the involvement of ERK and p90 RSK in mediating cardiac
hypertrophy (37). It was also reported that ERK is mediating activation of NHE1 (2, 18). Our results showed increased phosphorylated ERK in overexpressed NHE1 transgenic mice (Fig. 2I). Moreover, previous studies reported that RSK is considered to enhance NHE1 activity (34, 36), which is in accordance with our results where active NHE1 transgenic mice showed increased phosphorylation of RSK (Fig. 4). Our novel findings also show that the
phosphorylation of RSK was regressed in NHE1 OPN−/− mice (Fig. 4), suggesting that the OPN is a key regulator in the activation of RSK. Furthermore, increased fibrosis in
overexpressed NHE1 transgenic mice, which was reduced in NHE1 OPN−/− mice (Fig. 5E), also explains the role of OPN in NHE1-induced cardiac hypertrophy.
However, our study also found out that cardiac hypertrophy induced by NHE1 was not reversed when OPN was knocked out in NHE1 transgenic mice, demonstrated in ANP, BNP mRNA expressions and cardiac cell area of NHE1 OPN−/−. Moreover, heart function
measured by echocardiography was also not improved in NHE1 OPN−/− mice. Furthermore, a significant but not complete reduction in relative fibrosis was observed in NHE1 OPN−/−. The partial reduction in cardiac fibrosis may be attributed to the fact that fibrosis may also be caused by other factors including TGF-β (17, 38), accounting for the inability of knocking out OPN for a complete reduction of fibrosis. Together our findings suggest that knocking out OPN only helps in a partial reduction of NHE1-induced cardiac hypertrophy.
Our study also shows no significant changes for cardiac hypertrophic parameters when WT is compared with OPN−/− mice. However, when OPN−/− was compared with NHE1 transgenic mice, we found that the parameters were significantly reduced vs. OPN−/−, which could be attributed to the fact that there is no change between WT and OPN−/−. This suggests that OPN−/− mice are similar to WT mice, and OPN−/− mice need stimuli like angiotensin,
myocardial infarction, or NHE1 overexpression to produce cardiac hypertrophic effects (20). In conclusion, our findings demonstrate that overexpression of NHE1 results in upregulation of OPN, which ultimately leads to cardiac hypertrophy mediated through CD44 and p90 ribosomal s6 kinase expression.
GRANTS
This work was supported by the National Priorities Research Program grant (NPRP 5 - 330 - 3 - 090) provided by the Qatar National Research Fund, Doha, Qatar (https://www.qnrf.org). Lead principal investigator (PI): FM, PI: LF, AG. “The funders had no role in study design, data collection and analysis, decision to publish, or preparation of the manuscript.”
DISCLOSURES
No conflicts of interest, financial or otherwise, are declared by the authors.
AUTHOR CONTRIBUTIONS
N.A., B.J.-V., A.J., S.R., A.-P.G., and F.M. performed experiments; N.A., A.-P.G., and F.M. analyzed data; N.A., B.J.-V., P.G., and F.M. interpreted results of experiments; N.A., A.-P.G., and F.M. prepared figures; N.A. and F.M. drafted manuscript; N.A., L.F., S.R., A.-A.-P.G., and F.M. edited and revised manuscript; N.A., B.J.-V., L.F., A.J., S.R., A.-P.G., and F.M. approved final version of manuscript; A.-P.G. and F.M. conceived and designed research.
AUTHOR NOTES
Address for reprint requests and other correspondence: F. Mraiche, College of Pharmacy, Qatar Univ., PO Box 2713, Doha, Qatar (e-mail:
fatima.mraiche@qu.edu.qa).
Table 1. List of primers used in quantitative PCR
NHE1 forward GCCATTGAGCTGGTGGAGAG reverse CGGTCTGAAGTCACAGCCTTG Endogenous NHE1 forward GGGGATTTCATCCACCTCGG reverse GGGGATCACATGGAAACCTATCT TIMP4 forward TGACACTCAAAAACTGATCCGGTA reverse CATAGCAAGTGGTGATTTGGCAG CTGF forward GACCCAACTATGATGCGAGCC reverse TCCCACAGGTCTTAGAACAGG
Fig. 1.Na+/H+ exchanger isoform 1 (NHE1) mRNA and protein expression in mutated NHE1-overexpressing mice. A: RT-quantitative (q)PCR quantification of endogenous NHE1 (eNHE1) mRNA levels in wild-type mice (WT) and NHE1 transgenic mice (NHE1) normalized to β-actin (n = 7 for WT and n = 5 for NHE1). B: RT-qPCR quantification of mutated NHE1 mRNA levels in WT mice and NHE1 transgenic mice (NHE1) normalized to β-actin (n = 10 for WT and n = 9 for NHE1). Results are
expressed as NHE1 mRNA levels ± SE *P < 0.05 vs. WT. C: representative Western blot of hemagglutinin (HA) tag demonstrating the comparison of NHE1 protein expression in WT mice and NHE1 transgenic mice. D: representative
immunohistochemistry images of HA tag demonstrating the comparison of NHE1 protein expression in WT mice and NHE1 transgenic mice.
Fig. 2.Cardiac gene modulation in NHE1-overexpressing mice. Quantification of
mRNA levels (A, B, C, D, and F) was performed by RT-qPCR in wild-type mice (WT) and NHE1 transgenic mice (NHE1) normalized to β-actin. Results are expressed as the ratio of target gene over β-actin ± SE. +P < 0.001 vs. WT, #P < 0.01 vs. WT, *P < 0.05 vs. WT. A: quantification of mRNA levels of metalloproteinase inhibitor 4 (TIMP4), connective tissue growth factor (CTGF), integrin-β3 (intβ3), collagen3A (Col3), collagen1 (Col1), and matrix metalloproteases 2 (MMP2). For TIMP4, integrin-β3, collagen3A, collagen1, and MMP2, n = 7 for WT and n = 5 for NHE1. For CTGF, n = 10 for WT and n = 9 for NHE1. B: quantification of mRNA levels of cFos, cyclic adenosine monophosphate response element binding protein (CREB), signal transducer and activator of transcription 3 (STAT3) (n = 7 for WT and n = 5 for NHE1). C: quantification of mRNA levels of peroxisome proliferator-activated
receptor alpha (PPAR-α) and peroxisome proliferator-activated receptor gamma coactivator 1-alpha (PGC-1α) (n = 7 for WT and n = 5 for NHE1). D: quantification of
mRNA levels of interleukin 6 (IL-6) (n = 10 for WT and n = 9 for NHE1). E: quantification of OPN mRNA in WT mice, NHE1 transgenic mice, OPN knockout NHE1 transgenic mice (NHE1·OPN−/−), and OPN knockout mice (OPN−/−)
normalized to β-actin (n = 10 for WT, n = 9 for NHE1, n = 7 for NHE1·OPN−/−, n = 10 for OPN−/−). #P < 0.01 vs. WT; ¥P < 0.001 vs. NHE1·OPN−/−. F: quantification of mRNA levels of serum and glucocorticoid-regulated kinase 1 (SGK1) (n = 7 for WT and n = 5 for NHE1). G, H, I: quantification of protein expression in WT and NHE1 mice was performed by Western blot. Specific protein expression was normalized to α-tubulin. Results are expressed as % of WT ± SE. #P < 0.01 vs. WT, *P < 0.05 vs. WT. G, top left: representative Western blot images of connexin 43 protein expression in WT and NHE1. Immunoblotting was against connexin 43 (43 kDa) and α-tubulin (50 kDa). Bottom left: representative immunohistochemistry images of connexin 43 protein expression in WT and NHE1. Right: quantification of Western blot bands of connexin 43 normalized to α-tubulin (n = 4 for WT and n = 4 for NHE1). H, left: representative Western blot images of nuclear factor of activated T cells (NFAT) protein expression in WT and NHE1. Immunoblotting was against NFAT (160 kDa) and α-tubulin (50 kDa). Right: quantification of NFAT protein expression normalized to α-tubulin (n = 9 for WT and n = 7 for NHE1). I, left: representative Western blot images of phosphorylated extracellular signal-regulated kinase (pERK) protein expression in WT and NHE1. Immunoblotting was against pERK (42, 44 kDa) and ERK (42, 44 kDa). Right: quantification of pERK protein expression normalized to total ERK (n = 8 for WT and n = 5 for NHE1).
Fig. 3.Role of osteopontin (OPN) in NHE1 overexpression-induced CD44 protein
expression. A: representative immunohistochemistry images of CD44 expression in the heart cross sections of wild-type mice (WT), NHE1 transgenic mice (NHE1), OPN knockout NHE1 transgenic mice (NHE1·OPN−/−), and OPN knockout mice (OPN−/−). Bars represent 100 µm. B: quantification of mRNA levels of CD 44 normalized to β-actin (n = 10 for WT, n = 9 for NHE1, n = 7 for NHE1·OPN−/−, n = 10 for OPN−/−). Results are expressed as the ratio of CD44 gene over β-actin ± SE. +P < 0.001 vs. WT; €P < 0.01 vs. NHE1.
Fig. 4.Role of OPN in NHE1 overexpression-induced phosphorylation of p90
ribosomal S6 kinase. A: representative Western blot images of phosphorylated
p90RSK protein expression in wild-type mice (WT), NHE1 transgenic mice (NHE1), OPN knockout NHE1 transgenic mice (NHE1·OPN−/−), and OPN knockout mice (OPN−/−). Immunoblotting was against phospho-p90RSK (90 kDa), RSK2 (80 kDa), and α-tubulin (50 kDa). B: quantification of phospho-p90RSK protein expression normalized to RSK2 (n = 7 for WT, n = 7 for NHE1, n = 3 for NHE1·OPN−/−, n = 6 for OPN−/−). Results are expressed as % of WT ± SE *P < 0.05 vs. WT, £P < 0.05 vs. NHE1.
Fig. 5.Role of OPN deficiency and NHE1 overexpression in cardiac morphology.
Morphology and histology of heart from wild-type mice (WT), NHE1 transgenic mice (NHE1), OPN knockout NHE1 transgenic mice (NHE1·OPN−/−), and OPN knockout mice (OPN−/−). A: representative whole heart images. B: representative images of Masson’s trichrome staining of heart cross sections. C: quantification of mRNA levels of atrial natriuretic peptide (ANP) and brain natriuretic peptide (BNP) normalized to β-actin (n = 10 for WT, n = 9 for NHE1, n = 7 for NHE1·OPN−/−, n = 10 for OPN−/−). Results are expressed as the ratio of target gene over β-actin ± SE. +P < 0.001 vs. WT, #P < 0.01 vs. WT, ¥P < 0.001 vs. NHE1, γP < 0.001 vs. NHE1 OPN−/−, βP < 0.01 vs. NHE1 OPN−/− D, left representative images of heart cross sections stained with wheat
germ agglutinin (WGA). Right: graphical representation of internal and external cross-sectional heart cell area (n = 7 for WT, n = 4 for NHE1, n = 4 for NHE1·OPN−/−, n = 4 for OPN−/− for internal cell area; n = 8 for WT, n = 5 for NHE1, n = 3 for
NHE1·OPN−/−, n = 4 for OPN−/− for external cell area). Bars represent 50 µm. Results are expressed as % of WT ± SE *P ≤ 0.05 vs. WT, #P < 0.01 vs. WT, +P < 0.001 vs. WT, γP < 0.001 vs. NHE1 OPN−/−, £P < 0.05 vs. NHE1, βP < 0.01 vs. NHE1 OPN−/−. E, left representative images of heart cross sections stained with Picrosirius red (PSR). Right: graphical representation of quantification of PSR stain on heart cross sections (n = 14 for WT, n = 10 for NHE1, n = 7 for NHE1·OPN−/−, n = 9 for OPN−/−). Bars represent 50 µm. Results are expressed as relative fibrosis ± SE. +P < 0.001 vs. WT, €P < 0.01 vs. NHE1, ¥P < 0.001 vs. NHE1, γP < 0.001 vs. NHE1 OPN−/−.
Fig. 6.Effect of NHE1 overexpression on heart function. Graphical representation of
echocardiographic parameters of wild-type mice (WT), NHE1 transgenic mice (NHE1), OPN knockout NHE1 transgenic mice (NHE1·OPN−/−), and OPN knockout mice (OPN−/−). Results are expressed as raw values of echocardiographic parameters ± SE. +P < 0.001 vs. WT, #P < 0.01 vs. WT, ¥P < 0.001 vs. NHE1, βP < 0.01 vs. NHE1 OPN−/−, €P < 0.01 vs. NHE1, γP < 0.001 vs. NHE1 OPN−/−. A: graphical
representation of the lengths of interventricular septum in systole (IVSs),
interventricular septum in diastole (IVSd), left ventricular internal diameter in systole (LVIDs), left ventricular internal diameter in diastole (LVIDd), left ventricular posterior wall in systole (LVPWs), and left ventricular posterior wall in diastole (LVPWd) (n = 10 for WT, n = 9 for NHE1, n = 7 for NHE1·OPN−/−, n = 10 for
OPN−/−). B: graphical representation of ejection fraction (EF) and fractional shortening (FS) (n = 10 for WT, n = 9 for NHE1, n = 7 for NHE1·OPN−/−, n = 10 for OPN−/−). C: graphical representation of volumes of left ventricle in systole (LVs) and diastole (LVd) (n = 10 for WT, n = 9 for NHE1, n = 7 for NHE1·OPN−/−, n = 10 for OPN−/−).