Given the rise of Electric Vehicles (EVs), to what
extent is vertical integration a Critical Success
Factor (CSF) for carmakers to be successful in
the new automotive industry?
Bachelor Project submitted for the degree of
Bachelor of Science HES in International Business Management
By
Laszlo DAVID
Bachelor Project Mentor:
Philip Willson, HES Lecturer
Geneva, 19th June 2020
Haute école de gestion de Genève (HEG-GE) International Business Management
Disclaimer
This report is submitted as part of the final examination requirements of the Haute école de gestion de Genève, for the Bachelor of Science HES-SO in International Business Management. The use of any conclusions or recommendations made in or based upon this report, with no prejudice to their value, engages the responsibility neither of the author, nor the author’s mentor, nor the jury members nor the HEG or any of its employees.
Acknowledgements
I would like to thank my advisor, Mr Willson, for his help and guidance throughout the writing process of this research paper.
I am also grateful to the persons who took time to discuss and debate that research topic with me. Hence, I would like to thank Mr Stefan Bahamonde, Mr Tim Skszek, Dr Evangelos Vrettos, Prof Dr Petr Novák, Dr Adrian Spillmann, Dr Priscilla Caliandro and her colleagues, and Prof Dr Nicolas Depetris Chauvin.
Finally, I would like to thank my family and friends for their advice which enabled me to take a step back when needed.
Executive Summary
The automotive industry generated a revenue of USD 5.135 trillion in 2017 and is expected to produce one of USD 8.931 trillion by 2030. However, despite an increase of roughly 174% of the market value (Krings et al., 2018), traditional and iconic automotive OEMs (original equipment manufacturers) may in the same period see their share of value-added margin decrease from 50-55% to 35-40% (Ernst & Young, 2019).
The current EASCY trends (electric, autonomous, shared, connected, and yearly updated) are massively disturbing the automotive industry. Therefore, long-established carmakers must adapt their business models if they desire to retain a considerable value-added margin (Kuhnert, Stürmer and Koster, 2017).
A significant part of the global automotive value-shift is due to the automobile electrification and more precisely, the electrification of the powertrain. Therefore, it is essential to assess whether long-established carmakers have means to prevent a loss of 15% of their value-added margin (Ernst & Young, 2019).
The existing literature has already suggested that in the era of electric vehicles, automakers may have to consider integrating the production of the battery which powers the powertrain, if they wish to retain a considerable share of the value-added margin (Proff, 2011), (Huth et al., 2013, 2015). The recent literature also highlights the existence of various risks related to automakers’ dependency on battery components. However, a gap remains regarding the importance that vertical integration will have in helping long-established automakers to be successful in the era of electric vehicles.
Hence, by addressing some unanswered questions related vertical integration, and more precisely that of the battery and its key components, this research brings a value-added to the existing literature.
This paper concludes by arguing that to retain a considerable share of the value-added margin and simultaneously decrease potential supply risks, long-established automakers should seriously consider increasing their degree of integration in the upcoming years.
Contents
Given the rise of Electric Vehicles (EVs), to what extent is vertical integration a Critical Success Factor (CSF) for carmakers to be successful in the new
automotive industry? ... 1
Disclaimer ... i
Acknowledgements ... ii
Executive Summary ... iii
Contents ... iv
List of Tables ... vi
List of Figures ... vi
Abbreviations and acronyms... vii
1. Introduction ... 1
1.1 Presentation of the subject... 1
1.2 Purpose of the study ... 2
1.3 Organisation of the report ... 3
2. Literature review ... 4
2.1 Automotive market and its evolution ... 4
2.2 Powertrain technology ... 7
2.2.1 New energy vehicles (NEVs) ... 7
2.2.2 Electric vehicle batteries (EVBs) ... 11
2.3 Vertical integration ... 18
2.3.1 What is vertical integration ... 18
2.3.2 Vertical integration and transaction cost economics (TCE) ... 22
2.3.3 Vertical integration applications... 25
3. Research methodology ... 35
3.1 Secondary data collection ... 36
3.2 Fieldwork... 36
3.3 Research limitations ... 37
4. Results... 38
4.1 Analysis of the findings ... 48
4.1.1 Fieldwork analysis ... 48
5. Discussion ... 51
5.1 Summary of the findings and literature review ... 51
5.2 Recommendations ... 57
5.3 Limit of the study / Bias & assumptions ... 60
5.4 Direction for further research ... 60
6. Conclusion ... 61
Bibliography ... 63
Appendix 2: “Well-to-wheels” ... 71
Appendix 3: OICA – Sales of new vehicles statistics ... 72
Appendix 4: The 10 most innovative companies of 2016 ... 73
Appendix 5: The 20 most innovative companies of 2018 ... 74
Appendix 6: EVs are still only 2-5% of sales in most markets ... 75
Appendix 7: Total sales of new electric vehicles – E.U., U.S., China ... 76
Appendix 8: Illustrations of EV Types ... 77
Appendix 9: Average EV range (2008-2021) ... 79
Appendix 10: BEVs and ICEs powertrain costs allocation ... 80
Appendix 11: EV cost distribution ... 81
Appendix 12: Comparisons of different types of LiB used in EVs ... 83
Appendix 13: Lithium-ion battery price survey results: volume-weighted average 84 Appendix 14a: Lithium-ion battery price survey: pack and cell split ... 85
Appendix 14b: Lithium-ion battery price outlook ... 86
Appendix 15: Breakdown of manufacturing costs at battery cell level ... 87
Appendix 16: Four dimensions of vertical integration... 88
Appendix 17: Extensive analysis of transaction cost economics (TCE) ... 90
Appendix 18: Examples of vertical integration and integrated supply chain strategies ... 93
Appendix 19: Conversation with Mr Stefan Bahamonde (Libattion GmbH) ... 94
Appendix 20a: Conversation with Mr Tim Skszek (Magna International Inc.) ... 96
Appendix 20b: Conversation with Mr Tim Skszek (Magna International Inc.) ... 99
Appendix 21: Conversation with Dr Evangelos Vrettos (Swissgrid) ... 101
Appendix 22: Conversation with Prof Dr Petr Novák (Paul Scherrer Institute PSI and ETHZ) ... 105
Appendix 23: Conversation with Dr Adrian Spillmann (Bühler Group) ... 110
Appendix 24: Conversation with Dr Priscilla Caliandro & Co. (Berner Fachhochschule and EPFL) ... 113
Appendix 25: Conversation with Prof Dr Nicolas Depetris Chauvin (HEG – Geneva) ... 118
List of Tables
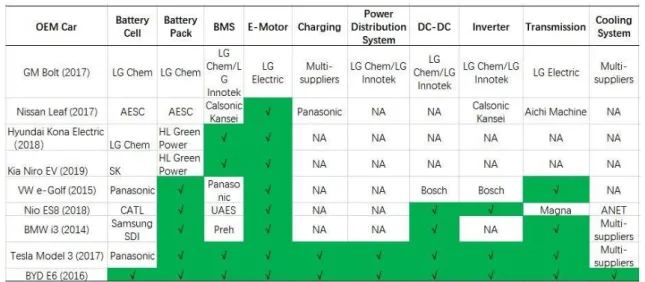
Table 1: Various EV OEMs’ “make-or-buy” strategies ... 39
List of Figures
Figure 1: Car and truck sales by location, 1964-2014 ... 5Figure 2: Global electric vehicle sales forecast ... 7
Figure 3: Powertrain Technologies and Fuel Types ... 8
Figure 4: Different powertrain technologies in detail ... 9
Figure 5: Powertrain cost breakdown depending on its type ... 12
Figure 6: Battery strategy archetypes ... 21
Figure 7: Impact of the battery value chain strategy on OEM in-house production share………21
Figure 8: Strategic reactions of OEMs to growing modularisation in the automotive industry………...28
Figure 9: Comparison of outsourcing approaches ... 29
Abbreviations and acronyms
BEV Battery electric vehicleCSF Critical success factor
EASCY Electrified, autonomous, shared, connected and yearly updated
EoL End-of-life
ESS Energy storage system
EV Electric vehicle
EVB Electric vehicle battery
FCEV / FCV Fuel-cell electric vehicle / Fuel-cell vehicle
GHG Greenhouse gas
HEV Hybrid electric vehicle
ICE Internal combustion engine
ICEV Internal combustion engine vehicle
LiB Lithium-ion battery
MHEV Mild hybrid electric vehicle
NEV New energy vehicle
OEM Original Equipment Manufacturer
OICA Organisation International des Constructeurs Automobiles PEV Plug-in electric vehicle
PHEV Plug-in hybrid electric vehicle SBU Strategic business unit TCO Total cost of ownership
1. Introduction
1.1 Presentation of the subject
Globally, the automotive industry generated a revenue of USD 5.135 trillion in 2017 and is expected to one of produce USD 8.931 trillion by 2030. During the same period, the revenue and thus, the profit distribution of this industry is expected to change drastically. In 2017, the share of the profit captured by traditional suppliers, and automotive OEMs through new vehicle sales and aftermarket sales was of 71%. However, by 2030, it could almost halve to 41%. More particularly, the automobile electrification considerably reduces automakers’ revenue due to the reduced complexity of the powertrain (Krings et al., 2018).
Recently, most automakers agreed that the radical transformation which the automotive industry is undergoing would bring more change than the two previous decades have (J.P. Morgan, 2018). Therefore, to successfully move forward and transit towards the new era of mobility, carmakers must implement a new approach involving the four following steps: (i) prepare for uncertainty, (ii) leverage partnerships, (iii) adapt the organization and (iv) reshape the value proposition (Gao et al., 2016).
Because the sale of new automobiles will sooner or later all possess a new technology powertrain – which represents a considerable portion of the NEVs cost – automotive OEMs should consider integrating the production of powertrains in order to retain more value-added margin (Huth et al., 2013, 2015). Similarly, automotive OEMs may consider having a greater upstream stake in the value chain and take part in the production of key elements such as the battery-pack and its components.
Ultimately vertical integration could enable a reduction in transaction costs, generate technological economies and mitigate market imperfections (Williamson, 1971), (Balakrishnan and Wernerfelt, 1986), (Perry,1989).
However, the various uncertainties related to battery technology and its components makes it significantly more difficult than expected to assess “The extent to which
vertical integration is a critical success factor for carmakers to be successful in the new automotive industry”.
1.2 Purpose of the study
This research paper aims to develop a deeper understanding of how long-established carmakers could benefit from or be damaged by being vertically integrated into the new automotive industry. Because this industry is being massively disrupted by consumers, economics, technology and regulations (Krings et al., 2018), vehicle manufacturers may have to adapt themselves if they desire to survive in this reborn industry.
Traditional automakers see their business models greatly disturbed and reshaped by the various EASCY (electrified, autonomous, shared, connected, and yearly updated) trends (Kuhnert, Stürmer and Koster, 2017). Therefore, this study will examine the impacts of automobile electrification on the automakers’ value chain. The purpose of this research is to determine whether, at the dawn of the electric vehicles’ era, it is a critical success factor for carmakers to be integrated highly upstream in the value chain.
Traditional vehicle manufacturers owe a considerable portion of their value-added margin to the production of internal combustion engines. Therefore, the decline of this technology will negatively impact automakers who do not find their new core business. Hence, it becomes essential to assess to what extent the electrification of automotive powertrains disturbs traditional business models and how automakers should restructure their value chain.
Finally, by having a look at highly integrated automakers such as Tesla Inc., BYD, and Rimac Automobili, this thesis aims to assess whether their path is the best one to be followed by long-established carmakers to be successful at the era of electric vehicles.
1.3 Organisation of the report
This research paper will be organised as follows. First, a review of the existing literature will be conducted. This section will be divided into three distinct chapters. To begin, the current trends disrupting the automotive industry will be exposed, and then their various effects on the manufacturing cost of automobiles will be studied. Afterwards, classic theories of vertical integration, as well as historical cases of integration in the automotive industry, will be examined.
The second section is devoted to explaining how the literature has been reviewed and divided and how the fieldwork has been conducted.
Third, the data gathered through the fieldwork – composed of interviews, discussions and questionnaires – will be analysed and synthesised. This will enable understanding the importance of vertical integration for automakers aiming at being successful in the new automotive industry.
In the last section, the key elements of this research paper will be summarised in a logical flow and conclusions will be drawn. Then, recommendations will be made, and the several limits of this study will be briefly discussed. Finally, we will seek to give an overview to the research question “To what extent is vertical integration a CSF (critical
2. Literature review
2.1 Automotive market and its evolution
Slightly more than a century after the implementation of the moving assembly-line, and the introduction of the Ford Model T by Henri Ford (Ford Motor Company, 2020), the automobile sector is again, at the dawn of being disrupted. J.P. Morgan notes that
“The car industry is undergoing a radical transformation, with most carmakers agreeing the next 10 years will bring more change than the two previous decades.”
(J.P. Morgan, 2018) Since its creation by the German inventor Karl Benz in the late 1880s (Bailey, 2016), the automobile kept improving. Over the years, its success has increasingly grown, and in 2017, this industry generated revenue amounting USD 5.135 trillion (Krings et al., 2018). In 2019, 64.3 million passenger cars and 27 million commercial vehicles were sold worldwide (OICA, 2020).
Gao et al. (2016) present a report entitled Automotive Revolution – Perspective towards
2030, presenting four key trends having started to affect the car industry, as well as some
means to overcome those ongoing changes. They envision the sector to be transformed by (i) shifting markets and revenue pools, (ii) changes in mobility behaviour, (iii) diffusion of advanced technology, (iv) new competition and cooperation. According to them, it is very likely that vehicle manufacturers will need to capture growth from different sources. To move forward successfully, traditional automakers will need to implement a “four-pronged strategic approach”: (i) prepare for uncertainty, (ii) leverage partnerships, (iii) adapt the organization and (iv) reshape the value proposition. Nevertheless, despite what could be imagined, the automotive industry is not declining, it is instead starting a new lifecycle (McKerracher, 2020).
As the automotive sector gets transformed, some changes are more noticeable than others. For instance, the importance of the China factor (Appendix 1: More on the China factor) and Regulating from ‘well-to-wheels’ has been pointed out (Appendix 2: “Well-to-wheels”) (Gao, Hensley and Zielke, 2014).
What makes the China factor so important, is that in addition to being one of the world’s most important economies, the country is since 2009 also the world’s largest vehicle market (Bosch Media Service, 2019a). According to the Organisation Internationale des
Constructeurs d’Automobiles (OICA) the East-Asian country has over the years
only for passenger cars (Appendix 3: OICA – New vehicles sales statistics) (OICA, 2020). Figure 1 (Car and truck sales by location, 1964-2014).
China is expected to become the leader of the EV transition and represent 50% of the global EV market by 2025 (Alfaro-Algaba and Ramirez, 2020). As for the worldwide EV sales, they are expected to increase from 1.1 million (in 2017) to 30 million (in 2030) (Bloomberg NEF, 2018). Furthermore, it was estimated that by 2030, the share of EVs in the U.S., Europe, and China should be of roughly 20%, 44% and 50% respectively (Krings et al., 2018). More recently, the International Energy Agency (IEA, 2020) estimated that by 2030, China would maintain its market share leadership (57% in total and 28% excluding two/three-wheelers) – followed by Europe (26%) and Japan (21%).
Figure 1: Car and truck sales by location, 1964-2014
Source: Gao, Hensley and Zielke, 2014, McKinsey Quarterly, A road map to the future for the auto industry, p.5
Over the years, numerous trends have started impacting the automotive sector and now, progressively reshape it. PwC argues that the auto industry will be driven by these and emphasises that the car of the future will be EASCY: electrified, autonomous, connected,
Despite the numerous effects that these trends will have on the industry, this research paper will solely cover the impacts related to manufacturing and value chain of electrified automobiles and their components. One could summarise the effect of these various trends as follows:
“[…] traditional manufacturers and suppliers will be extremely vulnerable in the years ahead. They will have to battle against falling margins while at the same time making far greater investments in electro-mobility and new, customer-oriented innovations. The combustion engine, which was for decades at the heart of the German automobile industry in particular, will become obsolete. At the same time, more and more new competitors will force their way onto the market, which will make life difficult for the old timers. All these trends are likely to come to a head between 2020 and 2025. […] [PWC’s model] gives a strong indication that the number of new car sales will rise noticeably each year, but at the same time the vehicle inventory will decline dramatically. Suppliers and car manufacturers will need to adjust to much shorter development cycles and improved recycling methods. New sales models will compete and converge with new operating models, autonomous driving algorithms will communicate with central transport systems, and electricity suppliers will attract new customers by advertising traction current and battery capacity. Traditional brands will expand their areas of business, new brands and competitors will attack traditional automobile companies […]”
(Kuhnert, Stürmer and Koster, 2017, p.41-43) When appraised as a whole, this becomes a fairly good reason for firms to consider higher degrees of differentiation. As it will be devolved further down, vertical integration could reveal itself as an extremely interesting governance mode to secure supply, align companies’ goals, decrease financial risks, and reduce transaction costs, for instance. Not very surprisingly, some traditional automakers have already started putting these new trends at the heart of their business model. In 2016, five out of twenty companies having the highest R&D expenses were automotive OEMs, however, only one vehicle manufacturer, Tesla, ranked in the world’s 10 most innovative companies. In 2018, the Californian-based manufacturer did not rank in the top 10, but Volkswagen did. (See Appendix 4: The 10 most innovative companies of 2016 and Appendix 5: The 20 most innovative companies of 2018) (Kuhnert, Stürmer and Koster, 2017).
Today, the car industry is getting transformed by the several EASCY trends. Therefore, long-established automotive OEMs should consider reviewing their traditional business-models if they desire to preserve their competitive advantage. Because the internal combustion engine will become obsolete, automakers must find a way to make up for the loss in contribution margin associated with the manufacture of combustion engines.
2.2 Powertrain technology
2.2.1
New energy vehicles (NEVs)
As BMW Group argues it in their article Electric cars and plug-in hybrid explained
“[…] sooner or later, the majority of drivers will be making the switch from petrol cars to an electric vehicle.”
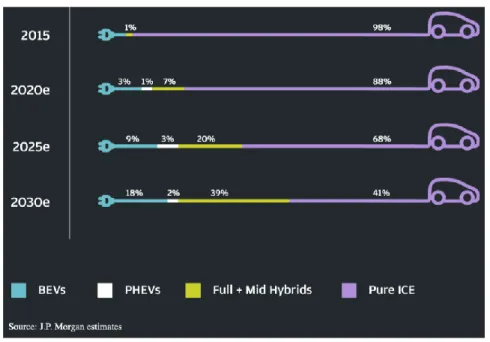
(BMW, 2020) Until recently, all automobiles were powered by internal combustion engines. But things are slowly changing. As explained by Colin McKerracher, during the 2020 BNEF Summit, EVs have started to represent a larger market share. The sales of EVs have gradually increased, so that today, electric vehicles constitute 2-5% of sales in most markets (Appendix 6: EVs are still only 2-5% of sales in most markets) (McKerracher, 2020). Even though their market share is still low in 2020, the shift towards EVs should intensify in the upcoming years. According to JP Morgan, new energy vehicles should represent about 30% and 60% of new sold cars sold in 2025 and 2030 respectively (Figure 2: Global electric vehicle sales forecast) (J.P. Morgan, 2018). And a significant part of those NEVs is expected to be electric vehicles. By 2030, EVs are estimated to represent the following share of new car sales: 44% in the E.U., 20% in the U.S. and 50% in China (Appendix 7: Total sales of new electric vehicles – E.U., U.S., China) (Krings et al., 2018).
Figure 2: Global electric vehicle sales forecast
To replace ICEs, different new energy vehicles (NEVs) are being developed. According to IHS Markit (2020), there are six different types of powertrain technologies used by cars and four different kinds of fuel used in the automotive industry (Figure 3: Powertrain Technologies and Fuel Types). Today, because of environmental reasons, the automotive industry is progressively phasing out of fossil fuel and has started replacing ICEs with these different types of powertrain technologies. According to the United States Environmental Protection Agency (EPA), in 2017, the transportation sector was responsible for the largest portion of greenhouse gas in the U.S. (29%), and most of it was caused by light-duty vehicles (59%), which underlines the need for change (US EPA, 2015).
Figure 3: Powertrain Technologies and Fuel Types
Source: HIS Markit, 2020, xEV Sales Scenario & Compliance Advisory Services
Today, the current automobile industry provides automobile users four alternatives to internal combustion engines: (i) fully electric cars, (ii) hybrids: mild-hybrids, plug-in hybrids, and (v) fuel-cell vehicles (Appendix 8: Illustrations of EV Types) (BMW, 2020) (Figure 4: Different powertrain technologies in detail).
Fully electric cars, also called battery electric vehicles (BEVs) are automobiles running only on electricity. Because they do not have a combustion engine, EVs are powered by the electricity stored in their battery rather than by the combustion of fuel (BMW, 2020). Furthermore, as opposed to ICEs, EVs have a significantly higher drive efficiency. While combustion vehicles convert only 35% of the fuel into mechanical energy, electric vehicles convert 88% of the energy stored in the battery into mechanical energy (Cheong, Song and Hu, 2016).
The particularity of BEVs as opposed to other EVs, is that they run exclusively on electricity, and thus, do not produce any greenhouse emission locally. Until now, market acceptance of BEVs has been limited due to range anxiety (185 miles/300km) and limited
charging infrastructure (BMW, 2020). However, there has been significant progress in recent years towards addressing the BEV market barriers. For instance, the Tesla Model S has an estimated range of 391 miles/630km (Tesla Inc., 2020). Furthermore, numbers demonstrate that these last years, the average EV range has kept increasing, passing from 166km in 2012 to 379km in 2020 [Appendix 9: Average EV range (2008-2021)] (McKerracher, 2020).
Figure 4: Different powertrain technologies in detail
Source: McKinsey & Company, 2014, Electric vehicles in Europe: Gearing up for a new phase?, p.21
Hybrid electric vehicles (HEVs) are cars having both a combustion and an electric engine. These cars can, according to BMW, be separated into two categories: mild hybrids and plug-in hybrids. “Depending on the car, both motors can either be
independent of one another or can work in tandem” (BMW, 2020).
Mild hybrid electric vehicles (MHEV) incorporate an electric motor to assist the combustion engine. This kind of EV reduces fuel consumption by kicking in when a great amount of fuel is being consumed, like during start-ups. As opposed to plug-in hybrids, mild hybrids’ batteries are only charged via regenerative braking (BMW, 2020).
Plug-in hybrids (PHVs or PHEVs), on the other hand, possess both an electric motor and a combustion engine. However, unlike mild hybrids, each motor is capable of powering the vehicle on its own. In addition, of using regenerative braking as their energy source, PHEVs can also be charged at charging stations (BMW, 2020).
Lastly, fuel cell vehicles (FCVs) are powered by the conversion of oxygen and hydrogen into electric energy, which then powers the electric motor with a battery. Once the battery is charged, fuel cell vehicles work the same as battery electric vehicles, with the
difference that they additionally emit warm air and water vapour (BMW, 2020). The main benefit of this technology is that a hydrogen vehicle can be refilled within five minutes, whereas a BEV usually requires about three hours to be fully recharged. On the other hand, market acceptance of FCVs has been limited due to the high cost of hydrogen fuel and limited distribution infrastructure. The high cost of hydrogen fuel is the result of high production, transportation and storage costs. Another limitation of FCVs, is that from hydrogen production to electricity storage in the battery, between 33-56% of energy is lost due to inefficiencies. Whereas with batteries, only 6% is lost from electricity production to electricity storage (Real Engineering, 2018).
Finally, as governments look to tackle fuel emissions, automakers have no other choice than phasing out vehicles powered solely by internal combustion engines (J.P. Morgan, 2018). Even though no one agrees on the type of new energy vehicle which will lead the market in the future, NEVs will without any doubt progressively replace all ICEs. BMW, for instance, suggest that the future automotive market will be composed of a combination of these different technologies (BMW, 2020). On the other hand, Strategy& recognise that in the years to come these several technologies will be combined, but stresses that BEVs should be the ones acquiring the largest market share (Appendix 7: Total sales of new electric vehicles – E.U., U.S., China) (Krings et al., 2018). Whereas, JP Morgan believes that BEVs and non-plug-in hybrids should lead the market over the next decade (J.P. Morgan, 2018). In any case, as countries part of the Paris Agreements aim to be climate-neutral by 2050 (European Commission, 2016), it may only be a matter of time before all – full and hybrid – internal combustion engines disappear.
2.2.2 Electric vehicle batteries (EVBs)
2.2.2.1 Powertrains and EVBs cost breakdown
There is no real consensus on what share will each different electric powertrain technology have in the 2030s. However, the literature agrees that traditional powertrains will progressively be replaced by electrics. Consequently, automakers will have no other choice but to learn to take advantage of this new technology.
Huth et al. (2015) for instance, argue that
“[…] the electrification of the powertrain leads to fundamental changes in the automotive value chain. Thereby, original equipment manufacturers (OEMs) have to decide which manufacturing steps to perform in-house and which parts to source from joint venture or suppliers.”
(Huth et al., 2015, p.22) As displayed in Figure 5 (Powertrain cost breakdown depending on its type), the automobile electrification changes vehicles cost distribution tremendously. While the powertrain represents only a moderate share of conventional vehicles total price (i.e. 22%), it constitutes a considerable portion of new energy vehicles total price. Nowadays, powertrains represent the following portion of automobiles total cost: ICEs (22%), HEVs (32%), PHEVs (42%), BEVs (48%), and FCEVs (55%) (Cornet et al., 2019). Similarly, BCG assume that a traditional powertrain accounts for approximately 16% of an ICEV total cost, whereas the EV one represents 50% of an EV total cost (Küpper et al., 2018). As noticeable, the shift towards electric mobility very much disrupts the traditional value chain model and reallocates a much larger portion of the value-adding to powertrain manufacturers and suppliers. Therefore, it is essential to assess which powertrain components account for the highest cost. Ultimately, this will help to assess to what extent being vertically integrated into the new automotive industry is a critical success factor for automakers.
2.2.2.1.1 Powertrain components cost breakdown
Most of the literature agrees that the battery-pack accounts for a considerable portion of an electric powertrain total cost. In 2017, for instance, battery-packs represented 40% of EV total values (EESI, 2017). More recently, it was suggested that the battery currently represents between 25-45% of an EV total cost – which would make it the single most costly part of the car. It also stressed that, as EV production and supply chains are ramping up, the battery is expected to be the “tightest in supply” (Eddy, Pfeiffer and van de Staaij, 2019).
Figure 5: Powertrain cost breakdown depending on its type
Source: Cornet et al., McKinsey & Company, 2019 How automotive suppliers can stay competitive in the powertrain components market, p.18
Because the BEV is the type of new energy vehicle which is expected to have the largest market share (14-18%) among the NEVs, some companies focused the cost breakdown solely on battery-electric vehicles (Küpper et al., 2018) and (J.P. Morgan, 2018). According to BCG, in 2018, the powertrain accounted for 50% of the BEV cost – versus 16% for an ICE. And the costs of a BEV powertrain were allocated as follows: electric motor and power electronics (15%), battery-pack (35%) including battery integration (10%) and battery-cell (25%) (Appendix 10: BEVs and ICEs powertrain cost allocation) (Küpper et al., 2018). As for the future, the battery cost is expected to slightly decrease and account for 18-23% of the BEV cost by 2030 (Soulopoulos, 2017).
In (Appendix 11: EV cost distribution) the distribution of the price of an EV versus that of an ICE, and the portion of cost represented by the battery depending on the vehicle type – small medium, large, and SUV segments – is displayed.
McKinsey & Company established, in 2019, a cost structure for the different kind of powertrains existing (i.e. ICEs, HEVs, PHEVs, BEVs, and FCEVs). Probably due to technology and production improvements, McKinsey & Co. came up with slightly lower numbers than its peers. According to them, the battery-pack only represents 34% of the BEV total cost – knowing that the electric vehicle battery constitutes 71% of the BEV powertrain cost and that the powertrain represents 48% of the total automobile cost. On the other hand, it constitutes quite a low share of HEV (4%) and PHEV (14%) total cost (Figure 5: Powertrain cost breakdown depending on its type) (Cornet et al., 2019). Hence, the cost of the lithium-ion battery is of particular interest, because the battery-pack is the powertrain most expensive component and thus, the EV single most costly part. According to Fries et al. (2017), the “[…] breakthrough of electromobility is closely
linked to the battery costs”. Likewise, McKinsey & Company (2014) argue that “[…] the speed of EV adoption will […] largely depend on TCO [total cost of ownership] developments, where the battery pack price is a critical component.”
2.2.2.1.2 Manufacturing cost breakdown
Because the traditional automotive value chain is being greatly disrupted, its participants may progressively consider adopting new approaches in order to capture value. As a matter of fact, while components manufacturers and suppliers slowly capture more and more share of the profit, it becomes increasingly important for automakers to be active at different stages of the value chain. Thus, producing certain components in-house should seriously be considered as an alternative to capture more value. (McKinsey & Company, 2014). Otherwise, traditional automakers may see their value-added shrink from 50-55% to 35-40% with the electric vehicle value chain (Ernst & Young, 2019).
2.2.2.2 Electric vehicle batteries (EVBs) manufacturing
Currently, the technology powering electric vehicles – including HEVs, PHEVs, and BEVs – is the lithium-ion one. Li-ion batteries are considered as being the best technology in terms of price-, range-, power-, lifespan-, safety- and density-factors (Scrosati and Garche, 2010).
The Li-ion battery family – which is the current predominant battery energy storage technology for EVs – involves several different cell chemistries having each one their
own unique advantages and disadvantages (Appendix 12: Comparisons of different types of LiB used in EVs) (Miao et al., 2019). Although not all automakers use the same variations of Li-ion technology, it appears that most automotive OEMs have chosen to partner with battery suppliers to develop their battery technology (McKinsey & Company, 2014).
At current, Li-ion batteries are mainly produced by large Asian manufacturers. It is estimated that the battery-cells market would be shared as followed in 2022, CATL (17%, China), LG Chem (14%, South Korea), BYD (7%, China), Tesla (6%, USA), Samsung (5%, South Korea), Farasis (4%, China), and Panasonic Sanyo (4%, Japan) by 2022 (Bernhart et al., 2019). This clearly highlights the Asian dominance in terms of battery-cells manufacturing. As noted by McKinsey & Company
“In 2018, less than 3 percent of the global demand for EV batteries was supplied by companies outside these three countries [China, Japan, and South Korea], and only approximately 1 percent was supplied by European companies.”
(Eddy, Pfeiffer and van de Staaij, 2019, p.2) Moreover, as the number of EVs increases, the demand for battery materials does as well. Consequently, the demand for major battery elements such as lithium (Li), nickel (Ni), cobalt (Co), manganese (Mn), aluminium (AI) and carbon (C), is growing at a considerable pace. Although an increasing demand is no crucial issue for all elements, it is for lithium and cobalt, which are very price-sensitive raw materials. Because most of the demand for Li and Co comes directly from battery-cell production, their price is very much expected to increase in the future. (Bernhart et al., 2018).
Apparently, by 2025, the battery demand arising from electric vehicles manufactured in Europe should be five times larger than what suppliers will be able to produce. Likewise, European EVB demand is estimated to reach a total of 1,200 gigawatt-hours per year (i.e. 80 Gigafactories), by 2040. Needless to say, that, additional battery manufacturing capacity in Europe or additional battery imports would be required to meet this gap of 1,000 gigawatt-hours per year (Eddy, Pfeiffer and van de Staaij, 2019).
The above-mentioned factors demonstrate that there are strong strategic incentives to ensure local battery production. As highlighted by (Eddy, Pfeiffer and van de Staaij, 2019),
“[…] not having this strategic part of the production process close by carries significant supply chain risks for OEMs and represent a lost opportunity for policy makers to locate a significant share of value creation in Europe.”
Thus, by not securing local battery capacity, the European industry could become less competitive.
Despite this, European automakers appear reluctant to get involved in battery-cell manufacturing themselves. First, they do not consider the knowledge required to produce battery-cells as part of automotive OEMs core competencies. Instead, they consider the packing of cells into modules and development of battery packs as more valuable. Second, it may be risky to produce batteries in-house or switch to a wider base of suppliers. Because growing battery demand has increased supply risks of raw materials, individual suppliers are unable to secure enough scarce materials at low-enough prices to support the required production (Eddy, Pfeiffer and van de Staaij, 2019).
Following, they also stress that
“[…] to minimize this risk [related to lithium and cobalt price increase], EV manufacturers may be well advised to integrate more closely with cell manufacturers that have strong control over their own supply chains. Currently, a handful of Chinese, Japanese, and Korean cell manufacturers dominate the market and much of the value chain, with control extending, in some cases, as far as the mines that extract lithium and other key metals.”
(Eddy, Pfeiffer and van de Staaij, 2019)
Automotive OEMs could also mitigate their supply-chain risks by sourcing from nearby battery manufacturers. According to McKinsey & Company, this could more than make up for the potentially lower costs of a deallocated plant. And simultaneously, this would provide greater flexibility and mitigating risks associated to sourcing all batteries from the same region (Eddy, Pfeiffer and van de Staaij, 2019).
2.2.2.3 Lithium-ion battery features evolution
The literature agrees that for electric vehicles to be accepted by consumers and to replace ICEs, EVs are required to reach higher ranges (i.e. > 500km), and the total cost of ownership (TCO) must be reduced. For this reason, significant effort is put towards improving lithium-ion batteries (LiBs) energy density and cost (Schmuch et al., 2018). But manufacturers must also consider other factors including battery lifetime, which must reach eight years minimum, fast-charging and safety standards (Kwade et al., 2018). Fast charging, for instance, is one of the areas of interest. Because this could partly offset the weak range of certain EVs, manufacturers are trying to develop a technology
enabling the battery-packs to achieve 80% state-of-charge within 5-20 minutes (Schmuch et al., 2018).
As for the cost of EV battery packs, it keeps declining each year. Whereas in 2010, battery-packs were valued (weighted-average) at 1,160 USD/kWh, they reached a price of 176 USD/kWh in 2018 (Appendix 13: Lithium-ion battery price survey results: volume-weighted average). Knowing that the cost at cell-level already accounts for two-thirds of the battery-pack cost (Appendix 14a: Lithium-ion battery price survey: pack and cell split) (Goldie-Scot, 2019).
Even though this will happen at a much lower rate than previously, further cost decline is expected, in the years to come (Nykvist and Nilsson, 2015) an 18% learning rate can be expected until 2030 (Appendix 14b: Lithium-ion battery price outlook) (Goldie-Scot, 2019). This is of importance because for EVs to become cost-competitive with ICEs, the battery-pack price must fall below 120-150 USD/kWh. This cost target should be reachable by 2022-2025 (Schmuch et al., 2018). Others are even more optimistic and argue that the average battery-pack price could be of 94 USD/kWh in 2024 and 62 USD/kWh in 2030 (Appendix 14b: Lithium-ion battery price outlook) (Goldie-Scot, 2019). The drivers of this cost reduction should be economies of scale, and a higher degree of automation in production (Schmuch et al., 2018).
Whereas production costs are expected to be reduced in the coming years, raw material costs may become of an issue. As a matter of fact, supply risks of LiB raw materials have been pointed out in several studies. Cobalt, for instance, is considered as the most critical element with respect to material reserves, supply reliability and cost (Schmuch et al., 2018).
Because the cell represents two-third of the battery-pack total price, assessing what manufacturing costs are important is essential. As displayed in Appendix 15 (Breakdown of manufacturing costs at battery cell level), almost 75% of the cell total cost is induced by materials. For this reason, establishing in-house material production or strategic partnership with material manufacturers may greatly help in achieving higher profit margins (Kwade et al., 2018).
Experts agree that LiBs is the technology which will dominate the automotive applications within the next ten years. However, it must be pointed out that there are other technologies having potential.
The fuel cell technology, for instance, is already present on the market and should power about 20% of vehicles by 2030. Its main advantage is that a hydrogen tank only takes a
few minutes to be refilled. Although there’s no agreement on how promising this technology is, all experts agree that its cost must be reduced if it is to become financially competitive with other EVs and ICEs (Bosch Media Service, 2019). Another technology which could surpass the conventional lithium-ion battery capability is the all-solid-state battery (Deng, 2015). This technology, which is currently only in the testing phase, is nothing but a derivative of the conventional lithium-ion battery. As an example, the Samsung Advanced Institute of Technology developed a prototype having a higher energy density and a longer life span (Lee, Fujiki et al, 2020).
Hence, due to its high competitiveness in terms of technology and cost, the lithium-ion batteries are, without any doubt here to stay.
2.3 Vertical integration
2.3.1 What is vertical integration
2.3.1.1 Basics of vertical integration
Harrigan defines vertical integration as
“[…] a way of increasing a firm’s value-added margins for a particular chain of processing from ultraraw materials to ultimate consumers.”
(Harrigan, 1985, p.398) Similarly, Johnson et al. argue that vertical integration is attractive because it captures some of the retailers and/or suppliers’ profit. Vertical integration can be performed downstream (forward integration) or upstream the value chain (backward integration). The former one is about getting involved in the downstream activities associated with the company’s current business. For instance, integrating the car retail, repairing and servicing for an automotive OEM. Whereas backward integration is about taking part in the upstream activities associated with the company’s current business. For instance, acquiring a component supplier or owning and controlling a specific production process for an OEM (Johnson et al., 2017).
Because this paper aims to determine to what extent it is more attractive for automotive OEMs to make or buy electric vehicle batteries, it will mainly focus on backward integration.
According to Balakrishnan and Wernerfelt (1986), and Perry (1989), the three main elements which may lead to vertical integration are (i) technological economies, (ii)
transactional economies, and (iii) market imperfections.
Technological economies arise when fewer intermediate inputs are required in order to obtain a certain output. They are achieved through the integration of upstream and/or downstream activities. As an example, not having to reheat steel when producing steel sheet, leads to energy savings (Perry, 1989).
Transactional economies – a significant determinant of vertical integration – are related to transaction cost economics theories (TCE), and represent economies related to the exchange process. From the perspective of TCE, vertical integration is motivated by the desire to reduce transaction costs of a bilateral exchange. It must be noted that, from the TCE perspective, the asset specificity is the primary determinant of vertical integration (Perry, 1989).
And third, vertical integration may also arise from market imperfections such as asymmetric information and externalities (Perry, 1989).
Despite its noticeable advantages, being vertically integrated also entails various risks. First, this governance mode often requires investments in activities other than the firm’s core business. Second, despite a possible degree of relatedness to the core business, vertical integration is likely to entail quite different strategic capabilities. For this reason, the integrated operations which are not adding value to the overall business, are generally subcontracted or outsourced (Johnson et al., 2017). In short, it could be argued that the “make-or-buy” decision is nothing but a spinoff of the division of labour and specialisation theories made by Adam Smith and his peers (Stigler, 1951). But, despite its rather simple appearance, it involves much more than “relative capabilities”. As demonstrated by Oliver Williamson and other economists, transaction cost economics is a major part of the decision to produce in-house or outsource (Johnson et al., 2017). Furthermore, neoclassical theories formulated by Stigler (1951), Klepper (1996, 1997, 2002), and Audretsch and Feldman (1996) suggest that the decision to integrate is partly dependent on the product life cycle (PDC) or more generally the industry life cycle.
2.3.1.2 Dimensions of integration
Harrigan (1985) suggests that in order to be effective, vertical integration does not need to be the same under all circumstances. On the contrary, companies may adapt their form of integration to suit corporate and competitive needs.
According to her, vertical integration of strategic business units (SBUs) possesses four variable dimensions: (i) stages of integration, (ii) breadth of integration, (iii) degree of
integration, (iv) form of integration (Appendix 16: Four dimensions of vertical integration) (Harrigan, 1985).
Subsequently, Harrigan stresses that
“Firms will adapt the dimensions of vertical integration outlined […] according to (1) the phase of industry development (sales, growth, changes in growth rates), (2) industry volatility (concentration and heights of exit barriers), (3) asymmetries in bargaining position (vis-à-vis suppliers, distributors, and customers’ or competitors’ integration strategies) and (4) firms’ strategy objectives.”
2.3.1.2.1 Dimension of integration and in-house battery production.
More recently, Huth et al. (2013), published a paper entitled OEM Strategies for Vertical
Integration in the Battery Value. In their work, they propose four strategy-archetypes for
the vertical integration of electric vehicle batteries: (i) Full Integrator, (ii) Waiting
Integrator, (iii) Packager, and (iv) Purchaser. According to them, even though OEMs all
face the same market conditions, they follow different strategies to integrate the production of electric vehicle batteries (Figure 6: Battery strategy archetypes).
They note that
“Full Integrators are active along the whole value chain from cell manufacturing to packaging in order to control costs and performance of the batteries. To build up the necessary competences they founded joint ventures with companies from the electrical and chemical industries. Waiting Integrators also founded joint ventures to manufacture battery cells. However, they also source battery packs from suppliers to retain multiple sourcing options. Packagers source battery cells from suppliers and integrate them in-house to battery packs. They often entered development partnerships with other OEMs to share relevant competences. Purchasers are not yet active in the battery value chain. They source complete battery packs from suppliers.”
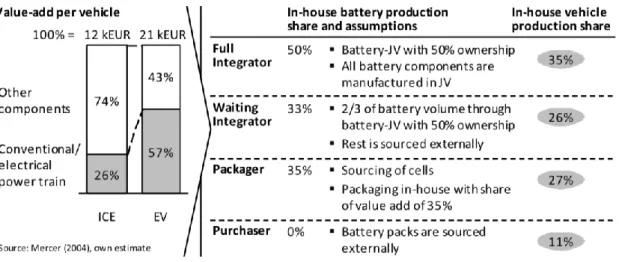
(Huth et al., 2013, p.82) Subsequently, Huth et al. estimate the impact that these different strategies have on automakers in-house production share. They evaluate the in-house vehicle production value-added share as following for the different strategies: Full Integrator (35%), Waiting
Integrator (26%), Packager (27%), Purchaser (11%) Figure 7 (Impact of the battery value chain strategy on OEM in-house production share). Additionally, like Womack et al. (1990), MacNeill and Chanaron (2005) and Volpato (2004), they stress that the degree of vertical integration into the automotive value chain is not static but rather dynamic (Huth et al., 2013).
While the automotive industry was highly integrated at the beginning of vehicle mass production, OEMs have – partly due to modularisation of vehicles – progressively decreased their degree of integration. Hence, although the battery pack can be considered as a module which can be sourced from suppliers, Huth et al. emphasise that
“OEMs have to secure some parts of the battery value chain if they want to retain a significant share of the value added in the electric vehicle production.”
Figure 6: Battery strategy archetypes
Source: Huth et al., 2013, OEM Strategies for Vertical Integration in the Battery Value Chain, p.82
Figure 7: Impact of the battery value chain strategy on OEM in-house production share
Source: Huth et al., 2013, OEM Strategies for Vertical Integration in the Battery Value Chain, p.89
Finally, they argue that because of the many uncertainties related to this technology, it was in 2013, still unclear which archetype would be the most appropriate. Nevertheless, they point out that the factors which will drive to integration or outsourcing are the capture of value-adding activities, and the risk of technological obsolescence (and the write-off of investments) respectively. In 2015, Huth et al. conclude that
“OEMs need to select a make-or-buy strategy based not only on financial considerations but also with regard to their overall electrification strategy for the vehicle portfolio. To this end, decisions regarding a make-or-buy strategy for electric vehicle batteries have to rely on further aspects such as the dependency on suppliers and the possibility of technological differentiation.” (Huth et al., 2015, p.33)
2.3.2 Vertical integration and transaction cost economics (TCE)
2.3.2.1 Division of labour and transaction cost economics (TCE)
According to Young (1928) and Stigler (1951), a starting point for vertical integration theory can be traced back at least to Adam Smith: division of labour. They believe that companies are initially vertically integrated into industries and that increasing output leads to specialisation. Put differently, they argue that, while small companies with limited production may need to produce themselves their intermediate goods – because external suppliers would not consider profitable production on such a limited scale – increasing the output of final goods could allow specialised firms to take over the production of intermediate products (Langlois and Robertson, 1989).
Although this theory makes sense at first, Langlois and Robertson demonstrate that this pattern does not fit the automobile industry, which is a counterexample. Indeed, this industry was characterised by much differentiation at the beginning of its lifecycle and became more integrated as output expanded. According to them, what makes the division of labour approach incomplete is that it includes only one cost component: the raw technological costs of production. Finally, as argued by Williamson, the vertical integration model in the industry reflects the minimisation of the sum of both production and transaction costs (Langlois and Robertson, 1989).
In the end, even though the literature does not necessarily agree on the nature of the correlation between industry stages and the degree of vertical integration, economists agree that vertical integration is not static but rather dynamic. As business sectors evolve and environmental factors changes, so does the proper use of vertical integration (Harrigan, 1985). As Langlois and Robertson note
“What this history of the automobile industry suggest is that certain levels of integration are more likely to prevail at specific stages of the industry life-cycle and under specific conditions of demand, economies of scale, and appropriability.”
(Langlois and Robertson, 1989, p.374)
2.3.2.1.1 Introduction to transaction cost economics (TCE)
As mentioned previously, Oliver Williamson is among the economists to have argued that the decision to make or buy involves more than just relative capabilities. TCE helps to analyse the relative benefits and costs of managing tasks internally or externally. Additionally, “[…] Williamson warns against underestimating the long-term cost of
opportunism by external subcontractors […]” when choosing whether to integrate or
outsource a certain activity (Johnson et al., 2017).
According to him, due to difficulties, subcontractors could over time be tempted to take advantage of their position, and either extract higher prices or reduce their standards. As a result, contractual exchange tends to fail in controlling subcontractor opportunism in three situations. The sources of transaction costs are (i) a small number of firms which generates opportunism, (ii) environmental uncertainty, and (iii) risk and specific assets. First, where subcontractors have high bargaining power because there are only a few
alternatives to them. Second, related to uncertainty, is where the complex and changing
nature of the product or service, makes contracts incomplete and thus not legally binding. Third, where the presence of specific assets requires investments which once made, have a lower value in alternative uses than it has in its intended one. Thus, the TCE theory indicates that “[…] if there are few alternative suppliers, if activities are complex
and likely to change, and if there are significant investments in specific assets […]”, being
vertically integrated is probably better than subcontracting (Johnson et al., 2017). Williamson argues that what makes vertical integration interesting in the case of contract incompleteness, is its ability to harmonise conflicting interest better and provide a smoother and less costly adaptation process. Hence, “[…] facilitating more efficient ex
ante investment in the relationship and more efficient adaptation to changing supply and demand conditions over time.” (Joskow, 2005)
He (2010) summarises the “make-or-buy” decision in case of specific assets as follows:
“Vertical integration is favored when the benefits of mitigating opportunism problems that may arise as a consequence of specific investments are greater than the costs of other sources of static and dynamic inefficiency that may be associated with resource allocation within bureaucratic organizations that may emerge as a consequence of vertical integration.”
(Joskow, 2010, p.27)
Put differently, what Williamson’s transaction cost framework suggests, is that the benefits of subcontracting to firms with superior strategic capabilities can be outweighed by the cost of opportunism. Therefore, in the end, what drives the decision to make or buy, is nothing but the balance between: the relative strategic capabilities and the risk of opportunism (Johnson et al., 2017).
See Appendix 17 (Extensive analysis of transaction cost economics) for deeper analysis of TCE.
2.3.2.1.1.1 Limitations of vertical integration
As highlighted by Joskow (2005), the fact that a hierarchical organisation possesses such attractive properties leads to wonder why there are not more vertically integrated firms on the market.
According to Williamson (1996), when looking at the bigger dynamic picture, firms tend to integrate themselves vertically as a last resort to mitigate contracting hazards and related transaction costs. Joskow (2005) explains that
“This is because, opportunistic behavior associated with specific investments aside, decentralized market arrangements have superior adaptive properties to internal organization in many other important dimensions.”
(Joskow, 2005, p.28) Williamson warns against the non-trivial costs in administrating transactions within the integrated firm and stresses that they increase accordingly to the size and span of the company (Balakrishnan and Wernerfelt, 1986).
They illustrate how the corporate span of firms limits transactional economies as follows
“While decentralization might relieve top management from the burden of day-to-day administration, it introduces the problem of control loss. Shirking and opportunistic behavior by, for example, the divisional managers can result in substantial costs within the organization.”
(Balakrishnan and Wernerfelt, 1986, p.351)
2.3.2.1.1.2 Transaction cost economics in a nutshell
First, Joskow (2005) explains that “[…] the NIE/TCE approach provides a framework that
can encompass and enrich all leading theories of vertical integration.” Hence, it
demonstrates that various types of market inefficiencies may lead transacting parties to substitute vertical integration or any other hybrid contractual arrangement for market exchange. However, Joskow (2005) also points out that “No governance structure is free
from at least some transaction costs.”
Indeed, the transaction costs economics theories demonstrate “[…] that there are unique
but systematic costs associated with alternative market contracting structures, with vertical integration and with various hybrid forms […]”. Therefore, “The ‘make or buy’ decision is not a once and for all decision. Firms may choose to vertically integrate and then decide that it is less costly to rely on market contracting.” As in the GM-Fischer
case, companies may choose to rely on market exchange for a time and then decide to integrate the production in-house (Joksow, 2005).
2.3.3 Vertical integration applications
2.3.3.1 Specific assets in the automotive industry
According to Williamson (1975, 1979), and Klein, Crawford and Alchian (1978), vertical integration is more likely to be favoured over spot market transaction when transactions are complex and when the transacting parties must invest in specific assets (Masten, Meehan and Snyder, 1989).
The decision to vertically integrate is closely related to the question of ownership and governance roles of the firms. However, it appears that the internalisation of the production can be separated from the question of ownership of physical assets. Owning a physical asset does not entail that the production must be managed within the firm. A buyer may own the physical assets specific to the making of components but purchase these components from an external supplier. For instance, it is a common practice from OEMs to take the title to specialised tooling whether or not they want to internalise production (Masten, Meehan and Snyder, 1989).
As for the form of integration, it is dependent on the type and the degree of asset specificity. To control opportunism problems, transacting parties can rely on several forms of partial integration. Monteverde and Teece (1982), for instance, argue that due to the right to transfer to another supplier, owning the specialised physical capital required for the input production, may be sufficient to prevent opportunism (Masten, Meehan and Snyder, 1989).
Besides, a great number of empirical works demonstrate that when deciding to integrate, the asset type matters. Klein (1988), for instance, illustrates with the GM-Fischer case,
“[…] the importance of the distinction between human and physical asset specificity”
(Masten, Meehan and Snyder, 1989).
Finally, Monteverde and Teece (1982) identify – through a study made on 133 automotive parts – a positive and significant relationship between engineering effort and vertical integration. They argue that vertical integration is very likely to be adopted in the case of “specialised, non-patentable know-how” assets, because of the great risk of hold-up and information transfer problems (Masten, Meehan and Snyder, 1989).
2.3.3.2 Vertical integration and information sharing
Most of the literature agrees on the importance of vertical integration to facilitate the sharing of information through production stages and implementation of processes in cases of inter-stage interdependencies (Armour and Teece, 1980).
According to Masten, Meehan and Snyder (1989), vertical integration is particularly useful in situations of uncertain economic environments, because it offers “superior” information. Riordan (1988), for instance, argues that generally, superior managerial control and access to information emerge when the production is brought within the firm. As Oliver Williamson (1971) points out, vertical integration may lead to greater economies of information exchange. Indeed, he writes
“It is widely accepted, that communication with respect to complex matters is facilitated by common training and experience and if a compact code has developed in the process.”
(Williamson, 1971, p.114) This argument was supported by his peers, including Malmgren (1961), Arrow (1975), and Joskow (2005). Some authors, however, also points out some limitations to this theory. Hart (1975), for instance, highlights that even though vertical integration may help to mitigate opportunism issues related to specific investments, it may also lead to different inefficiencies. As an example, he mentions the possibility of dealing with an employee unwilling to sharing information which could adversely affect his career path (Joskow, 2005).
More generally, the limitation of hierarchical governance is that as firms incorporate more activities, the costs of managerial oversight increase (Masten, Meehan and Snyder, 1989). Knowing that as size and span of the company increase, so do these costs (Balakrishnan and Wernerfelt, 1986).
Armour and Teece (1980), on the other hand, emphasised the enhanced innovation which can emerge from the sharing of technological information mutual to several firm departments. According to them, vertical integration may facilitate the implementation of
“[…] new technology when complex interdependencies are involved, and through the formulation of more astute research objectives.”
2.3.3.3 Vertical integration and innovation
2.3.3.3.1 Benefits of vertical integration in the case of technological innovation According to Lawrence and Lorsch (1967), Mansfield and Wagner (1975), and Armour and Teece (1980), studies demonstrate that a firm’s success at technological innovation is closely linked to the degree to which R&D activities are related to the marketplace (Armour and Teece, 1980). In fact, they argue that
“[…] vertical integration can enhance innovation through the sharing of technological information common to separate stages of an industry, through facilitating the implementation of new technology when complex interdependencies are involved, and through the formulation of more astute research objectives.”
(Armour and Teece, 1980, p. 470) Tesla Inc. and BYD, for instance, demonstrate well to what extent can vertical integration lead to superior innovative performance – at least in the automotive industry.
Finally, Armour and Teece (1980), also suggest that vertically integrated firms possess more productive R&D departments than less integrated ones. Again, the fact that Tesla Inc. was, in 2016, ranked as the 4th best innovator very much supports Armour and Teece’s theory in the case of the automotive industry. (Appendix 4: The 10 most innovative companies of 2016)
2.3.3.3.2 Distinctive business strategies and vertical integration
According to Porter’s Three Generic Strategies model, firms have different ways to acquire a competitive advantage. It is argued that the two principal methods of achieving it involves either costs or products/services differentiation (Johnson et al., 2017).
Thus, to differentiate themselves and capture more value, automotive manufacturers can either look for cost reductions (through production outsourcing) or decide to retain the production in-house, knowing that by internalising the production, they may retain competencies and add more value to the product themselves. This suggests that different production strategies do not have the same implications. An innovator or first-mover will face totally different risks and returns than a follower or second first-mover. In the end, what determines whether a manufacturer and more particularly an automaker should favour the make or buy strategy, will to a large extent also be dictated by the firm’s competitive strategy (Proff, 2011).
2.3.3.4 Vertical integration and powertrain technologies
2.3.3.4.1 Shift in the value-adding
Outsourcing and subcontracting can look attractive for manufacturers because it enables them to benefit from suppliers’ specialisation and know-how, as well as from economies of scale and scope (Proff, 2011).
However, by externalising the production, OEMs also sacrifice their competencies and makes it easier and more tempting for suppliers to establish entire modules (Proff, 2011).
Another risk of outsourcing has to do with the value-adding. Indeed, by shifting some parts of the production to third parties, manufacturers also shift a considerable share of the value-adding to suppliers. In the case of the automotive industry, transferring the value-adding to suppliers could relegate them to the rank of assemblers (Fourcade and Midler, 2005) and (Batchelor, 2006).
As displayed on Figure 8 (Strategic reactions of OEMs to growing modularisation in the automotive industry) in-house production and development have kept decreasing over the last decade, so that they diminished by 12% and 20% respectively. Proff and Batchelor even argue that this may also initiate devastating competence drain
“As a result, the relative loss of know-how accelerates until in the worst case the OEM is left with barely any real understanding of the development and production of a supplied component (Batchelor, 2006).”
(Proff, 2011, p.20) Figure 8: Strategic reactions of OEMs to growing modularisation in the automotive industry
Source: Proff, 2011, Where Differentiating Automobile Manufacturers go Wrong: Strategic Challenges posed by Increased