HAL Id: inserm-02869649
https://www.hal.inserm.fr/inserm-02869649
Submitted on 17 Jun 2020HAL is a multi-disciplinary open access archive for the deposit and dissemination of sci-entific research documents, whether they are pub-lished or not. The documents may come from teaching and research institutions in France or
L’archive ouverte pluridisciplinaire HAL, est destinée au dépôt et à la diffusion de documents scientifiques de niveau recherche, publiés ou non, émanant des établissements d’enseignement et de recherche français ou étrangers, des laboratoires
Louise Lantier, Ashley Williams, Ian Williams, Amanda Guerin, Deanna
Bracy, Mickael Goelzer, Marc Foretz, Benoit Viollet, Curtis Hughey, David
Wasserman
To cite this version:
Louise Lantier, Ashley Williams, Ian Williams, Amanda Guerin, Deanna Bracy, et al.. Reciprocity Between Skeletal Muscle AMPK Deletion and Insulin Action in Diet-Induced Obese Mice. Diabetes, American Diabetes Association, 2020, pp.db191074. �10.2337/db19-1074�. �inserm-02869649�
Reciprocity between Skeletal Muscle AMPK Deletion and Insulin Action in Diet-Induced Obese Mice
Louise Lantier1,2*, Ashley S. Williams1, Ian M.Williams1, Amanda Guerin1, Deanna P. Bracy1, Mickael Goelzer1, Marc Foretz3, Benoit Viollet3, Curtis C. Hughey1, David H.
Wasserman1,2
1Department of Molecular Physiology & Biophysics, Vanderbilt University School of Medicine, Nashville TN, USA; 2Vanderbilt Mouse Metabolic Phenotyping Center, Nashville, TN, USA; 3Université de Paris, Institut Cochin, CNRS, INSERM, F-75014 Paris,
France
* Corresponding author:
Louise Lantier (louise.lantier@vanderbilt.edu)
Department of Molecular Physiology & Biophysics, Vanderbilt University, 823 Light Hall, 2215 Garland Ave, Nashville TN 37232
Phone: 615-936-4028
Keywords: obesity, insulin resistance, muscle glucose uptake, energy deficit Running title: Skeletal muscle AMPK deficiency promotes glucose uptake
Word Count: 4,660 words
Number of Figures: 7 Number of Tables: 1 Supplemental Figures: 2
Abstract
Insulin resistance due to overnutrition places a burden on energy-producing pathways in skeletal muscle (SkM). Nevertheless, energy state is not compromised. The hypothesis that the energy sensor AMP-activated protein kinase (AMPK) is necessary to offset the metabolic burden of overnutrition was tested using chow-fed and high fat (HF)-fed SkM-specific AMPKα1α2 knockout (mdKO) mice and AMPKα1α2lox/lox littermates (WT). Lean mdKO and WT mice were phenotypically similar. HF-fed mice were equally obese and maintained lean mass regardless of genotype. Results did not support the hypothesis that AMPK is protective during overnutrition. Paradoxically, mdKO mice were more insulin sensitive. Insulin-stimulated SkM glucose uptake was ~two-fold greater in mdKO mice in vivo. Furthermore, insulin signaling, SkM GLUT4 translocation, hexokinase activity, and glycolysis were increased. AMPK and insulin signaling intersect at mTOR, a critical node for cell proliferation and survival. Basal mTOR activation was reduced by 50% in HF-fed mdKO mice, but was normalized by insulin-stimulation. Mitochondrial function was impaired in mdKO mice, but energy charge was preserved by AMP deamination. Results show a surprising reciprocity between SkM AMPK signaling and insulin action that manifests with diet-induced obesity, as insulin action is preserved to protect fundamental energetic processes in the muscle.
Introduction
Obesity and type 2 diabetes are associated with insulin resistance characterized by impairments in insulin-stimulated skeletal muscle (SkM) glucose uptake and energy-producing oxidative pathways. Despite these deficits, SkM energy state is maintained (1). The energy sensor AMP-activated protein kinase (AMPK) is a heterotrimeric kinase consisting of one catalytic subunit α and two regulatory subunits β and γ. The α subunit, of which exists two isoforms (α1; α2), contains the kinase domain and a critical reversible phosphorylation site αThr172, the phosphorylation of which is required for full kinase activity. Tasked with maintaining cellular energy charge during times of metabolic stress, AMPK acutely activates metabolic pathways that promote nutrient oxidation and energy production (2). As such, SkM AMPK stimulates lipid breakdown, mitochondrial biogenesis, glucose transport, and other processes involved in cellular homeostasis.
AMPK is activated in SkM by exercise (2) and may contribute to the increase in SkM glucose utilization (3). Accordingly, pharmacological activation of AMPK has been proposed as a means to circumvent the metabolic impairments due to insulin resistance as it mimics positive metabolic effects of exercise training (4-6). Studies conducted in vitro have suggested that AMPK activity may promote SkM insulin sensitivity, most notably through induction of SkM GLUT4 translocation and glucose uptake (6-9). However, this is controversial in vivo. Studies have demonstrated that the insulin-sensitizing effects of calorie restriction, exercise, contraction and 5-aminoimidazole-4-carboxaminde ribonucleotide (AICAR) in SkM are AMPK-dependent (3; 10; 11). More recently, it was reported that pharmacological activation of AMPK effectively promotes SkM glucose uptake in mice and primates (12-14).
In contrast, results from high-fat (HF)-fed mouse models with reduced SkM AMPK activity are unclear, with studies showing both aggravation of glucose tolerance (15; 16) and no effect (17; 18). These in vivo studies vastly differed from each other in terms of the genetic modification and background strain, as well as in diet paradigms and measurements of insulin action and glucose tolerance. The importance of AMPK to glucose tolerance is poorly defined and studies that show how the presence of AMPK affects insulin resistant states are lacking. These are major deficits in our current understanding of the metabolic role of AMPK in insulin resistance. This lack of clarity is of particular significance in obese insulin resistant subjects as they are candidates for AMPK-targeted treatments. AMPK activation and insulin stimulation share common signaling hubs and metabolic flux effects that are subject to complex interactions such as those related to possible feedback inhibition, mitochondrial function, and energy homeostasis.
Here, we show that mice lacking both AMPKα1 and AMPKα2 catalytic subunits specifically in SkM (mdKO) do not display exacerbated insulin resistance on HF diet. Remarkably they exhibit a profound amelioration of diet-induced insulin resistance by dramatically enhancing SkM insulin-stimulated glucose uptake. The fate of the glucose consumed by SkM in the presence of insulin is altered in the absence of AMPK as glucose is diverted from glycogen storage to glycolytic flux. We show that AMPK-deficient SkM has impaired mitochondrial function, but sustained energy status due to increased ATP formation by glycolysis and AMP removal by deamination. The increase in insulin-stimulated glucose uptake and glycolytic flux provides a critical compensatory mechanism that allows for maintenance of SkM energy balance. This compensatory mechanism attenuates resistance to insulin-stimulated SkM glucose uptake due to overnutrition.
Methods Mouse model
SkM AMPK-deficient mice (AMPKα1fl/flα2fl/fl human SkM actin-Cre+, hereafter referred to as mdKO) (19) and their control littermates (AMPKα1fl/flα2fl/fl, hereafter referred to as WT), backcrossed to a C57BL/6J background, were fed chow (13.5% calories from fat; 5001, LabDiet) or a HF diet (45% calories from fat, Research diets D12451 starting at 12 weeks of age for the oral glucose tolerance test; 60% calories from fat, BioServ F3282 starting at 6 weeks of age for all other studies). Mice were housed in a temperature/humidity-controlled environment with a 12h light cycle. Body composition was determined by NMR. Hyperinsulinemic, euglycemic clamps were performed on 18 week 5h-fasted male mice. OGTT were performed on 24 week 16h-fasted male mice. The Vanderbilt Animal Care and Use Committee approved all animal procedures specific to this study. The oral glucose tolerance test (OGTT) was approved by the Paris Descartes University ethics committees (no. CEEA34.BV.157.12) and performed under a French authorization to experiment on vertebrates (no. 75-886) in accordance with European guidelines.
Hyperinsulinemic-euglycemic (Insulin) Clamp
Catheters were surgically placed in the carotid artery and jugular vein for sampling and infusions, respectively, one week before clamps were performed. Mice were fasted for 5h before clamps. Mice were neither restrained nor handled during clamp experiments (20). [3-3H]glucose was primed and continuously infused from t=-90min to t=0min (0.04
µCi/min). The insulin clamp was initiated at t=0 min with a continuous insulin infusion (4 mU·kg-1·min-1) and variable glucose infusion rate (GIR), both maintained until t=155 min. The glucose infusate contained [3-3H]glucose (0.06 µCi/µL) to minimize changes in plasma [3-3H]glucose specific activity. Arterial glucose was monitored every 10 min to provide feedback to adjust the GIR so as to maintain euglycemia. Erythrocytes were infused to compensate for blood withdrawal. [3-3H]glucose kinetics were determined at -15 min and -5 min for the basal period, and every 10 min between 80-120 min for the clamp period to assess whole-body glucose appearance (Ra), glucose disappearance (Rd), and endogenous glucose production (endoRa). Whole body glycolytic rate was determined by the 3H
2O formation rate, and SkM glucose storage was calculated as the difference between Rd and glycolysis (21). A 13 µCi intravenous bolus of 2-[14C]-deoxyglucose ([14C]2DG) was administered at 120 min to determine the glucose metabolic index (Rg), an index of tissue-specific glucose uptake. Blood samples were collected at 122, 125, 135, 145 and 155 min to measure [14C]2DG disappearance from plasma. At 155 min, mice were anesthetized, and tissues immediately harvested and freeze-clamped. Plasma and tissue processing are described in Supplementary Appendix. Full step-by-step descriptions of the surgery, isotope clamp method, and calculations are available from the Vanderbilt Mouse Metabolic Phenotyping Center (MMPC) website (www.vmmpc.org).
Oral glucose tolerance test
To confirm that clamp results at Vanderbilt University are consistent with related measurements at a second site, OGTTs were performed at the Institut Cochin, INSERM Paris, France. See Supplementary Appendix for details.
High-resolution respirometry on permeabilized muscle fibers
High-resolution respirometry was performed on permeabilized muscle fibers from white gastrocnemius as previously described (22). Oxygen consumption was assessed with TCA cycle intermediates/NADH-generating substrates (2mM ADP + 2mM malate + increasing concentrations of pyruvate (5-5000µM)). The dose response curves were fitted to a Michaelis-Menten equation in order to determine Vmax and Km (Prism GraphPad). Citrate synthase activity was measured in white gastrocnemius homogenates spectrophotometrically (23).
Statistics
Data are expressed as mean±SE. Samples from mice were excluded automatically and without investigator intervention from subsequent analysis if more than 50% of the clamp data was over ±1.5 standard deviations from the final group mean. The program excluded 1 Chow WT, 1 Chow mdKO, 2 HF WT, and 2 HF mdKO studies (i.e. 6 mice were excluded out of 52 total clamp studies). Statistical analyses were performed using two-tailed unpaired Student t-test (two-group analysis) or two-way ANOVA followed by Tukey post hoc tests (four-group analysis). Basal states between genotypes were compared by Student’s t-test (†). Significance level for all tests was p<0.05 (*p<0.05; **p<0.01; ***p<0.001). The datasets generated and analyzed during the current study are available from the corresponding author upon reasonable request.
Results
Body weight and composition are unchanged in mdKO mice regardless of diet. WT and mdKO littermates were placed on chow or HF diet for 12 weeks starting at 6 weeks of age. Body weight was not different between genotypes within diets (Figure 1A). Chow-fed mdKO mice had similar % fat mass (Figure 1B) but increased % lean mass (Figure 1C), consistent with the increased muscle mass previously described in this model (19). WT and mdKO mice on a HF diet (Figure 1A) had similar body weight gain and composition (Figure 1D-E).
HF mdKO mice have improved skeletal muscle insulin action
Oral glucose tolerance was not different between genotypes in mice on a chow diet (Figure 1F-G), but was significantly improved in HF mdKO mice compared to HF WT mice (Figure 1H-I).
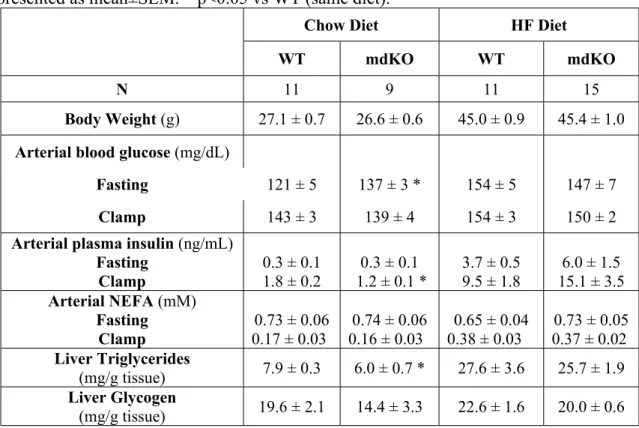
Fasting arterial glucose, arterial insulin, and glucose fluxes were not different between genotypes, regardless of diet (Table 1 and Figure 2). Blood glucose for all mice was maintained at euglycemia during the clamp (Figure 2A and 2G). The GIR was not different between genotypes on a chow diet (Figure 2B). In contrast, the GIR was markedly increased in HF-fed mdKO mice compared to their WT littermates (Figure 2H). Clamp endoRa was unchanged between genotypes regardless of diet (Figure 2C and 2I). Clamp Rd was not different between the chow-fed mice (Figure 2D). However, in HF-fed mice, Rd was significantly increased in the mdKO mice (Figure 2J).
Administration of [14C]2DG during the insulin clamp was used to determine insulin-stimulated Rg in specific tissues. HF-fed mdKO mice exhibited a strong increase in
SkM Rg, regardless of muscle type (gastrocnemius, vastus lateralis, tibialis anterior, EDL and soleus, Figure 2K and 2L). Fasting NEFA levels were unchanged between genotypes and were similarly suppressed by insulin during the clamp (Table 1).
Clamp insulin levels in HF mdKO mice trended higher compared to HF WT mice (Table 1). Although differences were not significant, this trend complicates the interpretation of clamps. This trend was due to four HF mdKO mice that had >2-fold higher insulin levels compared to the cohort average. A subgroup of clamp insulin-matched HF mice was created and analyzed after exclusion of these mice. The clamp data for this subgroup is presented in Supplemental Table 1. Results show that even when insulin levels are matched, HF mdKO mice exhibit markedly improved insulin action associated with increased SkM glucose uptake.
HF mdKO mice have improved SkM insulin signaling, GLUT4 translocation and hexokinase II content
To probe potential mechanisms for the improved SkM insulin action in mdKO mice, components of the SkM signaling pathway were investigated. The phosphorylation state of four key insulin-signaling proteins (IRS1-Ser302, Akt-Thr308, Akt-Ser473, AS160-Ser588 and mTOR-Ser2448) were measured in vastus collected from chow and HF mice after a 5h fast (basal) or clamp (insulin) (Figure 3A and Figure 4A). In chow-fed mice, phosphorylation of IRS1, Akt, AS160 and mTOR was unaffected by genotype, with unchanged insulin activation folds (Figure 3A-G). Hexokinase II levels were also unchanged (Figure 3F).
In HF WT mice (Figure 4), insulin modestly stimulated the P-Akt/Akt ratio, but neither P-IRS1/IRS1 nor P-AS160/AS160 ratios, indicative of SkM insulin resistance. In contrast to WT mice, insulin potently stimulated the phosphorylation state of all these signaling molecules in HF mdKO mice (Figure 4A-E), as the insulin-induced activation fold for these sites was significantly increased in HF mdKO mice. GLUT4 translocation to the SkM plasma membrane was assessed in insulin-clamped HF WT and mdKO muscle by immunofluorescence. Sarcolemmal GLUT4 was significantly increased in HF mdKO SkM (Figure 4F-G). HKII protein was significantly increased in HF mdKO muscle (Figure 4H).
The activation state of proteins in the mTOR pathway was investigated in HF mice (Figure 5). HF mdKO mice exhibited a reduction in fasting P-mTOR/mTOR, which is a point of intersection for insulin and AMPK signaling (Figure 5A-B). We substantiated the effectiveness of mTOR activation by probing the phosphorylation state of two downstream effectors of mTOR, p70S6K and S6 (Figure 5C-E). A similar profile was observed in the phosphorylation state of these proteins, with reduced activation during fasting, but increased insulin responsiveness. This further supports that the deficit in mTOR activation observed during insulin stimulation in HF WT mice was corrected HF mdKO mice. We further examined mTOR pathway regulation in HF mice by analysis of Raptor and TSC2 (tuberous sclerosis complex 2) activation states (Figure 5F-H). The phosphorylation state of Raptor-Ser792, a site phosphorylated by AMPK that inhibits mTOR (24), was unaffected by insulin and was insignificantly reduced in the mdKO muscle (Figure 5F). TSC2 is a negative regulator for mTOR and its activity is regulated by numerous phosphorylation sites (25). Two key phosphorylation sites are an inhibition site at Thr1462
(allowing for greater mTOR activation), and an activating site at Ser1387 (allowing for inhibition of mTOR). The phosphorylation state of these sites was unchanged by insulin in both HF WT and mdKO mice (Figure 5G-H). Together these data suggest that neither regulation by TSC2 nor Raptor are responsible for the insulin-dependent changes in mTOR activity in HF mdKO mice.
Gene expression for key markers of protein autophagy was reduced in HF mdKO muscle (Supplemental Figure S1A). Staining for endothelial marker CD31 in gastrocnemius showed no difference between groups (Supplemental Figure S1B). SkM fibrosis, as assessed by Trichrome Blue staining on gastrocnemius was unchanged between genotypes in HF-fed mice (Supplemental Figure S1B). Gene expression for four collagens (col1α1, col1α2, col3α1, col4α1) were unchanged between genotypes on HF diet (Supplemental Figure S1C).
HF mdKO mice display increased muscle glycolytic flux and decreased mitochondrial respiration
In order to determine the fate of the increased glucose uptake, rates of glycolysis and glucose storage were assessed during the insulin clamp. Whole body glycolysis during the clamp was significantly increased in HF mdKO mice (Figure 6A). The clamp rate of glucose storage was not different between genotypes (Figure 6B). SkM glucose-6-phosphate was unchanged (Figure 6C). Direct biochemical measurement of SkM glycogen confirmed these results. SkM glycogen was significantly reduced in HF mdKO mice (Figure 6D). SkM glycogen was also reduced in chow mdKO mice compared to their WT littermates (Supplemental Figure 2A). Plasma lactate was increased in HF mdKO mice
(Figure 6E). SkM triglyceride content was unchanged between HF WT and mdKO mice (Figure 6F).
SkM mitochondrial function was assessed in permeabilized gastrocnemius fibers from HF WT and mdKO mice. To assess muscle respiratory capacity specifically on glycolytic substrates, O2 consumption was measured in presence of ADP, malate, and increasing concentrations of pyruvate. The pyruvate-dependent O2 consumption rate in muscle fibers from mdKO mice was non-significantly reduced compared to the WT at the higher pyruvate concentrations (Figure 6G). The pyruvate-based respiration dose response was fitted to a Michaelis-Menten curve (goodness of fit r2=0.83 for WT, r2=0.77 for mdKO), allowing for determination of O2 consumption Vmax and Km. Vmax was significantly reduced in mdKO fibers (Figure 6G). In contrast, Km remained unchanged (Figure 5F).
Fasting chow-fed mice showed no detectable difference in mitochondrial content as measured by OXPHOS complexes or VDAC abundance (Supplemental Figure 2B). In contrast, in HF mice, citrate synthase (CS) activity, an index of mitochondrial content, was significantly reduced in HF mdKO white gastrocnemius (Figure 6H). Complex III of the electron transport chain was significantly reduced in HF mdKO SkM, while VDAC remained unchanged (Supplemental Figure S2C). Gene expression for pgc1α, a master regulator of mitochondrial biogenesis, was unaffected by genotype (Supplemental Figure S2D). The pgc1α target Mitochondrial Transcription Factor A (tfam) and two of its downstream targets (cytochrome c oxidase subunits cox1 and cox4), key markers of mitochondrial biogenesis, were downregulated. Overall, our findings point towards a reduction in mitochondrial electron transport components in HF mdKO SkM.
We tested whether the impaired mitochondrial function in HF mdKO muscle resulted in an energy deficit. Adenine nucleotide content was determined in gastrocnemius from 5h-fasted HF WT or mdKO mice. AMP, ADP, and ATP were all significantly decreased in muscle from mdKO mice, resulting in an overall reduction in the total adenine nucleotide pool (TAN) (Figure 6I-L). Despite the reduced adenine nucleotide pool, SkM of HF mdKO mice maintained energy charge at levels observed in HF WT mice (Figure 6M). Inosine monophosphate (IMP) levels tended to be higher in mdKO muscle, but differences did not reach significance (Figure 6N). SkM AMP deaminase (AMPD) activity was significantly increased in mdKO (Figure 6O). This was associated with an increase in AMPD protein content (Figure 6P). Adenylate kinase activity was not altered (Supplemental Figure S2E). While both NAD and NADP levels were significantly reduced, there were no changes in the NAD/NADH or NADP/NADPH ratios (Supplemental Table 2). Numerous nucleotides were significantly reduced in SkM of HF mdKO mice (NAM, NMN, ADP-ribose, GDP, GTP, among others; Supplemental Table 2).
Discussion
AMPK is important in allowing cells to meet energetic needs in the face of metabolic challenges. Overnutrition resulting from a calorie-rich diet places a burden on insulin-sensitive cells that results in metabolic dysregulation and insulin resistance. Despite the metabolic stress, muscle mass and energy status are uncompromised (1). There is little clarity of the role of AMPK in vivo in this setting. We hypothesized that AMPK is protective in the insulin resistant state because it promotes nutrient oxidation and maintains cellular energy. We tested this by deleting AMPK in mice made insulin resistant by
overnutrition. This hypothesis was not borne out. The presence of AMPK is not necessary to preserve energy status in the insulin resistant mouse. Instead we found that a seemingly paradoxical increase in insulin action compensates for SkM AMPK deletion. This finding is even more surprising as one considers that pharmacological compounds that activate AMPK have shown promise for their potential insulin-sensitizing effects (26). We provide evidence that deletion, as well as activation of AMPK (13), promotes glucose tolerance and insulin action in vivo.
The demonstration that mdKO mice on a regular chow diet have normal insulin action is in line with previous reports showing that mice expressing a muscle-specific dominant-negative AMPK (AMPKα2-DN) (7; 17) and SkM-specific AMPKβ1β2 KO mice (27) display normal glucose and insulin tolerances and no impairments in ex vivo insulin-stimulated SkM glucose uptake. While we did observe decreased muscle glycogen stores in lean mdKO mice, this did not contribute to overt deficits in glucose homeostasis. We did not detect changes in mitochondrial content in lean mdKO mice. This is consistent with previous studies showing that AMPK stimulatory effects on mitochondrial biogenesis are only manifested under circumstances that accelerate the need for mitochondrial biogenesis (e.g. exercise training or chronic β-guanidinopropionic acid treatment) (28-30).
When mdKO mice were fed a HF diet for 12 weeks, weight increased at the same rate regardless of genotype showing that total energy balance was unaffected. Whole body adiposity, liver, and muscle lipid accumulation also increased to the same degree as WT, indicating that SkM AMPK does not protect against ectopic lipid accumulation that occurs with overnutrition. These findings support similar conclusions reached with HF-fed
AMPKα2-DN mice (15; 17). In contrast to intraperitoneal glucose tolerance studies in HF-fed AMPKα2-DN mice, we observed a marked improvement in oral glucose tolerance and insulin action during clamps in mdKO mice fed a HFD.
Despite the improvement in insulin action in the HF mdKO mice, the full effects of insulin as seen in SkM of lean mice are not recapitulated. SkM insulin action in HF mdKO mice, while markedly improved relative to HF WT mice, was still impaired when compared to chow-fed mice. This is reflected by the reduction in whole body glucose kinetics in HF mdKO mice. The primary reason that the whole body effect is not restored in HF mdKO mice compared to lean mice is that the liver remains fully insulin resistant. Specific examination of SkM Rg shows that rates reach 75% of those seen in lean mice. The post-prandial rise in insulin typically stimulates glucose storage, and less so glycolysis (31). In the absence of AMPK, however, insulin-stimulated SkM glucose uptake was directed to the ATP-producing glycolytic pathway (Figure 7). This was associated with a reduction in glycogen mass, consistent with the correlation between SkM AMPK activity and glycogen content (2). This redirection of glucose to glycolysis allows mdKO SkM to compensate for mitochondrial dysfunction and subsequent defects in ATP generation. This may be directly linked to the critical importance of AMPK in the control of glycogen mass (32-39). We propose that in the absence of AMPK, increased insulin-stimulated glycolytic flux is key to maintaining energy state (Figure 7).
Pyruvate, the endpoint product of the glycolytic pathway, is a key substrate for mitochondrial respiration and ATP regeneration. We show that both pyruvate-based mitochondrial respiratory function and mitochondrial content, as reflected by a decrease in citrate synthase activity, were reduced by ~20%. This suggests that the decreased oxidative
metabolism may be linked to decreased mitochondrial content. This is consistent with previous reports that show that AMPK-deficient mice have reduced mitochondrial biogenesis (19; 27). The increased glycolytic flux in mdKO SkM, in the absence of efficient pyruvate-based mitochondrial respiration, was supported by the increase in arterial lactate in HF mdKO mice. These data support studies showing increased lactate production in chow-fed AMPKα2-DN during exercise (40).
Energy can be derived in SkM from protein autophagy (41). In line with previous findings (19), we found that genes regulating autophagy were downregulated in HF mdKO mice, and SkM mass was unchanged. Muscle mass and myocyte homeostasis is controlled in large part by mTOR, which is an important node common to AMPK and insulin signaling. Mice with a genetic SkM deficiency in mTOR signaling show severe reductions in SkM mass and mitochondrial metabolism, along with increased glycogen mass and Akt phosphorylation (42; 43). Preserving mTOR signaling is critical to the maintenance of muscle mass and function (44). The balance between the mTOR and AMPK signaling pathways allows for maintenance of muscle mass while preserving energy state. Deficient SkM mTOR signaling results in AMPK activation (45), and conversely deficient SkM AMPK signaling has been linked to increased mTOR signaling in lean mice (46). This interplay appears to be disrupted by HF-feeding as we found that fasting HF mdKO mice have reduced mTOR activation, despite reduced TSC2 phosphorylation at Ser1387, a state which would be expected to reduce the inhibitory activity of TSC2 on mTOR. However, the increase in insulin action in HF mdKO muscle fully corrects this impaired mTOR activation, without changes in TSC2 or Raptor phosphorylation. We postulate that the restored mTOR response to a physiological rise in insulin is critical for SkM metabolism
and this may contribute to the maintenance of SkM mass in the HF mdKO mice. However, the increased phosphorylation of mTOR in the insulin-stimulated state will increase the energetic burden on SkM by directly promoting protein synthesis, an energy-demanding process (44). In the context of reduced oxidative capacity, reduced glycogen stores, and reduced adenine nucleotide pool, downregulation of protein autophagy associated with net protein synthesis may further deprive SkM of energy-producing substrates and contribute to the reliance of the HF mdKO muscle on glycolysis.
Although SkM energy status as reflected by energy charge was unchanged in mdKO, nucleotides were significantly reduced in mdKO SkM (such as adenine nucleotides, NAD, NADP, GDP, GTP, among others). It is notable that, in addition to energy charge, the ratios of NAD/NADH and NADP/NADPH were maintained in HF mdKO muscle. This preserves the thermodynamics of ATP-coupled reactions and redox state. Moreover, the ratio of GDP to GTP was unchanged despite reductions in the nucleotides. This preserves the capacity for G-protein coupled reactions. These findings highlight the ability of the AMPK-deficient muscle cell to exquisitely fine-tune its metabolism to maintain energy homeostasis in spite of limited nucleotide availability and mitochondrial dysfunction. Energy status was protected by an increase in anaerobic glycolysis, which generates ATP, and an increase in AMPD, which prevents the build-up of the low energy adenine nucleotides.
We found that SkM of the resting HF mdKO mice are similar metabolically to SkM following high intensity exercise. In both cases, glycogen stores are depleted, total adenine nucleotides are reduced while AMPD flux is increased, and insulin action is increased (47-51). During exercise, the rise in IMP concomitant with adenine nucleotide depletion occur
via increased AMPD flux, a critical reaction for maintenance of energy charge in situations where ATP regeneration is unable to meet demand (52). The decreased nucleotide pool and increased AMPD flux is not typically observed in the SkM of resting obese mice (53). This is in contrast with our findings in the HF mdKO muscle. This “exercise-like” state could be one mechanism for the increased activation of the insulin signaling cascade observed in our model (51; 54; 55). In light of this metabolic resemblance, it is not surprising that SkM AMPK-deficient mouse models are exercise-intolerant (2).
Studies have shown that increased blood flow is an important component of improved SkM glucose uptake (51). While an increase in the number of CD31+ positive cells, a vascular endothelial cell marker, did not reach significance in HF-fed mdKO mice, the possibility that hemodynamic factors are important cannot be ruled out. Increased vascular reactivity, microvascular perfusion, and endothelial insulin permeability may contribute to the improved insulin action of the mdKO muscle. In this regard, studies have shown that AMPKα2-DN mice have impaired blood flow due to reduced NOS activity (40).
The decreased glycogen stores in basal HF mdKO could also contribute to the increase in SkM insulin action (31). Muscle glycogen was reduced to the same concentration in Chow mdKO and HF mdKO, however in HF mice the magnitude of the reduction relative to the WT mice appears more severe. Studies have shown an inverse relationship between SkM glycogen content and insulin-stimulated SkM glucose uptake (56). Further, insulin-induced cell surface GLUT4 content also inversely correlates with SkM glycogen content (57), and insulin-stimulated SkM Akt phosphorylation is enhanced
with low glycogen content (58; 59). The present studies support a link between decreased glycogen stores and increased insulin action in overnutrition.
Our findings are complementary to the studies carried out by Fentz and colleagues, where muscle glucose uptake was assessed in mdKO mice during exercise (60). As was expected, mdKO mice displayed severe exercise intolerance, however glucose uptake during matched exercise was found to be significantly increased in both soleus and EDL muscles of mdKO mice, with concomitant increases in GLUT4 and HKII protein content. Taken together with our findings, it appears that both exercise and HF feeding constitute a significant stressor to the AMPK-deficient muscle, triggering compensatory mechanisms that include increased glycolytic flux.
IRS1 receives negative feedback from both the insulin signaling pathway and the mTOR pathway, and this is thought to be an important mechanism for termination of insulin action (61-63). We hypothesize that the lack of IRS1 phosphorylation in either chow or HF WT muscle after the insulin clamp is due to the fact that the insulin clamp maintains high circulating insulin for 155 min, allowing enough time for these negative feedback mechanisms to exert their effects on IRS1 and the insulin receptor (64; 65). The finding that IRS1 phosphorylation remains high in HF mdKO muscle after completion of the insulin clamp might point to a disruption in the negative feedback loop in this model, and could contribute to the improved insulin action in these mice.
There is evidence that increased AMPK activation may counter impairments in insulin action (26). The present study shows a surprising reciprocity whereby enhanced insulin action compensates for the absence of AMPK in SkM of obese, but not lean mice. HF mdKO SkM exhibit reduced mitochondrial content and function, reduced glycogen
stores, and reduced ATP regeneration. The increased insulin-stimulated SkM glucose uptake and glycolytic flux compensate for these impairments and contribute to the maintenance of SkM energy balance (Figure 7). Moreover, an increase in insulin-stimulated mTOR activation may preserve lean mass homeostasis in HF mdKO SkM. These compensatory effects have whole-body consequences that manifest in the HF-fed mice as increased insulin action and glucose tolerance. In lean mice, the insulin-sensitizing effect of SkM AMPK deletion is not observed likely because the metabolic burden on lean mice is lower, and rates of glucose uptake and glycolysis are high enough to sustain energy status. It is only when these fluxes are impaired, such as during insulin resistance, that mechanisms that maintain energy state in the absence of AMPK become important. In conclusion, chronic absence of AMPKα1α2 subunits in SkM does not contribute to insulin resistance due to HF diet but ameliorates HF diet-induced glucose intolerance by dramatically enhancing SkM insulin action. SkM function during overnutrition is of such importance that insulin action is not compromised by AMPK deletion, but rather is increased to protect fundamental energetic processes.
Acknowledgements. The authors thank the Vanderbilt Mouse Metabolic Phenotyping Center (MMPC) Hormone Assay and Analytical Core (DK059637) for the insulin assay, and the MMPC Lipid and Lipoprotein Core for tissue lipid measurements. The GLUT4 imaging and immunohistochemistry were performed in part through the use of the Vanderbilt Translational Pathology Core as well as the VU Cell Imaging Shared Resource (supported by NIH grants CA068485, DK020593, DK058404, DK050277 and EY08126). We acknowledge the Vanderbilt Diabetes Research and Training Center (DK020593). Funding. This work was supported by National Institute of Health grant DK054902, the European Commission integrated project (LSHM-CT-2004- 005272), Agence Nationale de la Recherche (PHYSIO 2006 R06428KS), and Association Française contre les Myopathies (grant 14138).
Duality of Interest. No potential conflicts of interest relevant to this article were reported. Author Contributions. L.L. researched data and wrote the manuscript. A.S.W., I.M.W., D.P.B., M.G. and B.V. researched data. B.V. and M.F. provided the mouse line, contributed to discussion, and reviewed the manuscript. C.C.H. and D.H.W. contributed to discussion, edited and reviewed the manuscript. L.L. is the guarantor of this work and, as such, had full access to all the data in the study and takes responsibility for the integrity of the data and the accuracy of the data analysis.
Figure Legends
Figure 1: Glucose tolerance is improved in HF-fed mdKO mice
A. Body weight was monitored weekly in WT and mdKO on Chow and HF diet. N=20/group.
B-E. Body composition, expressed as % total body weight, was assessed at 18 weeks of age in all four groups of mice. N=6-9/group for chow mice, N=16/group for HF mice. F-H. Oral glucose tolerance was assessed in chow (F) or HF-fed mice (H) after 12 weeks of diet. AUC was calculated using the trapezoidal rule (G, I). N=10-12/group for chow mice, N=7-9/group for HF mice.
Figure 2: Insulin action and glucose clearance is improved in HF-fed mdKO mice A, G: Blood glucose was monitored throughout the clamp at 10 min intervals by sampling from the arterial catheter. Blood glucose was maintained at euglycemia (130 ~ 140 mg/dL) in both chow (A) and HF-fed (D) mice.
B, H: Rate of glucose infused in the venous catheter in order to maintain euglycemia in chow (B) or HF-fed (E) mice.
C, I: Endogenous glucose production (EndoRa) in chow (C) or HF-fed (F) mice.
D, I: Glucose disappearance rate (Rd) in chow (G) or HF-fed (I) WT and mdKO mice, determined by administration of [3-3H]glucose.
E, F, K, L: Glucose uptake (Rg) in gastrocnemius, vastus lateralis, tibialis anterior, extensor digitorum longus (EDL), perigonadal adipose tissue (PG AT), soleus, brown adipose tissue, heart and brain determined by administration of nonmetabolizable glucose 2-[14C]-deoxyglucose in chow (E, F) or HF-fed (K, L) WT and mdKO mice.
A-G: Vastus lateralis homogenates from 5h fasted (basal) or insulin-clamped mice were applied to a 4-12% SDS-PAGE. Western blotting was performed for P-IRS1 (Ser302), IRS1, Akt (Thr308 and Ser473), Akt, AS160 (Ser588), AS160, Hexokinase II, P-mTOR (Ser2448), P-mTOR, and GAPDH. Integrated intensities were normalized to respective total protein or GAPDH. * p<0.05 vs. basal (same genotype) by Tukey’s post-hoc. N=8/group. Insulin-induced activation fold for IRS1, Akt, AS160 and mTOR in insulin-clamped Chow WT and mdKO vastus lateralis, relative to the 5h-fasted basal state, were calculated as follows: (phospho/total ratio)insulin-stimulated state / (phospho/total ratio)fasted state. * p<0.05 vs. WT. N=8/group.
Figure 4: Insulin signaling and GLUT4 translocation is increased in muscle of HF-fed mdKO mice
A: Vastus lateralis homogenates from 5h fasted (basal) or insulin-clamped mice were applied to a 4-12% SDS-PAGE. Western blotting was performed for P-IRS1 (Ser302), IRS1, P-Akt (Thr308 and Ser473), Akt, P-AS160 (Ser588), AS160, AMPKa, and GAPDH. B-E: Integrated intensities were normalized to respective total protein. * p<0.05 vs. basal (same genotype), # p<0.05 vs. WT (same condition) by Tukey’s post-hoc. † p<0.05 mdKO basal vs WT basal by Student’s t-test. N=8/group. Insulin-induced activation fold for IRS1, AS160, and Akt in insulin-clamped HF WT and mdKO vastus lateralis, relative to the 5h-fasted basal state, were calculated as follows: (phospho/total ratio)insulin-stimulated state / (phospho/total ratio)fasted state.
F, G: Confocal imaging of GLUT4 and plasma membrane marker Caveolin-3 (Cav3) were performed on clamped (insulin-stimulated) gastrocnemius cryosections. Quantification of sarcolemmal GLUT4 was performed by Image J. N=11-15/group.
H: Vastus lateralis homogenates were applied to a 4-12% SDS-PAGE. Western blotting was performed for Hexokinase II (HKII) and GAPDH. Integrated intensities were normalized to GAPDH. Integrities were normalized to WT HF intensities. N=8/group. Figure 5: Insulin-responsiveness of mTOR signaling is improved in muscle of HF-fed mdKO mice
A, D: Vastus lateralis homogenates from 5h fasted (basal) or insulin-clamped mice were applied to a 4-12% SDS-PAGE. Western blotting was performed for P-mTOR (ser2448), mTOR, P-p70S6K (Thr389), p70S6K, P-S6 (Ser235/236), S6, P-TSC2 (Thr1462 and Ser1387), TSC2, P-Raptor (Ser792), Raptor, and GAPDH. B-C, E-H: Integrated intensities were normalized to respective total protein. * p<0.05 vs. basal (same genotype) by Tukey’s post-hoc. † p<0.05 mdKO basal vs WT basal by Student’s t-test. N=8/group. Insulin-induced activation fold in insulin-clamped HF WT and mdKO vastus lateralis, relative to the 5h-fasted basal state, were calculated as follows: (phospho/total ratio) insulin-stimulated state / (phospho/total ratio)fasted state.
Figure 6: Increased glycolytic flux mice compensates for decreased mitochondrial respiration, allowing for maintenance of energy charge in muscle of HF-fed mdKO A, B: Rate of glycolysis (A) and rate of glucose storage (B) in HF-fed WT and mdKO mice as measured during the insulin clamp by administration of [3-3H]glucose.
C: Glucose-6-phosphate was measured in frozen gastrocnemius from insulin clamped HF-fed WT and mdKO mice. N=11-15/group.
D: Glycogen levels were measured in vastus lateralis of 5h fasted HF WT and mdKO mice. N=12/group.
E: Plasma lactate was measured from plasma collected during the clamp in HF WT and mdKO mice. N=11-15/group.
F: Triglycerides were measured from gastrocnemius of 5h fasted HF WT and mdKO mice. N=12/group.
G: High-resolution respirometry was performed on permeabilized white gastrocnemius fiber bundles isolated from 5h fasted HF-fed WT or mdKO mice. Oxygen flux was measured in presence of malate (2mM) and ADP (2mM), and increasing concentrations of pyruvate. Oxygen flux was normalized to fiber wet weight. Vmax and Km were calculated using Prism’s Michaelis-Menten non-linear regression. N=9-11/group
H: Citrate synthase activity was measured in white gastrocnemius from 5h fasted HF-fed WT or mdKO mice. N=9-11/group
I-N: AMP, ADP, ATP and inosine monophosphate (IMP) levels were assessed in flash-frozen white gastrocnemius from 5h fasted HF-fed WT and mdKO mice. L: The total adenine nucleotide pool (TAN) is the sum of AMP, ADP and ATP levels. The Energy Charge (M) were calculated from AMP, ADP and ATP levels.
O: AMP deaminase (AMPD) activity in vivo was calculated as [IMP]/[AMP]. N=8-11/group.
P: Western blotting was performed for AMPD and GAPDH in vastus lateralis muscle from 5h-fasted mice. Integrated intensities were normalized to GAPDH. Integrities were normalized to WT HF intensities. N=6/group.
Figure 7: Improved insulin action and anaerobic glycolysis in HF mdKO skeletal muscle. Absence of AMPK in skeletal muscle induces chronic energy deficit due to depleted glycogen stores, reduced autophagy, and reduced mitochondrial content and function. The skeletal muscle compensates for these deficiencies by increasing glycolytic flux through increased insulin action, thanks to the activation and upregulation of key components of the glucose uptake machinery. This allows for increased muscle glucose uptake and ATP generation through anaerobic glycolysis, thereby maintaining energy production and muscle energy state. Restoration of mTOR responsiveness to insulin may contribute to maintenance of lean mass.
Green arrows indicate increased measurement compared to HF WT mice, while red arrows indicate reduced measurement compared to HF WT mice.
IRS: Insulin Receptor Substrate; AS160: Akt Substrate 160kDa; GLUT4: Glucose Transporter 4; HKII: Hexokinase II; mTOR: mammalian Target Of Rapamycin.
References
1. Steinberg GR, Smith AC, Van Denderen BJ, Chen Z, Murthy S, Campbell DJ, Heigenhauser GJ, Dyck DJ, Kemp BE. AMP-activated protein kinase is not down-regulated in human skeletal muscle of obese females. J Clin Endocrinol Metab 2004;89:4575-4580
2. Kjobsted R, Hingst JR, Fentz J, Foretz M, Sanz MN, Pehmoller C, Shum M, Marette A, Mounier R, Treebak JT, Wojtaszewski JFP, Viollet B, Lantier L. AMPK in skeletal muscle function and metabolism. Faseb J 2018;32:1741-1777
3. Kjobsted R, Munk-Hansen N, Birk JB, Foretz M, Viollet B, Bjornholm M, Zierath JR, Treebak JT, Wojtaszewski JF. Enhanced Muscle Insulin Sensitivity After Contraction/Exercise Is Mediated by AMPK. Diabetes 2017;66:598-612
4. Marcinko K, Bujak AL, Lally JS, Ford RJ, Wong TH, Smith BK, Kemp BE, Jenkins Y, Li W, Kinsella TM, Hitoshi Y, Steinberg GR. The AMPK activator R419 improves exercise capacity and skeletal muscle insulin sensitivity in obese mice. Mol Metab 2015;4:643-651
5. Narkar VA, Downes M, Yu RT, Embler E, Wang YX, Banayo E, Mihaylova MM, Nelson MC, Zou Y, Juguilon H, Kang H, Shaw RJ, Evans RM. AMPK and PPARdelta agonists are exercise mimetics. Cell 2008;134:405-415
6. Fisher JS, Gao J, Han DH, Holloszy JO, Nolte LA. Activation of AMP kinase enhances sensitivity of muscle glucose transport to insulin. Am J Physiol Endocrinol Metab 2002;282:E18-23
7. Mu J, Brozinick JT, Jr., Valladares O, Bucan M, Birnbaum MJ. A role for AMP-activated protein kinase in contraction- and hypoxia-regulated glucose transport in skeletal muscle. Mol Cell 2001;7:1085-1094
8. Merrill GF, Kurth EJ, Hardie DG, Winder WW. AICA riboside increases AMP-activated protein kinase, fatty acid oxidation, and glucose uptake in rat muscle. Am J Physiol 1997;273:E1107-1112
9. Kurth-Kraczek EJ, Hirshman MF, Goodyear LJ, Winder WW. 5' AMP-activated protein kinase activation causes GLUT4 translocation in skeletal muscle. Diabetes 1999;48:1667-1671
10. Kjobsted R, Treebak JT, Fentz J, Lantier L, Viollet B, Birk JB, Schjerling P, Bjornholm M, Zierath JR, Wojtaszewski JF. Prior AICAR stimulation increases insulin sensitivity in mouse skeletal muscle in an AMPK-dependent manner. Diabetes 2015;64:2042-2055
11. Wang P, Zhang RY, Song J, Guan YF, Xu TY, Du H, Viollet B, Miao CY. Loss of AMP-activated protein kinase-alpha2 impairs the insulin-sensitizing effect of calorie restriction in skeletal muscle. Diabetes 2012;61:1051-1061
12. Kristensen JM, Treebak JT, Schjerling P, Goodyear L, Wojtaszewski JF. Two weeks of metformin treatment induces AMPK-dependent enhancement of insulin-stimulated glucose uptake in mouse soleus muscle. Am J Physiol Endocrinol Metab 2014;306:E1099-1109
13. Cokorinos EC, Delmore J, Reyes AR, Albuquerque B, Kjobsted R, Jorgensen NO, Tran JL, Jatkar A, Cialdea K, Esquejo RM, Meissen J, Calabrese MF, Cordes J, Moccia R, Tess D, Salatto CT, Coskran TM, Opsahl AC, Flynn D, Blatnik M, Li W, Kindt E, Foretz
Miller RA. Activation of Skeletal Muscle AMPK Promotes Glucose Disposal and Glucose Lowering in Non-human Primates and Mice. Cell Metab 2017;25:1147-1159 e1110
14. Myers RW, Guan HP, Ehrhart J, Petrov A, Prahalada S, Tozzo E, Yang X, Kurtz MM, Trujillo M, Gonzalez Trotter D, Feng D, Xu S, Eiermann G, Holahan MA, Rubins D, Conarello S, Niu X, Souza SC, Miller C, Liu J, Lu K, Feng W, Li Y, Painter RE, Milligan JA, He H, Liu F, Ogawa A, Wisniewski D, Rohm RJ, Wang L, Bunzel M, Qian Y, Zhu W, Wang H, Bennet B, LaFranco Scheuch L, Fernandez GE, Li C, Klimas M, Zhou G, van Heek M, Biftu T, Weber A, Kelley DE, Thornberry N, Erion MD, Kemp DM, Sebhat IK. Systemic pan-AMPK activator MK-8722 improves glucose homeostasis but induces cardiac hypertrophy. Science 2017;357:507-511
15. Fujii N, Ho RC, Manabe Y, Jessen N, Toyoda T, Holland WL, Summers SA, Hirshman MF, Goodyear LJ. Ablation of AMP-activated protein kinase alpha2 activity exacerbates insulin resistance induced by high-fat feeding of mice. Diabetes 2008;57:2958-2966
16. Dasgupta B, Ju JS, Sasaki Y, Liu X, Jung SR, Higashida K, Lindquist D, Milbrandt J. The AMPK beta2 subunit is required for energy homeostasis during metabolic stress. Mol Cell Biol 2012;32:2837-2848
17. Beck Jorgensen S, O'Neill HM, Hewitt K, Kemp BE, Steinberg GR. Reduced AMP-activated protein kinase activity in mouse skeletal muscle does not exacerbate the development of insulin resistance with obesity. Diabetologia 2009;52:2395-2404 18. Frosig C, Jensen TE, Jeppesen J, Pehmoller C, Treebak JT, Maarbjerg SJ, Kristensen JM, Sylow L, Alsted TJ, Schjerling P, Kiens B, Wojtaszewski JF, Richter EA. AMPK and insulin action--responses to ageing and high fat diet. PLoS One 2013;8:e62338
19. Lantier L, Fentz J, Mounier R, Leclerc J, Treebak JT, Pehmoller C, Sanz N, Sakakibara I, Saint-Amand E, Rimbaud S, Maire P, Marette A, Ventura-Clapier R, Ferry A, Wojtaszewski JF, Foretz M, Viollet B. AMPK controls exercise endurance, mitochondrial oxidative capacity, and skeletal muscle integrity. Faseb J 2014;28:3211-3224
20. Berglund ED, Li CY, Poffenberger G, Ayala JE, Fueger PT, Willis SE, Jewell MM, Powers AC, Wasserman DH. Glucose metabolism in vivo in four commonly used inbred mouse strains. Diabetes 2008;57:1790-1799
21. Rossetti L, Lee YT, Ruiz J, Aldridge SC, Shamoon H, Boden G. Quantitation of glycolysis and skeletal muscle glycogen synthesis in humans. Am J Physiol 1993;265:E761-769
22. Lantier L, Williams AS, Williams IM, Yang KK, Bracy DP, Goelzer M, James FD, Gius D, Wasserman DH. SIRT3 Is Crucial for Maintaining Skeletal Muscle Insulin Action and Protects Against Severe Insulin Resistance in High-Fat-Fed Mice. Diabetes 2015;64:3081-3092
23. Hepple RT, Baker DJ, Kaczor JJ, Krause DJ. Long-term caloric restriction abrogates the age-related decline in skeletal muscle aerobic function. Faseb J 2005;19:1320-1322
24. Shaw RJ. LKB1 and AMP-activated protein kinase control of mTOR signalling and growth. Acta Physiol (Oxf) 2009;196:65-80
26. Winder WW, Hardie DG. AMP-activated protein kinase, a metabolic master switch: possible roles in type 2 diabetes. Am J Physiol 1999;277:E1-10
27. O'Neill HM, Maarbjerg SJ, Crane JD, Jeppesen J, Jorgensen SB, Schertzer JD, Shyroka O, Kiens B, van Denderen BJ, Tarnopolsky MA, Kemp BE, Richter EA, Steinberg GR. AMP-activated protein kinase (AMPK) beta1beta2 muscle null mice reveal an essential role for AMPK in maintaining mitochondrial content and glucose uptake during exercise. Proc Natl Acad Sci U S A 2011;108:16092-16097
28. Zong H, Ren JM, Young LH, Pypaert M, Mu J, Birnbaum MJ, Shulman GI. AMP kinase is required for mitochondrial biogenesis in skeletal muscle in response to chronic energy deprivation. Proc Natl Acad Sci U S A 2002;99:15983-15987
29. Rockl KS, Hirshman MF, Brandauer J, Fujii N, Witters LA, Goodyear LJ. Skeletal muscle adaptation to exercise training: AMP-activated protein kinase mediates muscle fiber type shift. Diabetes 2007;56:2062-2069
30. Brandauer J, Andersen MA, Kellezi H, Risis S, Frosig C, Vienberg SG, Treebak JT. AMP-activated protein kinase controls exercise training- and AICAR-induced increases in SIRT3 and MnSOD. Front Physiol 2015;6:85
31. Jensen J, Rustad PI, Kolnes AJ, Lai YC. The role of skeletal muscle glycogen breakdown for regulation of insulin sensitivity by exercise. Front Physiol 2011;2:112 32. Holmes BF, Kurth-Kraczek EJ, Winder WW. Chronic activation of 5'-AMP-activated protein kinase increases GLUT-4, hexokinase, and glycogen in muscle. J Appl Physiol (1985) 1999;87:1990-1995
33. Ojuka EO, Nolte LA, Holloszy JO. Increased expression of GLUT-4 and hexokinase in rat epitrochlearis muscles exposed to AICAR in vitro. J Appl Physiol (1985) 2000;88:1072-1075
34. Milan D, Jeon JT, Looft C, Amarger V, Robic A, Thelander M, Rogel-Gaillard C, Paul S, Iannuccelli N, Rask L, Ronne H, Lundstrom K, Reinsch N, Gellin J, Kalm E, Roy PL, Chardon P, Andersson L. A mutation in PRKAG3 associated with excess glycogen content in pig skeletal muscle. Science 2000;288:1248-1251
35. Mu J, Barton ER, Birnbaum MJ. Selective suppression of AMP-activated protein kinase in skeletal muscle: update on 'lazy mice'. Biochem Soc Trans 2003;31:236-241 36. Barnes BR, Marklund S, Steiler TL, Walter M, Hjalm G, Amarger V, Mahlapuu M, Leng Y, Johansson C, Galuska D, Lindgren K, Abrink M, Stapleton D, Zierath JR, Andersson L. The 5'-AMP-activated protein kinase gamma3 isoform has a key role in carbohydrate and lipid metabolism in glycolytic skeletal muscle. J Biol Chem 2004;279:38441-38447
37. Hunter RW, Treebak JT, Wojtaszewski JF, Sakamoto K. Molecular mechanism by which AMP-activated protein kinase activation promotes glycogen accumulation in muscle. Diabetes 2011;60:766-774
38. Hasenour CM, Ridley DE, Hughey CC, James FD, Donahue EP, Shearer J, Viollet B,
Foretz M, Wasserman DH.
5-Aminoimidazole-4-carboxamide-1-beta-D-ribofuranoside (AICAR) effect on glucose production, but not energy metabolism, is independent of hepatic AMPK in vivo. J Biol Chem 2014;289:5950-5959
39. Hughey CC, James FD, Bracy DP, Donahue EP, Young JD, Viollet B, Foretz M, Wasserman DH. Loss of hepatic AMP-activated protein kinase impedes the rate of glycogenolysis but not gluconeogenic fluxes in exercising mice. J Biol Chem
40. Lee-Young RS, Griffee SR, Lynes SE, Bracy DP, Ayala JE, McGuinness OP, Wasserman DH. Skeletal muscle AMP-activated protein kinase is essential for the metabolic response to exercise in vivo. J Biol Chem 2009;284:23925-23934
41. Sandri M. Autophagy in health and disease. 3. Involvement of autophagy in muscle atrophy. Am J Physiol Cell Physiol 2010;298:C1291-1297
42. Risson V, Mazelin L, Roceri M, Sanchez H, Moncollin V, Corneloup C, Richard-Bulteau H, Vignaud A, Baas D, Defour A, Freyssenet D, Tanti JF, Le-Marchand-Brustel Y, Ferrier B, Conjard-Duplany A, Romanino K, Bauche S, Hantai D, Mueller M, Kozma SC, Thomas G, Ruegg MA, Ferry A, Pende M, Bigard X, Koulmann N, Schaeffer L, Gangloff YG. Muscle inactivation of mTOR causes metabolic and dystrophin defects leading to severe myopathy. J Cell Biol 2009;187:859-874
43. Bentzinger CF, Romanino K, Cloetta D, Lin S, Mascarenhas JB, Oliveri F, Xia J, Casanova E, Costa CF, Brink M, Zorzato F, Hall MN, Ruegg MA. Skeletal muscle-specific ablation of raptor, but not of rictor, causes metabolic changes and results in muscle dystrophy. Cell Metab 2008;8:411-424
44. Yoon MS. mTOR as a Key Regulator in Maintaining Skeletal Muscle Mass. Front Physiol 2017;8:788
45. Aguilar V, Alliouachene S, Sotiropoulos A, Sobering A, Athea Y, Djouadi F, Miraux S, Thiaudiere E, Foretz M, Viollet B, Diolez P, Bastin J, Benit P, Rustin P, Carling D, Sandri M, Ventura-Clapier R, Pende M. S6 kinase deletion suppresses muscle growth adaptations to nutrient availability by activating AMP kinase. Cell Metab 2007;5:476-487
46. Lantier L, Mounier R, Leclerc J, Pende M, Foretz M, Viollet B. Coordinated maintenance of muscle cell size control by AMP-activated protein kinase. Faseb J 2010;24:3555-3561
47. Green HJ. Mechanisms of muscle fatigue in intense exercise. J Sports Sci 1997;15:247-256
48. Peake JM, Neubauer O, Della Gatta PA, Nosaka K. Muscle damage and inflammation during recovery from exercise. J Appl Physiol (1985) 2017;122:559-570
49. Hearris MA, Hammond KM, Fell JM, Morton JP. Regulation of Muscle Glycogen Metabolism during Exercise: Implications for Endurance Performance and Training Adaptations. Nutrients 2018;10
50. Hellsten Y, Richter EA, Kiens B, Bangsbo J. AMP deamination and purine exchange in human skeletal muscle during and after intense exercise. J Physiol 1999;520 Pt 3:909-920
51. Sjoberg KA, Frosig C, Kjobsted R, Sylow L, Kleinert M, Betik AC, Shaw CS, Kiens B, Wojtaszewski JFP, Rattigan S, Richter EA, McConell GK. Exercise Increases Human Skeletal Muscle Insulin Sensitivity via Coordinated Increases in Microvascular Perfusion and Molecular Signaling. Diabetes 2017;66:1501-1510
52. Hancock CR, Brault JJ, Terjung RL. Protecting the cellular energy state during contractions: role of AMP deaminase. J Physiol Pharmacol 2006;57 Suppl 10:17-29 53. Admyre T, Amrot-Fors L, Andersson M, Bauer M, Bjursell M, Drmota T, Hallen S, Hartleib-Geschwindner J, Lindmark B, Liu J, Lofgren L, Rohman M, Selmi N, Wallenius K. Inhibition of AMP deaminase activity does not improve glucose control in rodent models of insulin resistance or diabetes. Chem Biol 2014;21:1486-1496
54. Richter EA, Mikines KJ, Galbo H, Kiens B. Effect of exercise on insulin action in human skeletal muscle. J Appl Physiol (1985) 1989;66:876-885
55. Koval JA, Maezono K, Patti ME, Pendergrass M, DeFronzo RA, Mandarino LJ. Effects of exercise and insulin on insulin signaling proteins in human skeletal muscle. Med Sci Sports Exerc 1999;31:998-1004
56. Jensen J, Aslesen R, Ivy JL, Brors O. Role of glycogen concentration and epinephrine on glucose uptake in rat epitrochlearis muscle. Am J Physiol 1997;272:E649-655
57. Derave W, Lund S, Holman GD, Wojtaszewski J, Pedersen O, Richter EA. Contraction-stimulated muscle glucose transport and GLUT-4 surface content are dependent on glycogen content. Am J Physiol 1999;277:E1103-1110
58. Derave W, Hansen BF, Lund S, Kristiansen S, Richter EA. Muscle glycogen content affects insulin-stimulated glucose transport and protein kinase B activity. Am J Physiol Endocrinol Metab 2000;279:E947-955
59. Lai YC, Zarrinpashneh E, Jensen J. Additive effect of contraction and insulin on glucose uptake and glycogen synthase in muscle with different glycogen contents. J Appl Physiol (1985) 2010;108:1106-1115
60. Fentz J, Kjobsted R, Birk JB, Jordy AB, Jeppesen J, Thorsen K, Schjerling P, Kiens B, Jessen N, Viollet B, Wojtaszewski JF. AMPKalpha is critical for enhancing skeletal muscle fatty acid utilization during in vivo exercise in mice. Faseb J 2015;29:1725-1738
61. Haruta T, Uno T, Kawahara J, Takano A, Egawa K, Sharma PM, Olefsky JM, Kobayashi M. A rapamycin-sensitive pathway down-regulates insulin signaling via phosphorylation and proteasomal degradation of insulin receptor substrate-1. Mol Endocrinol 2000;14:783-794
62. Gual P, Le Marchand-Brustel Y, Tanti JF. Positive and negative regulation of insulin signaling through IRS-1 phosphorylation. Biochimie 2005;87:99-109
63. Tremblay F, Marette A. Amino acid and insulin signaling via the mTOR/p70 S6 kinase pathway. A negative feedback mechanism leading to insulin resistance in skeletal muscle cells. J Biol Chem 2001;276:38052-38060
64. Edick AM, Auclair O, Burgos SA. Role of Grb10 in mTORC1-dependent regulation of insulin signaling and action in human skeletal muscle cells. Am J Physiol Endocrinol Metab 2020;318:E173-E183
65. Taniguchi CM, Emanuelli B, Kahn CR. Critical nodes in signalling pathways: insights into insulin action. Nat Rev Mol Cell Biol 2006;7:85-96
Table 1: Metabolic parameters of insulin-clamped WT and mdKO mice. Data presented as mean±SEM. * p<0.05 vs WT (same diet).
Chow Diet HF Diet
WT mdKO WT mdKO
N 11 9 11 15
Body Weight (g) 27.1 ± 0.7 26.6 ± 0.6 45.0 ± 0.9 45.4 ± 1.0 Arterial blood glucose (mg/dL)
Fasting 121 ± 5 137 ± 3 * 154 ± 5 147 ± 7
Clamp 143 ± 3 139 ± 4 154 ± 3 150 ± 2
Arterial plasma insulin (ng/mL) Fasting Clamp 0.3 ± 0.1 1.8 ± 0.2 0.3 ± 0.1 1.2 ± 0.1 * 3.7 ± 0.5 9.5 ± 1.8 6.0 ± 1.5 15.1 ± 3.5 Arterial NEFA (mM) Fasting Clamp 0.73 ± 0.06 0.17 ± 0.03 0.74 ± 0.06 0.16 ± 0.03 0.65 ± 0.04 0.38 ± 0.03 0.73 ± 0.05 0.37 ± 0.02 Liver Triglycerides (mg/g tissue) 7.9 ± 0.3 6.0 ± 0.7 * 27.6 ± 3.6 25.7 ± 1.9 Liver Glycogen (mg/g tissue) 19.6 ± 2.1 14.4 ± 3.3 22.6 ± 1.6 20.0 ± 0.6
0 100 200 300 400 500 600 0 20 40 60 80 100 WT Chow mdKO Chow 0 100 200 300 400 500 600 0 20 40 60 80 100 WT HF mdKO HF 0 10 20 30 40 0 5 10 15 20
WT chow mdKO chow
WT HFD mdKO HFD gr am s 0 10 20 30 0 20 40 60 0 10 20 30 0 20 40 60 Chow Chow HF HF
oGTT AUC oGTT AUC
Age (weeks)
Time (min) Time (min)
Bl oo d gl uc os e (m g/ dL ) Bl oo d gl uc os e (m g/ dL )
Chow High Fat
WT
mdKO
F
G
H
I
* * * ** ** * ** m g. m in/ dL m g. m in/ dLFigure 1
0 10000 20000 30000 40000 50000 Chow Chow 0 10000 20000 30000 40000 50000 HF HF0 10 20 30
Gastroc Vastus L.Tibialis A. EDL PG AT
0 50 100 150 200 250
Soleus Brown Heart Brain
0 10 20 30 40 Basal Clamp 0 10 20 30 40 0 20 40 60 80 100 120 WT mdKO 0 50 100 150 -20 0 20 40 60 80 100 120 WT mdKO Time (min) mg .k g -1.m in -1 mg /dL 0 10 20 Basal Clamp 0 20 40 60 Basal Clamp Time (min) mg .k g -1.m in -1 Rd Rd mg .k g -1.m in -1 mg .k g -1.m in -1 Time (min)
D
E
J
K
** 0 10 20 30Gastroc Vastus L.Tibialis A. EDL PG AT
0 100 200 300 400 500
Soleus Brown AT Heart Brain
µmo l.mi n -1.1 00 g tis sue -1
Tissue-specific glucose uptake Tissue-specific glucose uptake
* µmo l.mi n -1.1 00 g tis sue -1 * *** * ** *
Tissue-specific glucose uptake Tissue-specific glucose uptake
0 5 10 15 20 Basal Clamp 0 10 20 30 40 50 60 0 20 40 60 80 100 120 WT mdKO 0 50 100 150 200 -20 0 20 40 60 80 100 120 WT mdKO mg /dL mg .k g -1.m in -1 mg .k g -1.m in -1 High Fat
G
H
F
* * * ** Time (min)Blood glucose Glucose Infusion Rate
I
EndoRa0 1 2 3 0.0 0.5 1.0 1.5 2.0 2.5
Basal Insulin Basal Insulin WT mdKO 0 1 2 0 1 Basal Insul in Basal Insul in A. U .
P-Akt (Thr 308)/Akt P-Akt (Ser 473)/Akt
P-mTOR (Ser 2448)/mTOR
A. U . A. U . P-IRS1 (Ser 302) IRS1 P-Akt (Ser 473) P-AS160 (Ser 588) AS160 P-mTOR (Ser 2448) mTOR GAPDH HKII P-Akt (Thr 308) Akt
Figure 3
WT mdKO 0 1Basal Insulin Basal Insulin WT mdKO 0.0 0.5 1.0 1.5 2.0
Basal Insulin Basal Insulin WT mdKO 0 1 2 3 4 5 6
Basal Insulin Basal Insulin WT mdKO * * * 0 1 2 3
Basal Insulin Basal Insulin WT mdKO 0 1 2 3 0 1 2 3 4 5 6 Insulin Activation Fold Insulin Activation Fold Insulin Activation Fold Insulin Activation Fold Insulin Activation Fold
D
E
0.0 0.5 1.0 1.5Basal Insulin Basal Insulin WT mdKO
HKII
F
G
**
Check mTor significance
0 1 2 3 4 5
Basal Insulin Basal Insulin WT mdKO 0 2 4 6 8 0 1
Basal Insulin Basal Insulin WT mdKO
0 1 2 3
Basal Insulin Basal Insulin WT mdKO
0 1 2
Basal Insulin Basal Insulin WT mdKO # P-Akt (Thr 308)/Akt
WT
mdKO
D
Figure 4
0 2 * 0 2 4 6 0 1 2 Insulin Activation Fold Insulin Activation Fold Insulin Activation Fold * *** * *** **P-Akt (Ser 473)/Akt
Insulin Activation Fold * # ** P-IRS1 (Ser 302) IRS1
Basal Insulin Basal Insulin
P-Akt (Ser 473) Akt P-AS160 (Ser 588) AS160 AMPKa GAPDH P-Akt (Thr 308)
E
A. U . A. U . 0.00 0.01 0.02 0.03 0.04 Sa rc ol em m al GL U T4 (m ea n Int ens ity /s q. pi xe l) * Insulin-stimulated Sarcolemmal GLUT4 HF 0.0 0.5 1.0 1.5 HKII * HKII WT mdKO GAPDH HF HF mdKO HF WT HF GLUT4 Cav3G
H
A. U .F
† † †0 1 2
Basal Insulin Basal Insulin WT mdKO
0.0 0.5 1.0 1.5
Basal Insulin Basal Insulin WT mdKO 0 1 2 3 0 1 2 0 1 2
Basal Insulin Basal Insulin WT mdKO
0.0 0.5 1.0 1.5
Basal Insulin Basal Insulin WT mdKO 0 1 2 3 4 5 6 0 1 2 0.0 0.5 1.0 1.5
Basal Insulin Basal Insulin WT mdKO **
WT
mdKO
Figure 5
0 1 2 3 Insulin Activation Fold *** A. U . 0.0 0.5 1.0 1.5Basal Insulin Basal Insulin WT mdKO 0 1 2 3 4 5 ** Insulin Activation Fold P-mTOR (Ser 2448) mTOR Ba Ba GAPDH P-p70S6K (Thr 389) p70S6K
P-S6 (Ser 235)/S6 P-Raptor (Ser 792)/Raptor
P-TSC2 (Thr 1462)/TSC2 P-TSC2 (Ser 1387)/TSC2 Basal Insul in WT mdKO Basal Insul in S6 P-TSC2 (Ser 1387) TSC2 GAPDH P-S6 (Ser 235/236) P-TSC2 (Thr 1462) Raptor P-Raptor (Ser 792) A. U . * A. U . Insulin Activation Fold *
D
E
F
G
Figure :Vastus lateralis homogenates from 5h fasted or insulin-clamped mice were applied to a 4-12% SDS-PAGE. Western blotting was performed for P-S6 (Ser235/236), S6, P-TSC2 (Thr1462 and Ser1387), TSC2, P-Raptor (Ser792), Raptor, and GAPDH. TSC2 is a negative regulator of mTOR. Phosphorylation on Thr1462 is inhibitory, allowing increased mTOR activity. In contrast, phosphorylation on Ser1387 is activating for TSC2, allowing inhibition of mTOR. Integrated intensities were normalized to respective total protein. * p<0.05 vs. basal (same genotype), # p<0.05 vs. WT (same condition). N=8/group.
Insulin Activation Fold ** Insulin Activation Fold Insulin Activation Fold
H
†† † †0.0 0.5 1.0 1.5 2.0 0 1 2 3 0.00 0.04 0.08 0.12 0 5 10 15 20 25 0 5 10 15 20 25 0 5 10 15 20 25 0.0 0.2 0.4 0.6 0.8 1.0 0.0 1.0 2.0 3.0 4.0 *** * µg /m g m us cl e mM m g/ g m us cl e mg .k g -1.m in -1 mg .k g -1.m in -1 * 0.0 0.1 0.2 0.3 0.4 0.5 0.6 0.7
WT
mdKO
0 5 10 15 20 25 30 35 1 10 100 1000 10000 WT mdKO pm ol .s -1.m g m us cl e -1Oxygen Consumption Rate
[Pyruvate] (µM) 0 1 2 3 4 5 6 0 10 20 30 40 0 10 20 30 40 50 0.6 0.8 1.0 0.0 0.2 0.4 0.6 0.8 1.0 CS Activity µmo l.mi n -1.m g pr ot -1 **
AMP ADP ATP
TAN ChargeEnergy
nm ol /m g dr y m us cl e nm ol /m g dr y m us cl e ** ** ** ***
G
H
I
J
K
L
N
Figure 6
IMP ActivityAMPD
p=0.09
M
O
P
0.0 0.5 1.0 1.5 AMPD protein * * WT mdKO p value Vmax 30.3 ± 1.2 26.5 ± 1.3 0.0471 Km 72 ± 13 67 ± 16 0.8390 A. U . A. U . nm ol /m g dr y m us cl e AMPD WT mdKO GAPDH WT mdKO nm ol /m g m us cl eATP Glucose Glycogen Insulin GLUT4 P
é
IRS P Pé
Glycolysis Pyruvateé
LactateMitochondrial content and function
é
é
é
é
ATPé
AMP AMP/ATP maintained Akt P AS160 P HKIIFigure 6
é
P mTOR Muscle mass maintained Key:Colored arrows denote an increase (green) or a reduction (red) as compared to HF WT littermate mice.
é
é
é
é
Autophagyé
é
P p70S6KOral glucose tolerance test
To confirm that clamp results at Vanderbilt University are consistent with related measurements at a second site, OGTTs were performed at the Institut Cochin, INSERM Paris, France. Lean and HF male mdKO and WT littermate mice were fasted for 16h, after which a baseline blood glucose measurement was performed (t=0 min). This was immediately followed by administration of a glucose solution (2 g/kg body weight) by oral gavage. Tail blood glucose was measured every 20 min. Baseline corrected area under the curve (AUC) was calculated using the trapezoidal rule (0-100 min).
Plasma and tissue processing
Radioactivity of [3-3H]glucose, [14C]2DG and [14C]2DG-6-P were determined as previously described (1-3). Plasma insulin was determined by RIA (MMPC Hormone Assay and Analytical Subcore). SkM glycogen was determined using the method of Chan and Exton (4). Tissue lipids were measured by gas chromatography (MMPC Lipid, Lipoprotein, and Atherosclerosis Subcore). Plasma non-esterified fatty acids (NEFAs) and lactate were determined by colorimetric assays. SkM glucose-6-phosphate was measured enzymatically using a fluorometric assay. SkM nucleotides were measured in white gastrocnemius from a separate cohort of mice (freeze-clamped in liquid nitrogen within 30 sec of cervical dislocation) by LC/MS at the Lake Nona Metabolomics Core (Sanford Burnham Prebys), and energy charge was calculated as EC=(ATP+0.5ADP)/(ATP+ADP+AMP). SkM AMP deaminase (AMPD) activity in vivo was calculated as IMP/AMP, and SkM adenylate kinase activity in vivo was calculated as 2ADP/(AMP+ATP).
Real time qPCR
mRNA was extracted from freeze-clamped vastus lateralis using the Qiagen RNeasy Mini kit, and gene expression was determined by Taqman Assays (ThermoFisher): foxo3 (mm01185722_m1), bnip3 (mm01275600_g1), atg12 (mm00503201_m1), tfam (mm00447485_m1), pgc1a (mm01208835_m1), cox1 (mm04225243_g1), cox4 (mm01250094_m1), col1a1 (mm00801666_g1), col1a2 (mm00483888_m1), col3a1 (mm01254476_m1), and col4a1 (mm01210125_m1). Results were analyzed using the 2-ddCt method with GAPDH (mm99999915_g1) as reference gene (5).
Tissue protein lysates and Western blots
After either a 5h fast or an insulin clamp, mice were anesthetized and tissues flash-frozen. Gastrocnemius lysates were obtained by homogenization as previously described (6) and run on SDS-PAGE gels. All antibodies were from Cell Signaling except where otherwise indicated. Immunoblots were incubated with primary antibodies against total OXPHOS (abcam), VDAC (abcam), phospho-Akt (Thr308), Akt (Ser473), Akt, IRS1 (Ser302), IRS1, AS160 (Ser588), AS160, phospho-mTOR (Ser2448), phospho-mTOR, P-p70S6K (Thr389), p70S6K, P-S6 (Ser235/236), S6, P-TSC2 (Thr1462 and Ser1387), TSC2, P-Raptor (Ser792) (ThermoFisher), Raptor, AMPKα, AMP Deaminase 1 (AMPD) and hexokinase II (HKII). Equal loading was assessed by blotting for GAPDH (abcam). Secondary antibodies were incubated for 1h; visualization and quantification were