Perception-Aware Computational Fabrication
Increasing The Apparent Gamut of Digital Fabrication
Doctoral Dissertation submitted to the
Faculty of Informatics of the Università della Svizzera Italiana in partial fulfillment of the requirements for the degree of
Doctor of Philosophy
presented by
Michal Piovarči
under the supervision of
Piotr Didyk
Dissertation Committee
Piotr Didyk Università della Svizzera Italiana, Switzerland
Kai Hormann Università della Svizzera Italiana, Switzerland
Evanthia Papadopoulou Università della Svizzera Italiana, Switzerland David I.W. Levin University of Toronto, Canada
Bernd Bickel Institute of Science and Technology, Austria
Fabio Pellacini Sapienza University of Rome, Italy
Dissertation accepted on 1 July 2020
Research Advisor PhD Program Director
Piotr Didyk Prof. Walter Binder / Prof. Silvia Santini
ted previously, in whole or in part, to qualify for any other academic award; and the content of the thesis is the result of work which has been carried out since the official commencement date of the approved research program.
Michal Piovarˇci Lugano, 1 July 2020
To my beloved
Abstract
Haptic and visual feedback are important for assessing objects’ quality and af-fordance. One of the benefits of additive manufacturing is that it enables the creation of objects with personalized tactile and visual properties. This person-alization is realized by the ability to deposit functionally graded materials at microscopic resolution. However, faithfully reproducing real-world objects on a 3D printer is a challenging endeavor. A large number of available materials and freedom in material deposition make exploring the space of printable objects difficult. Furthermore, current 3D printers can perfectly capture only a small amount of objects from the real world which makes high-quality reproductions challenging. Interestingly, similar to the manufacturing hardware, our senses of touch and sight have inborn limitations given by biological constraints.
In this work, we propose that it is possible to leverage the limitations of hu-man perception to increase the apparent gamut of a 3D printer by combining numerical optimization with perceptual insights. Instead of optimizing for exact replicas, we search for perceptually equivalent solutions. This not only simplifies the optimization but also achieves prints that better resemble the target behav-ior. To guide us towards the desired behavior, we design perceptual error metrics. Recovering such a metric requires conducting costly experiments. We tackle this problem by proposing a likelihood-based optimization that automatically recov-ers a metric that relates perception with physical properties. To minimize fabrica-tion during the optimizafabrica-tion we map new designs into percepfabrica-tion via numerical models. As with many complex design tasks modeling the governing physics is either computationally expensive or we lack predictive models. We address this issue by applying perception-aware coarsening that focuses the computation to-wards perceptually relevant phenomena. Additionally, we propose a data-driven fabrication-in-the-loop model that implicitly handles the fabrication constraints. We demonstrate the capabilities of our approach in the contexts of haptic and ap-pearance reproduction. We show its applications to designing objects with pre-scribed compliance, and mimicking the haptics of drawing tools. Furthermore, we propose a system for manufacturing objects with spatially-varying gloss.
Acknowledgements
First of all, I would like to thank my advisor Piotr Didyk for taking me on the awesome journey called doctoral studies. I learned from you how to approach re-search from identifying interesting rere-search questions, through rigorously re- search-ing for possible solutions, to the writsearch-ing of well motivated, easy to understand scientific papers, and presenting the results to a wider audience in an engaging yet informative way. A unique part of your supervision was the encouraging per-sonal touch that put me into the correct mindset for wanting to push each project to a successful finish. Finally, your eye for details showed me that going the extra mile pays off in not only having results but having results one can be proud of. Thanks for shaping me into the researcher that I am today.
I would also like to thanks David I. W. Levin and Danny M. Kaufman for our discussions on numerical simulation and fabrication. Your ability to explain difficult concepts on an intuitive level is indispensable. Thanks to you I saw the beauty in mathematical formulations that capture the intricate details of our world in equations.
Finally, I would also like to thank my parents Oco and Mama for their un-bounded love and care that accompanied me even thousands of kilometers away from home. A special thanks goes also to my brother Ivo who was there for me at all times (and oddly late hours) whether it would be random chatting, med-ical advice, or our weekend gaming sessions. Thanks to you and my parents I always felt there is a place I can call my home. Last but not least I would like to thank the person closest to my hearth, Veronka. You helped me to not get stuck in local minima of thinking and to look at the world through a new perspective. Even during the hardest parts of my life you stayed by my side and always re-mained positive and encouraging. The moments we shared together made all the problems in the world disappeared and all that remained was us and our love.
Contents
Contents ix
List of Figures xv
List of Tables xxix
1 Introduction 1 1.1 Contributions . . . 4 1.1.1 List of Publications . . . 5 1.1.2 Overview . . . 6 2 Perceptual Background 9 2.1 Investigating Perception . . . 9 2.2 Haptic Perception . . . 15
2.2.1 Surface Exploration Via Direct Touch . . . 16
2.2.2 Surface Exploration Via A Probe . . . 18
2.2.3 Compliance Perception . . . 20 2.3 Visual Perception . . . 23 2.3.1 Visual Acuity . . . 23 2.3.2 Color Perception . . . 24 2.3.3 Gloss Perception . . . 25 3 Related Work 29 3.1 Haptic Reproduction . . . 29
3.1.1 Commercial Haptic Styli . . . 31
3.1.2 Research Prototypes of Haptic Styli . . . 32
3.2 Computational Fabrication . . . 33
3.2.1 Numerical Simulation of Haptic Feedback . . . 34
3.2.2 Optimization Algorithm . . . 36
3.2.3 Parametrization . . . 37 ix
3.3 Perception in Computer Graphics . . . 38
3.4 Appearance Fabrication . . . 39
3.4.1 Color Reproduction . . . 40
3.4.2 Translucency Reproduction . . . 40
3.4.3 Reflectance Fabrication . . . 41
4 Perception-Aware Computational Fabrication for Haptics 45 5 An Interaction-Aware, Perceptual Model for Non-Linear Elastic Ob-jects 49 5.1 Overview . . . 51
5.2 Perceptual Space of Stiffness . . . 51
5.2.1 Stimuli . . . 52
5.2.2 Methodology . . . 53
5.2.3 Data Reliability . . . 54
5.2.4 Non-metric MDS . . . 54
5.2.5 Analysis . . . 54
5.3 Computational Model for Stiffness . . . 56
5.3.1 Force Distribution . . . 57
5.3.2 Models . . . 59
5.3.3 Analysis . . . 61
5.4 Complex Geometries . . . 63
5.4.1 Computational Model for Complex Geometries . . . 64
5.4.2 Evaluation . . . 67
5.5 Application to 3D Printing . . . 70
5.5.1 Accuracy . . . 70
5.5.2 Material Selection for Prototyping . . . 72
5.5.3 Improving Fabrication Algorithms . . . 73
5.6 Limitations and Future Work . . . 74
5.7 Conclusions . . . 76
6 Perception-Aware Modeling and Fabrication of Digital Drawing Tools 77 6.1 Overview . . . 80
6.2 Physical Measurements . . . 81
6.2.1 Measuring setup . . . 81
6.2.2 Defining measurement parameters . . . 82
6.2.3 Measurements . . . 82
6.3 Perceptual Space Optimization . . . 85
xi Contents
6.3.2 Experiment Design . . . 88
6.3.3 Experiment . . . 88
6.3.4 Perceptual Space of Drawing Tools . . . 90
6.3.5 Accuracy . . . 91
6.4 Physical Simulation . . . 93
6.4.1 Perception-Aware Coarsening for Exponential Euler Inte-grator . . . 93
6.4.2 Recovering the Forcing Signal . . . 101
6.4.3 Results . . . 103
6.5 Application For Drawing Tool Design . . . 104
6.5.1 Perceptual Space Exploration . . . 104
6.5.2 Optimizing Digital Styluses . . . 107
6.6 Limitations and Future Work . . . 109
6.7 Conclusion . . . 110
7 Fabrication-in-the-Loop Co-Optimization of Surfaces and Styli for Draw-ing Haptics 111 7.1 Overview . . . 114
7.2 Problem Modeling . . . 114
7.2.1 Stylus Parametrization . . . 114
7.2.2 Surface Parametrization . . . 115
7.3 Efficient Fabrication-In-The-Loop Optimization . . . 116
7.3.1 Haptic Feedback Similarity . . . 117
7.3.2 Gaussian Process Surrogate Model . . . 118
7.3.3 Acquisition Function . . . 122
7.4 Application To Stylus-Surface Design . . . 125
7.4.1 Reliability Test . . . 125
7.4.2 Optimizing Haptic Feedback . . . 126
7.4.3 Gamut of Haptic Feedback . . . 129
7.4.4 Universal Drawing Surface . . . 130
7.5 Comparison and Evaluation . . . 132
7.5.1 Comparison With Geometry-Inspired Baseline . . . 133
7.5.2 Measurements of Tool-Surface Combinations . . . 133
7.5.3 Optical Properties of Generated Patterns . . . 134
7.6 Experimental Validation . . . 135
7.6.1 Study 1: Acquiring Vocabulary . . . 135
7.6.2 Study 2: Distinguishing Drawing Tools . . . 136
7.6.3 Study 3: Comparison with State of the Art . . . 137
7.6.5 Summary . . . 140
7.7 Survey With Professional Artists . . . 140
7.8 Limitations And Future Work . . . 142
7.9 Conclusion . . . 144
8 Towards Spatially Varying Gloss Reproduction for 3D Printing 145 8.1 Overview . . . 147
8.2 Hardware Apparatus . . . 148
8.3 Varnish Jetting . . . 149
8.3.1 Effects of Printing Parameters on Droplet Shape . . . 149
8.3.2 Effect of Varnish Spacing . . . 151
8.3.3 Optimized Jetable Varnishes . . . 152
8.4 Varnish Selection . . . 153
8.4.1 Measurement Setup . . . 153
8.4.2 BRDF Model Fitting . . . 154
8.4.3 Reflectance Gamut . . . 155
8.5 Gloss Reproduction . . . 157
8.5.1 Simplex-Interpolation for Halftone Reflectance Prediction 157 8.5.2 Predicting Halftone Pattern Quality . . . 159
8.5.3 Prescribed Reflectance Reproduction . . . 160
8.6 Results . . . 162
8.6.1 Flat Samples . . . 162
8.6.2 Height-field Samples . . . 164
8.7 Limitations and Future Work . . . 165
8.8 Conclusion . . . 168
9 Conclusions And Future Work 171 Bibliography 175 A Compliance Measurements 199 B Drawing Tools Measurements 203 C Stylus Simulation Validation 209 D Survey With Professional Artists 213 D.1 Artist 1 . . . 213
D.2 Artist 2 . . . 217
xiii Contents
D.4 Artist 4 . . . 224 D.5 Artist 5 . . . 228
Figures
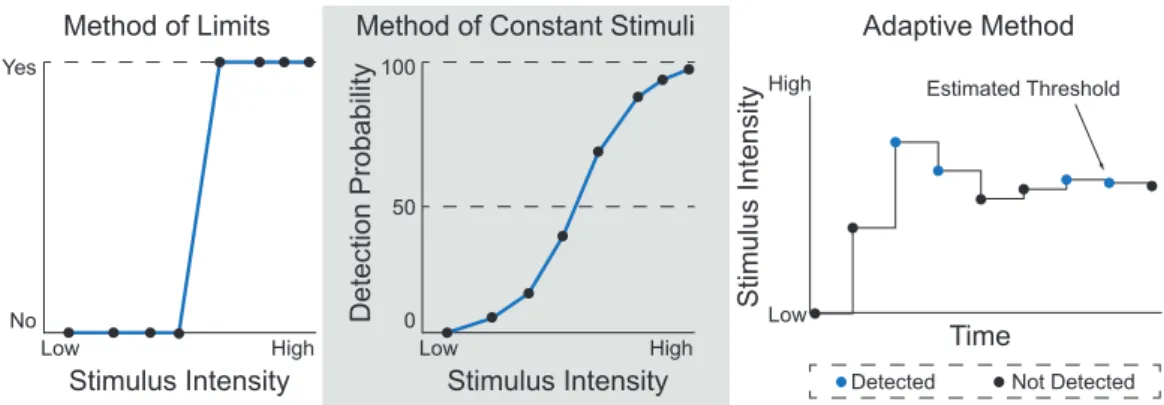
1.1 Stages of computational fabrication. The input geometry is sub-divided and materials are assigned. Using numerical simulation, we estimate the physical properties of the assignment. Finally, we compare the current state with target properties and use the error estimate to drive the optimization. . . 2 2.1 Three designs of detection threshold experiments from left to right:
Method of Limits, Method of Constant Stimuli, and Adaptive Method. . . . 10 2.2 The plot shows the Just Noticeable Difference as a function of
stimulus intensity. These two quantities are correlated through the Weber fraction. . . 11 2.3 Example of investigating the magnitude difference of appearance.
The pairwise experiment presents participants with two samples and a slider to quantify the perceived difference. In contrast, the triplet experiments shows participants a reference and two possi-ble reproductions from which they have to pick one. . . 12 2.4 Perceptual space of gloss recovered by [Wills et al., 2009]. Since
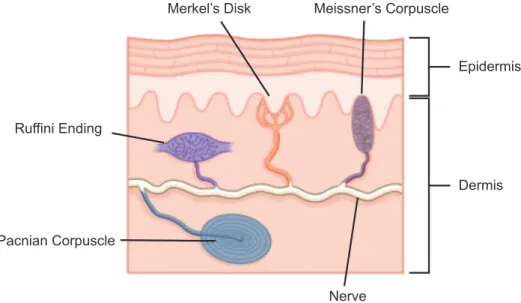
the axes of the space are apriory unknown additional experimental effort is required to identify them. . . 14 2.5 Diagram of human skin structure showing the mechanoreceptors
responsible for tactile perception. Image taken from [Boundless, 2013]. . . 15 2.6 Stimuli used during the psychophysical experiments. From left to
right a pin array display [Wang and Hayward, 2008], sinusoidal gratings [Skedung et al., 2013], vibratory shaker [Israr, Tan and Reed, 2006]. . . 17 2.7 Perceptual space of tactile feedback recovered by Hollins et al.
[2000]. . . 18 xv
2.8 Israr, Choi and Tan [2006] used a shaker with attached stylus to investigate the sensitivity to vibration in a pen-holding posture. . 19 2.9 Perceptual space of haptic feedback induced by a probe recovered
by Yoshioka et al. [2007]. . . 20 2.10 Stimuli used for investigating compliance ranged from real
ma-terials [Tiest and Kappers, 2009], through robotic arms to visual stimuli [Kuschel et al., 2010]. . . 21 2.11 Different interaction modes used to investigate compliance
per-ception: tapping with a finger (A), tapping with a stylus (B), ap-plying force through a lever (C), and passive pressing of a finger (D), Friedman et al. [2008]. . . 22 2.12 The experimental setup of Leškowský et al. [2006] used both real
and virtual samples resulting in a two-dimensional perceptual space. . . . 22 2.13 Diagram of human eye structure showing the components involved
in visual perception. Image taken from [Didyk, 2012]. . . 23 2.14 Optical image of the foveal cone mosaic [Curcio et al., 1990].
The distance between two cones defines the maximal distinguish-able frequency of visual stimuli or the so-called contrast-sensitivity function (right). . . 24 2.15 The response of human photoreceptors to different wavelengths
(left) and the CIEL*a*b* perceptually uniform color space where ellipsis mark perceptually equivalent colors [Pantone, 2018] (right).
. . . 25 2.16 Renders of materials from the Merl database [Matusik et al., 2003]
manifesting various perceived gloss differences. . . 26 2.17 Various geometrical shapes used to investigate the perception of
gloss [Fleming et al., 2004; Fores et al., 2012; Havran et al., 2016]. 27 3.1 Haptic reproduction can help during education, tele-operation of
robots [Peshkin et al., 2001], or training for laparoscopic surgery [Romanelli and Earle, 2009]. . . 30 3.2 Exemplars of haptic feedback devices ranging from haptic
phan-toms [3D Systems, 2020], through wearable displays [Perez et al., 2017], to static displays based on electrovibration [Bau et al., 2010]. . . 31
xvii Figures
3.3 Commercial approaches to vary the haptic feedback range from altering the stylus nib [Wacom, 2020], through use of rough foils [Paperlike, 2020], to digitizing the strokes of traditional drawing instruments [Repaper, 2020]. . . 32 3.4 Research prototypes rely on active modulation trough vibrations
induced by voice coils [Romano and Kuchenbecker, 2012], lin-ear resonant actuators [Cho et al., 2016], or solenoids [Lee et al., 2004]. . . 32 3.5 Fabricated metamaterials can be used to modify the compliance
[Schumacher et al., 2015], texture, or weight of an object [Torres et al., 2015]. . . 33 3.6 Numerical simulation of haptic feedback ranges from relatively
simple contact of rigid bodies [Otaduy et al., 2004] to simulat-ing the frictional interaction between a deformable fsimulat-inger and a surface [Tada and Pai, 2008]. . . 34 3.7 Robust handling of frictional contact allows us to predict the
be-havior of an elastic object during interaction [Chen et al., 2017]. Such predictions can be later used to optimize the flight path of the object. . . 35 3.8 Black-box function optimization using the CMA-ES method from
[Fujii et al., 2018]. The algorithm starts by randomly sampling from a uniform distribution. The samples are then filtered based on fitness value. From the filtered samples a new covariance ma-trix and sample distribution is generated which is then used to sample the next generation. . . 36 3.9 Selecting an appropriate parametrization can significantly
facil-itate the optimization problem [Chen et al., 2013]. Modelling the object as smooth bezier curves is advantageous for caustic op-timization, whereas for texture design it is more appropriate to model individual voxel elements. . . 37 3.10 Experimental designs investigating the perception of gloss [Wills
et al., 2009] (left) and translucency [Gkioulekas et al., 2013] (right). . . . 38 3.11 Applications of perception in creating more intuitive user
inter-faces for material [Serrano et al., 2016] and cloth simulation edit-ing [Sigal et al., 2015]. . . 39
3.12 Differen strategies for color optimization for inkjet printers. From left to right: halftone dithering [Brunton et al., 2015], color con-toning [Babaei et al., 2017], optimization using rendering predic-tions [Elek et al., 2017; Sumin et al., 2019]. . . 40
3.13 Reproducing target translucent properties with an inkjet printer [Hašan et al., 2010; Urban et al., 2019] and by optimizing colored silicone mixtures [Papas et al., 2013]. . . 41
3.14 Different approaches to reflectance manufacturing. From left to right: reflectance reproduction via ink deposition [Matusik et al., 2009], microfacet optimization of target gloss [Rouiller et al., 2013], and bi-scale approach combining ink and geometry modification for appearance reproduction [Lan et al., 2013]. . . 43
5.1 3D printing allows us to print objects with varying deformation properties. The question that we want to answer is: Given a set of printing materials and a 3D object with desired elasticity prop-erties, which material should be used to print the object? For ex-ample, given sample ducks (left) with desired elasticity properties (e.g., measured), our system considers several candidate materi-als that can be used for replicating the ducks (right), and chooses materials that will best match compliance properties when exam-ined by an observer (red and green outlines). Moreover, we can sort all possible materials by their perceived compliance as pre-dicted by our model. The measured compliance is indicated with colors ranging from stiff (blue) to soft (red). . . 49
5.2 The 12 stimuli that were used in our experiments. The plot on the right shows corresponding force-displacement curves obtained via uniaxial test. The lines above blocks indicate the corresponding line styles. For a reference, we also include the force-displacement curve for a solid block (black line). The gray area roughly marks maximum applied force to each sample. . . 52
xix Figures
5.3 Left: Design of our samples. Equally spaced out cylindrical holes are defined using two radii. Right: Parameter of our samples. The two axes correspond to two radii of the cylinders (in mm). 12 green dots correspond to the samples used for our experiment. The red lines indicate the lower limits for the values of the radii, due to the printer resolution, and the upper limit for radii to guar-antee that the cylinders do not intersect. Block 4 was introduced as a counterpart of block 8 to verify whether compliance proper-ties are symmetric with respect to the choice of radii. . . 53 5.4 In a single trial participants were presented with three different
samples. Their task was to compare softness difference between the leftmost and the rightmost pair. Additionally, we placed a force sensor beneath the middle block in order to collect force data throughout the entire experiment. . . 54 5.5 Left: Testing and training error for non-linear MDS as a function of
parameter. Right: Variance across each embedding dimension (spread) for = 5. . . 55 5.6 Perceptual space for our 12 metamaterials found using non-metric
multi-dimensional scaling. The error bars visualize the confidence obtained using the bootstrapping test. The intervals marked on the axis correspond to 1 JND. . . 56 5.7 The plots visualize the data collected in our force experiment for
blocks 3 and 8. Plots on the left visualize the raw data captured from using our setup: the x-axis corresponds to samples (time), and the y-axis corresponds to the force applied by subjects. The red circles show the peak forces which are used to compute peak-force histograms on the right. As the deformation properties of blocks 3 and 8 differ significantly, the forces applied by users are also different. . . 58 5.8 The plots show how different computational models correlate with
the perceptual space obtained using non-metric multi-dimensional scaling. Each chart’s X and Y axis correspond to computational model and perceptual space, respectively. Blue points correspond to our stimuli. The red lines are the results of the linear regres-sion and the green dashed lines indicate prediction intervals with a confidence level of 0.95. A good correlation between computa-tional models and experimental data was found for several mod-els. . . 62
5.9 The two plots visualize the distance prediction between our stim-uli as predicted by the LogLS model and the L2 norm with respect to the observed distances in the perceptual space. LogLS outper-forms the L2 norm by providing a much closer match to the ob-served distances. . . 63 5.10 The three models used for the simulation and their corresponding
tetrahedral mesh. . . 65 5.11 To compute compliance properties of an object we start with
sim-ulating the interaction performed by an observer for a given loca-tion on the surface (a). This allows us to extract force-displacement information. Next, the force histogram is obtained using our database of blocks with ground-truth force information (b). To this end, we interpolate histograms corresponding to the two closest curves in the database. Given the force-displacement curve together with the corresponding force histogram, compliance properties are com-puted according to our model (c). The procedure is repeated for a set of locations on the surface (d). To obtain a dense, spatially-varying compliance map, we interpolate the compliance values on the object’s surface (e). . . 66 5.12 To compute difference between two versions of the same object
made of two different materials, we first compute a compliance map for each of them. Then, we subtract the values correspond-ing to the same locations. Here, Material A and Material B cor-respond to silicones with Young’s modulus values of 0.0964 MPa and 0.0973 MPa, respectively. . . 67 5.13 The results of the evaluation of our compliance model. The plots
visualize the compliance as judged by the participants (top row), as well as our prediction (bottom row). Additionally, the schematic figures visualize the mode of interaction. Letters A-I correspond to different silicon mixtures ordered by Shore hardness. For full simulations of the used materials please refer to Appendix A. . . . 69 5.14 From left to right: a rendering of the original seahorse model.
Seahorse models used for the study: Dragon Skin 30, Ecoflex 00-30, TangoBlack+, Flexible resin, TPU 92A-1. . . 70 5.15 Left: a rendering of the original octopus model. Right: all printed
octopuses ordered by stiffness. . . 72 5.16 Left: force-displacement curves obtained from Spec2Fab
optimiza-tion. Right: Slopes of the force-displacement curves along with corresponding histogram of forces. . . 75
xxi Figures
6.1 We propose a system for fabricating digital drawing tools that mimic the feel of real tools. To this end, we measure properties of different real drawing tools, study their perception, and design a perception-aware space of drawing tools. We later develop a sim-ulation technique which allows us to embed new designs into the space, evaluate the pairwise similarity between them and the tools we want to replicate. This drives the design process of different digital tools. . . 77 6.2 Measurements and perceptual user study setup. Turntable on which
a mechanical arm is used to capture friction and vibration of draw-ing tools. There is a holder for a human arm (durdraw-ing user studies) to provide consistent grip and orientation. In the middle, we can see normalized friction measurements recovered using our setup. On the right is the accelerometer response for a fixed velocity. . . 81 6.3 Sample images drawn during our preliminary user study. . . 82 6.4 Our user study considers 5 drawing tools: 2H and 8B pencils,
fine-liner, ballpoint pen, and charcoal and 3 drawing substrates: 80-gram office paper, rough artist paper, and stone paper. . . 83 6.5 Velocity and pressure histograms recorded from free drawings
dur-ing our pilot study. . . 84 6.6 Acceleration measurement setup. The arm holds a drawing
instru-ment, and the drawing substrate is attached via a magnetic plate. The vibrational response of the drawing tool is captured using an accelerometer. . . 85 6.7 Friction measurement setup. The arm is enhanced with a lever
that amplifies the frictional force excreted on the force sensor. . . 86 6.8 Measurements of a ballpoint pen on oiled acrylic (left), and
80-gram office paper (right). . . 87 6.9 Turntable setup for user studies. Participants’ hands rest in a holder
and an arm-wrap is used to limit wrist motion. . . 89 6.10 The plot shows the match of our optimized perceptual spaces to
the experimental data. Different colors correspond to spaces of different dimensionality, while points with the same color corre-spond to different values of . . . 91 6.11 The perceptual space obtained using our data and optimization.
The axis are correlated with vibration and friction measurements. Confidence intervals obtained by bootstrapping visualize 95% and 68% regions. . . 92
6.12 Synthetic results of optimizing perceptual spaces using our exper-iment design as a function of space dimensionality. The bars show mean error and standard deviation. . . 93 6.13 Human sensitivity to vibration as a function of frequency. We are
most sensitive at around 240 Hz and regarded as insensitive bel-low 50 and above 500 Hz. . . 95 6.14 Oscilating 3D printed bar captured with accelerometer (blue) and
physical simulation of the bar (red). . . 101 6.15 Fit of testing dataset at a fixed velocity. We compare physical
mea-surements (blue) to our data-driven simulation (red). We can see a good match of estimated vibration for the testing dataset. . . . 102 6.16 Material (left) and tip (right) scaling factor. Both factors were
optimized jointly. . . 103 6.17 An interpolated design was measured (blue line) and simulated
using our pipeline (red line). We also compare to results of our simulation if we would not interpolate tip and material scaling parameters (gray lines). . . 104 6.18 Perceptual space grouped by means of fabrication: real tools (red),
3D printed tools on paper (green), and artificial substrates (blue), and commercial styli (yellow). . . 105 6.19 The results of the free drawing user study. For each out 24 triplets,
we plot preference obtained in our validation experiment next to the prediction coming from the perceptual space. The red back-ground indicates the failure cases where the majority vote did not agree with our prediction. . . 107 6.20 Details of our perceptual space for optimization of digital styli.
We show two cases: interpolation of 3D-printed styli on a plastic screen protector (left), and interpolation of 3D-printed styli on the glass surface in comparison to the Apple Pencil (right). Number indicate subject preference when compared to real pencil. . . 108 7.1 We propose a data-driven method for mimicking haptic feedback
of drawing tools. Our method uses fabrication-in-the-loop de-sign enabled by our data-driven surrogate model which automat-ically handles exploration-exploitation trade-offs and minimizes the amount of printed samples. The final stylus-surface combina-tions are manufacturable on commonly available hardware and can be directly integrated into current digital drawing solutions. 111 7.2 Frictional contact . . . 112
xxiii Figures
7.3 The modular design used for our styli (left). The replaceable tip can be made of different material m and have a different radius r. A picture of a manufactured stylus (right). . . 115 7.4 Gelsight scans of drawing substrates used in our experiments. . . 116 7.5 Sample surfaces from our parametrization quantized to one layer. 117 7.6 A one-dimensional example of information transfer between
mul-tiple categories. The estimate of category 1 (left) is used to im-prove prediction in uncertain regions of category 2 (middle). With more samples the prediction is weighted towards observations of the new category (right). . . 121 7.7 Visualization of acquisition function. . . 123 7.8 Example of parallel execution of stylus and surface
manufactur-ing. In the first iteration, we manufacture a surface and enhance our data-driven model. The model then predicts which tool we should print to best match the target. We prepare the print for the tool and while the tool is printing we optimize for a new surface. The new surface causes an update to the surrogate model which results in a new suggestion for a stylus to print. Since the printer is currently occupied we compare the tools based on their expected improvement over time. We find that the expected improvement of the new tool outweighs the difference in printing time. There-fore, we stop the current print and prepare the new tool. In order to verify that the model prediction was correct, we manufactured and measured both styli. We can observe that the newly predicted stylus indeed achieved better improvement. . . 127 7.9 Pen and surface designs used to initialize the surrogate model. . 128 7.10 Initial samples measurements are shown on the left. We can
ob-serve that initial sampling can capture a ballpoint pen on office paper. We verify our algorithm by removing the surface from ini-tial sampling and optimize for the same tool, right. . . 128 7.11 Results of optimizing haptic feedback using our surrogate model.
Black samples mark original perceptual space. Blue samples are sample surfaces used to initialize the model. The red color is the position of a tool we would like to reproduce. Dark green dots mark the path our optimizer took in the perceptual space to find the final reproduction (light green). . . 129
7.12 Four traditional drawing tools (top) and their optimized digital counterparts (bottom). We show both the optimized stylus and the Gelsight scan of the optimized surface. Please note that our surfaces do not match the original substrates yet manifest the same haptic response. . . 130 7.13 The gamut of haptic feedback achievable by our different
manu-facturing processes: jet on transparency sheet (blue), laser-jet on transparency sheet with fixative (red), 3D printer (green) compared with traditional drawing tools (black). . . 131 7.14 Four iteration of optimal surface optimization. . . 132 7.15 Results of surface reproduction of a ballpoint pen. The scanned
height-field (left) and measured haptic feedback (right) form paths in perceptual space parametrized by the scaling factor. . . 134 7.16 Vibration measurements of original drawing instruments and their
3D printed counterparts. . . 134 7.17 Visual properties of our surface evaluated by taking photos of an
LCD screen displaying a checkerboard pattern. . . 135 7.18 Bar-plot showing the similarity of our tools when compared to
other digital styli. For each reference, indicated on the top, and an alternative solution, indicated below the bars, the plot shows the percentage of participants finding our replica more similar than the alternative commercial or research solution. . . 138 7.19 Bar-plot showing the similarity of our tools when compared to
traditional drawing tools. For each reference, indicated on the top, and an alternative traditional tool, indicated below the bars, the plot shows the percentage of participants finding our replica more similar than the alternative tool. . . 140 7.20 Two-dimensional perceptual space computed for tools in our
ex-periments. The Euclidean distance between the samples can be in-terpreted as a perceived distance between different drawing tools combinations. . . 141 8.1 The input to our system is a diffuse color and spatially-varying
gloss. We first reproduce the color using commercial ink-jet print-ers (left halves). Next, as a post-processing step we use our cus-tom printer to jet varnishes that match the input reflectance (right halves). . . 145
xxv Figures
8.2 Varnish printing apparatus (left) consists of needle jetting valves (middle). To jet with the valve, the needle rises allow pressurized material to flow. By quickly shutting the valve the material is jetted onto the substrate. . . 149 8.3 Gelsight captures of droplets created by varying the jetting
param-eters: valve stroke, valve open duration, valve close duration, and air pressure. . . 150 8.4 Gelsight (top) and optical (bottom) scans of varnish droplets for a
selection of off-the-shelf varnishes. From left to right, 1:1 ratio of Golden MSA gloss varnish and Golden MSA solvent, 1:1 ratio of Golden MSA satin varnish and Golden MSA solvent, 1:1 ratio of Golden MSA matte varnish and Golden MSA solvent, Schmincke 611 matte varnish, Schmincke 610 gloss varnish, Amsterdam 115 Matte Varnish, 1:1 ratio of Golden matte heavy gel and Golden gloss extender. . . 151 8.5 Effect of varying spacing. In the observed range increasing the
spacing leads to thinning of the film created by the deposited var-nish. . . 152 8.6 Photos of our printed varnishes on a cylindrical setup with a line
light source. . . 153 8.7 Our measurement setup and sample capture of matte and satin
varnish. . . 154 8.8 Fitted raw measurements of our varnishes (top) and
correspond-ing rendercorrespond-ing with the fitted model parameters (bottom). . . 155 8.9 The reflectance gamut achievable by our varnishes (orange). The
gamut contains various hand-made samples for comparison: var-nished paper (blue), varvar-nished plastics (yellow), oil colors (green), and transparencies (purple). The varnishes we selected for print-ing are in bold. . . 156 8.10 Test of linearity of varnish halftoning. We start by generating
halftone patterns and applying them on a substrate. The samples are then measured and compared with linear prediction. . . 157 8.11 A two-dimensional simplex created to predict the reflectance of
gloss halftones. To predict a new sample we locate the enclos-ing simplex and use barycentric coordinates to interpolated our measurements. . . 158 8.12 Cross-validation of our simplex-based reflectance prediction.
Leav-ing out multiple samples, creatLeav-ing a new tesselation, and predict-ing the misspredict-ing samples. . . 159
8.13 Predicting dithering pattern visibility for different varnish mix-tures of matte-glossy-satin. . . 160 8.14 Prescribed roughness for a target reflectance (left) is dithered
us-ing our simplex model with (middle) and without (right) ditherus-ing pattern visibility optimization. . . 161 8.15 A gradation of gloss formed by jetting uniform patches of various
varnish mixtures. The images are captured by placing the samples against a display showing a checkerboard pattern. . . 162 8.16 Spatially-varying gloss is defined with two varnishes: matte (black)
and glossy (white); and dithered using our device. To validate the fabrication we capture the fabricated samples with an area light source and compare with rendered predictions. . . 163 8.17 Albedo, roughness, and metallic textures for our objects with their
corresponding generated halftone patterns. . . 164 8.18 Differently slanted 3D printed surfaces covered with the same
cov-erage of Golden gloss varnish, captured at specular configuration. The angles below the pictures indicate the deviation of the surface from the 3D printer’s tray. The appearance start to show signifi-cant deviations from the flat surface at approximately 20 . . . 166 8.19 Appearance manufacturing with separate fabrication of color
(ink-jet printer) and gloss (our device). The final combined appearance manifests both high-resolution color and spatially-varying gloss. Photos are captured at two exposure values (+0, -1) with a still camera and a moving light source. For a full visualization please see the supplementary video. . . 169 8.20 Manufactured height-fields without varnish (top) and with halftoned
varnish using our system (bottom). Photos are captured with a still camera and moving light source. We plot the luminance of two locations as the light rotates around to showcase the gloss variation achieved by our system. For the full capture please see the supplementary video. . . 170 A.1 Left: peak-force data recovered for each block during
psychophys-ical experiment. Right: histograms stored in our database. . . 200 A.2 Force-displacement data recovered for interaction with all
xxvii Figures
B.1 Vibration spectrograms of real tools recorded using our setup. Each title of the plot consist of name of the tool and the surface. The first column provides measurements of the tools on oiled surface in order to demonstrate the lack of vibrations coming from the measurement setup. . . 204 B.2 Vibration spectrograms of 3D printed tools recorded using our
setup. The titles of the plots consist of the name of the material, size of the tip, and the name of the surface. . . 205 B.3 Vibration spectrograms of 3D printed and commercial tools recorded
using our setup. The titles of the plots consist of the name of the material/tool (for commercial products), size/type of the tip, and the name of the surface. . . 206 B.4 Friction measurement of drawing tools on various kinds of paper
recorded using our setup. . . 207 B.5 Friction measurement of 3D printed and commercial styli recorded
using our setup. . . 208 C.1 Full leave-one-out cross-validation of our data-driven forcing term.
. . . 210 C.2 Interpolated forcing term evaluation. We predicted the vibration
response of an interpolated forcing term using our simulator (red line) and compare it to measurements on our turn-table (blue line). We also compare it to the simulations without interpola-tion of forcing terms (gray lines). . . 211
Tables
5.1 Results of our JND estimation experiment. The first two columns provide block numbers (Figure 5.2) that were compared by the participants. The third column provides a percentage of people that answered that SAMPLE1 was softer than SAMPLE2. The fourth
column provides the corresponding difference in our initial per-ceptual space. . . 57 5.2 Statistics from experiments evaluating each computational model.
High values marked in bold indicate good candidates for compu-tational models. Each of them does a good job of predicting not only the distances evaluated using the perceptual space found us-ing MDS (above 90%), but also the data collected in our main experiment. . . 62 5.3 Correlation between distances in the perceptual space and the
pre-diction provided by the computational models and the L2 norm. . 63 5.4 Silicon mixture with their corresponding IDs. . . 68 5.5 Correlation between distances predicted by our method and the
L2 norm. . . 69 5.6 Results of the perceptual study. From each trial the triplet is shown
as well as the corresponding participants’ picks. Our predictions always correspond to the participants’ choices. Cases when the L2 norm did not agree with our prediction are highlighted in red. . . 71 5.7 Results of the perceptual study. For both trials of picking two and
three samples we present the people’s choice and its correspond-ing probability. Sets predicted by our model and the L2 norm are underlined in green and red, respectively. . . 73
Chapter 1
Introduction
Additive manufacturing is a powerful technology that through spatial deposi-tion of funcdeposi-tionally graded materials enables us to control the haptic and visual impression an object creates. This is of broad importance to everyone, from a shopper buying shoes to a doctor palpating a growth, that uses their sense of touch to learn about the world. The haptic and visual feedback convey differ-ent characteristics of each object that lend themselves to differdiffer-ent applications, e.g., texturing surfaces to mark handles. Thus there is an intimate connection between the way an object feels and how we use it. As a result, reproducing tar-get haptic and visual behavior is critical for both replicating existing, real-world constructs and designing novel ones.
To design an object with customized haptic and visual properties a designer needs to take full advantage of the new capabilities [Schmidt and Ratto, 2013]. However, the extreme amount of degrees of freedom makes an efficient explo-ration of the design space difficult. Therefore, it is necessary to design new al-gorithms that help the designer to fully exploit the potential of additive man-ufacturing. This idea is similar to enhancing camera and display devices with computational techniques to push them to the hardware limits [Lukac, 2010; Masia et al., 2013]. In the context of manufacturing, we collectively call com-putational fabrication the set of techniques that use computation to leverage the full capabilities of manufacturing devices.
Computational fabrication is a goal-driven design process [Chen et al., 2013] (Figure 1.1). The input is a description of the target behavior. The output of the technique is a representation of a printable design for the manufacturing device which will produce an object closely matching the prescribed behavior. This goal is achieved by a parametrize-simulate-evaluate optimization loop. The algorithm is initialized with a parametric design from a sufficiently expressive design space.
Next, numerical simulation is employed to estimate the properties of the digital design. Finally, a difference between desired and simulated behavior is evalu-ated, which causes an update to the parametric model. Such techniques were successfully employed to optimize objects with target reflectance [Matusik et al., 2009], elastic behavior [Schumacher et al., 2015], or sound [Li et al., 2016].
Geometry Physical Properties Input: Goal: Optimization: Material Assignment Error Estimation Simulation Optimized Design
Figure 1.1. Stages of computational fabrication. The input geometry is subdi-vided and materials are assigned. Using numerical simulation, we estimate the physical properties of the assignment. Finally, we compare the current state with target properties and use the error estimate to drive the optimization.
Directly applying computational fabrication for the reproduction of target behavior is a challenging task. The optimization process hinges on efficient es-timation of physical properties via numerical simulation to explore the design space. This, in general, leads to a highly non-convex and derivative-free opti-mization procedure. The problem is further complicated in our setting. The per-ceived haptic and visual sensations depend on the fine-scale interaction between objects surface and our fingers or incoming light rays. As with many complex design tasks, the governing physics are not currently predictively modeled to the complexity of the physical phenomenons which govern the haptic feedback, the scale at which they occur, and the limitations of the fabrication processes [Myshkin et al., 1998; Cirac and Zoller, 2012]. Moreover, the hardware limits constraint the space of objects that can be reproduced on a particular printer or the so-called gamut of the device. The gamut is limited by the selection of available materials, the need for supporting structures to print overhangs, or the resolution at which the print can be realized. While computational techniques can bring us closer to the edge of what is possible, they fundamentally cannot overcome the hardware limitations and are always bound to operate within the gamut of a particular device. To address these problems, we make an interesting
3
observation that similarly to hardware limitations, human sensorial system has its own set of imperfections, e.g., our fingers processes applied stimuli in a non-linear fashion [Skedung et al., 2011], we are sensitive to vibration in a relatively narrow range [Israr, Choi and Tan, 2006], our eyes have limited visual accuity [Ferwerda et al., 1996; Larson et al., 1997; Mannos and Sakrison, 1974], etc. [Nisky et al., 2011; Skedung et al., 2013; Goodman and Bensmaia, 2017].
In this thesis, we propose that it is possible to exploit the limitations of the human sensorial system to enhance the fabrication process. By combining com-putation with numerical models of perception, we mask the comcom-putational and hardware limits of fabrication, effectively increasing the apparent gamut of a 3D printer. Instead of optimizing for exact replicas, we search for perceptually equivalent solutions that are manufacturable on current hardware. To achieve this goal, we enhance the standard parametrize-simulate-evaluate optimization loop by replacing the evaluation step with a perceptual error metric. To recover this metric, we rely on designing psychophysical experiments [Fechner, 1860] that investigate how perceived haptic properties relate to physical attributes of manufactured digital designs. Such experiments require large amounts of ex-emplars and participants, which makes the experiments challenging to use in the context of fabrication where stimuli cannot be digitally distributed. We ad-dress this issue by proposing new experimental designs that minimize the number of participants. We support the experiments with numerical optimization that automatically generates a computational error metric that relates to perceived quantities to physical properties. To evaluate the error metric during optimiza-tion, we need to estimate the physical attributes of newly generated designs. Since such a simulation is often computationally intractable, we propose two alternatives. The first option is to combine numerical simulation with percep-tual insights to perform perception-aware coarsening that focuses the computa-tional effort on relevant phenomena. The second options is a purely data-driven fabrication-in-the-loop model that implicitly handles the fabrication constraints and the exploration-exploitation trade-off. These two approaches enable effi-cient numerical estimation of physical properties that are otherwise challenging to simulate, and often open research problems. We demonstrate the application of the proposed methodology to two problems: the design of objects with pre-scribed compliance and replicating the haptic feedback of traditional drawing instruments. In the last part of the dissertation, we extend our investigation be-yond haptics – more specifically to appearance reproduction. We propose a full system for modifying objects’ surface gloss by spatial halftoning of varnishes. The core of our approach is a predictive model that can estimate both the appearance and the perceived quality of varnish halftone patterns.
1.1 Contributions
The main contribution of this dissertation is a new methodology that combines perception with computational fabrication to design objects with prescribed hap-tic feedback. We validate this concept in three different scenarios and present directions for future work.
We demonstrate our methodology in the case of manufacturing objects with prescribed elastic behavior [Piovarˇci et al., 2016]. We propose to evaluate the similarity of elastic objects by building a perceptual space of compliance. We show that the perception depends on the desired behavior, objects geometry, and most critically on the interaction with the sample. To capture all of these effects, we combine numerical simulation that handles the shape and material properties with a data-driven predictor of interaction based on the local com-pliance. We demonstrate that the proposed model can predict the similarity of objects, provide material replacements that reduce manufacturing cost, and gen-erate higher-quality reproductions than state-of-the-art methods.
In the second scenario, we focus on manufacturing drawing tools with pre-scribed haptic feedback [Piovarˇci et al., 2018]. To model the human perception of drawing tools, we propose a custom likelihood-based optimization of percep-tual error metrics. We show that by jointly optimizing for a metric and its gov-erning physical attributes, we maximize the probability of explaining the haptic perception. The recovered error metric relies on efficient estimates of physical attributes. We can not employ off-the-shelf methods since due to the scale of the interaction and printing artifacts an accurate numerical simulation of the gov-erning physical phenomena is intractable. To this end, we propose to accelerate the simulation using perception-aware numerical coarsening. The key observa-tion is that we need to simulate the haptic interacobserva-tion only up to the resoluobserva-tion appreciable by the humans. We demonstrate this by designing an Exponential Euler simulator that computes the elastodynamic equations only in the range perceptible to a human holding a drawing tool. We combine the simulator with a data-driven forcing term to model different paper substrates and show an ex-cellent match to measured data. Finally, we demonstrate an application of the simulator and error metric in the design of digital styli that are more similar to traditional drawing tools than commercial alternatives.
In a followup work, we push the haptic reproduction of drawing tools to the limits by reproducing the haptic feedback of traditional drawing instruments [Piovarˇci, Kaufman, Levin and Didyk, 2020]. Due to the lack of resolution and printing materials, it is not possible to 3D print carbon copies of drawing tools. Instead, we cast the optimization into a perceptual space where we search for a
5 1.1 Contributions
stylus-surface combination that is printable and mimics the target haptic feed-back. We show that efficiently estimating the interaction is critical for high-quality haptic reproduction. To tackle such a challenging problem, we propose to use fabrication-in-the-loop optimization. The key ingredient of our method is the ability to predict the physical attributes with confidence bounds. This enables us to design an exploration strategy that automatically handles the exploration-exploitation trade-off. At each iteration, it proposes a digital design that maxi-mizes the improvement towards target haptic feedback. We show the benefits of our method by reproducing several traditional drawing instruments. The gen-erated instruments are fully 3D printed yet manifest haptic feedback similar to materials that lie well outside of the printing gamut. The quality of the repro-ductions is demonstrated in a blind user study with casual users and a survey with professional artists.
Finally, we investigate future possibilities in applying perception-aware fabri-cation to appearance reproduction. Appearance reproduction is a growing field and as such there is yet no standardized method to reproduce the full objects’ appearance, i.e., the surface reflectance (gloss), diffuse color, and translucency. To address this issue, we propose a custom printing hardware capable of jetting highly-viscous materials [Piovarˇci, Foshey, Babaei, Rusinkiewicz, Matusik and Didyk, 2020]. We use our novel printer to jet off-the-shelf varnishes that modify only the gloss of an object without modifying its sub-surface reflectance. This allows us to combine our printer with commercial devices and simultaneously reproduce the sub-surface color and surface gloss. We characterize the proposed design by describing a calibration procedure and by identifying the effects of jet-ting parameters on droplet shape. Next, using our optimized parameters and a full reflectance measurement device, we quantify the gamut of gloss achievable by our setup. Based on the recovered gamut we select three varnishes as basis materials for halftoning. To predict the appearance of halftoned varnishes we propose a simple yet effective predictive model based on simplex interpolation that can estimate the appearance of a dithered varnish mixture. Additionally, we enhance the model with a dithering pattern quality predictor inspired by the properties of the human visual system and physical varnish mixing. We validate the model with numerical simulation and by manufacturing several 2D and 3D examples with prescribed spatially-varying gloss.
1.1.1 List of Publications
The main contributions of this dissertation were published in three technical pa-pers at ACM SIGGRAPH conference (and ACM Transaction on Graphics Journal):
• Michal Piovarˇci, David I. W. Levin, Jason Rebello, Desai Chen, Roman ˇDurikoviˇc, Hanspeter Pfister, Wojciech Matusik, Piotr Didyk, An
Interaction-Aware, Perceptual Model For Non-Linear Elastic Objects, ACM
Trans-actions on Graphics 35(4) (Proc. SIGGRAPH 2016, Anaheim, California, USA)
• Michal Piovarˇci, David I. W. Levin, Danny M. Kaufman, Piotr Didyk,
Perception-Aware Modeling and Fabrication of Digital Drawing Tools, ACM
Trans-actions on Graphics 37(4) (Proc. SIGGRAPH 2018, Vancouver, Canada)
• Michal Piovarˇci, Danny M. Kaufman, David I. W. Levin, Piotr Didyk,
Fabrication-in-the-Loop Co-Optimization of Surfaces and Styli for Drawing Hap-tics, ACM Transactions on Graphics 39(4) (Proc. SIGGRAPH 2020,
Wash-ington DC, USA)
• Michal Piovarˇci, Michael Foshey, Vahid Babaei, Szymon Rusinkiewicz, Wo-jciech Matusik, Piotr Didyk, Towards Spatially Varying Gloss
Reproduc-tion for 3D Printing, ACM TransacReproduc-tions on Graphics 39(6) (Proc.
SIG-GRAPH ASIA 2020, Daegu, South Korea), (to appear)
Additionally, not included in this dissertation, I have a separate stream of work on geometry-based reflectance reproduction where as future work we would like to combine this approach with varnish deposition to improve manufacturing of objects with prescribed color and gloss:
• Michal Piovarˇci, Michael Wessely, Michał Jagielski, Marc Alexa, Wojciech Matusik, and Piotr Didyk. Directional Screens. Proceedings of Sympo-sium on Computational Fabrication 2017, Cambridge, MA, USA
• Michal Piovarˇci, Michael Wessely, Michał Jagielski, Marc Alexa, Wojciech Matusik, and Piotr Didyk. Design and Analysis of Directional Front
Pro-jection Screens. Computers & Graphics Journal 2018, Volume 74
1.1.2 Overview
The dissertation is structured as follows. Chapter 2 provides a background on haptic and visual perception where we start by describing the common meth-ods for conducting psychophysical experiments and how they were applied to investigate the limitations of our senses. We continue with an overview of re-lated work (Chapter 3) in graphics for reproducing haptic properties in both virtual worlds and real environments. Furthermore, we discuss related work in
7 1.1 Contributions
appearance reproduction. In Chapter 4, we formalize the goal of perception-aware fabrication and provide an overview of how the rest of the dissertation contributes to achieving this goal. The remaining chapters are organized based on the projects. We start with a case study on compliance (Chapter 5) where we show the basic building blocks of perception-aware fabrication and how we can use the method to improve numerical optimization. In the following chapter (Chapter 6), we revisit the methodology and address the three main challenges by proposing algorithms to conduct more efficient psychophysical experiments, automatically generate computational perceptual models, and accelerate physi-cal simulation via perception-aware coarsening of the numeriphysi-cal model. We show the application of these improvements to the design of digital drawing tools. In the next project (Chapter 7), we extend the previous optimization to design dig-ital drawing tools that mimick the haptic feedback of real instruments. The key ingredient is our fabrication-in-the-loop optimization algorithm that efficiently utilizes a black-box objective function to optimize the digital design. In the last project (Chapter 8), we investigate a potential avenue of future work in applying perception-based techniques to appearance reproduction. We present a complete workflow for editing the gloss of an object with special care to minimize the visi-bility of dithering artifacts inherent to juxtaposed materials. Finally, in Chapter 9, we conclude the dissertation and discuss the potential of future work.
Chapter 2
Perceptual Background
In this chapter, we start by introducing the field of psychophysics and describe a systematic experimental approach to investigating the human sensorial system. Afterward, we focus on the biological and psychological capabilities of the sense of touch and sight that motivate how leveraging perceptual limitations can mask the constraints of digital fabrication.
2.1 Investigating Perception
To manufacture objects with desired haptic or appearance properties we seek to associate their physical attributes with perceived sensations. The quantita-tive study of these effects is called psychophysics and the main investigaquantita-tive tool is a psychophysical experiment [Fechner, 1860]. During psychophysical exper-iments, the stimuli are varied in a controlled and systematic manner and the perceived sensations are observed. More specifically, we want to know if a sub-ject can detect stimuli, describe their magnitude, differentiate between different stimuli, or associate a stimulus with physical properties.
During detection experiments, we are interested in finding the so-called de-tection threshold, i.e., the weakest stimulus that our sense of touch can detect. To recover such a threshold we can employ the Method of Limits [Gescheider, 2013], (Figure 2.1 left). The basic idea is to present the participants with a series of stimuli with progressively increasing or decreasing magnitude and observe at which intensity the detection changes. The main drawback of this method is that it introduces a dependency on the order of presented stimuli that can bias the par-ticipants. An alternative option is to use the Method of Constant Stimuli [Laming and Laming, 1992], (Figure 2.1 middle), where participants are presented with stimuli at random and the stimulus that is detected and not detected roughly
50% of the time is considered to be the detection threshold. This prevents the observer from guessing the next stimuli from previously observed samples at the cost of longer studies and less precise threshold estimation. The detection estimate can be improved by using an Adaptive Method [Treutwein, 1995], (Fig-ure 2.1 right). Here the participants are presented with a detectable stimulus that is progressively reduced in fixed steps until it is not detected. At this point the direction is inverted, step size reduced, and the stimulus is increased in mag-nitude until it is detectable. These steps can then be repeated again to obtain more precise estimates of the detection threshold. From these experiments, we
Stimulus Intensity Detection Probability Low High 0 50 100
Method of Constant Stimuli
Method of Limits Adaptive Method
Stimulus Intensity Detection Low High No Yes Time Stimulus Intensity Low
High
Detected Not Detected Estimated Threshold
Figure 2.1. Three designs of detection threshold experiments from left to right: Method of Limits, Method of Constant Stimuli, and Adaptive Method.
can recover two thresholds. The absolute detection threshold that tells us the low-est magnitude at which a stimulus is perceivable; and the differential detection threshold which describes the magnitude increase necessary to detect a change in a stimulus. The differential threshold often obeys the so-called Weber’s law which states that the perceived change in stimuli is proportional to the initial stimuli and this proportion is the so-called Weber fraction [Fechner, 1860], (Fig-ure 2.2), or formally:
dS = kS, (2.1)
where dS is the Just Noticeable Difference (JND), k is the Weber fraction, and S the stimulus intensity. The JND is particularly important in the context of haptic reproduction as it is an objective estimate of similarity that can be used as the stopping criterion in an optimization. This is crucial since the exact reproduction of haptics is often unachievable on a 3D printer. However, by employing the JND it is possible to define a subspace of acceptable solutions that significantly simplifies the optimization task.
In magnitude estimation experiments the participants are presented with a stimulus and asked about numerical representation of its intensity on an arbitrary
11 2.1 Investigating Perception
Stimulus Intensity
Just Noticeable Dif
ference 0.01 0.1 1 10 100 0.001 0.1 1 10 Absolute Threshold Weber Fraction Observations
Figure 2.2. The plot shows the Just Noticeable Difference as a function of stimulus intensity. These two quantities are correlated through the Weber fraction.
continuous scale [Stevens, 2017], (Figure 2.3 left). Since such experiments are often challenging for the participants [Wills et al., 2009; Piovarˇci et al., 2016] they can be facilitated by presenting pairs of stimuli and asking about their dis-similarity. The experiment can be further simplified by reducing the continuous scale to a so-called Likert scale. The Likert scale is discrete and has between five to eleven magnitudes [Joshi et al., 2015]. The outcome of magnitude estimation studies are distances that describe the relations between the presented stimuli. However, even the simplified versions of the experiments are noisy [Wills et al., 2009; Piovarˇci et al., 2016]. This noise is attributed to the fact that observers do not have a consistent scale on which the samples are judged and judgements evolve during the experiment as new stimuli are presented. An alternative option to sidestep these issues is to study the difference of perceived distances rather than the magnitudes themselves. This leads to a subjectively easier experiment design called the two options forced-choice [Wills et al., 2009], (Figure 2.3 right). The experiments consist of individual trials during which the participants are pre-sented with a reference stimulus and two possible reproductions. Their task is to select which reproduction is more similar to the reference. Since each trial de-pends only on the samples presented and does not require a numerical estimate of the difference the participants are more consistent. The outcome of such an experiment are the differences between distances. By further analyzing either the magnitudes or the differences of perceived distances we can recover seman-tic meaning and associate perception with physical attributes of the presented samples.
To model the semantic meaning and associate perceived stimuli with physical phenomena it is possible to compute a so-called perceptual space. A perceptual
Two Options Forced Choice Pairwise Experiment
Reference
Reproduction A Reproduction B Identical Different
Figure 2.3. Example of investigating the magnitude difference of appearance. The pairwise experiment presents participants with two samples and a slider to quantify the perceived difference. In contrast, the triplet experiments shows participants a reference and two possible reproductions from which they have to pick one.
space is a multidimensional embedding of stimuli in which the perceived dis-similarity corresponds with Euclidean distance. The computational method to recover a perceptual space depends on whether we estimated magnitude or dif-ferences of perceived distances. In the following text we will derive both meth-ods. Throughout the derivation we use the following notation. Lower case letters i, j, k... are used to indicate indices of stimuli. Bold lower case letters x indicate vectors, and upper case letters P,Q, R... are used for matrices. Columns of the ma-trix X denote the embedded coordinates of the samples, and mama-trix K denotes the Gramian K = XTX , which is positive semi-definite (K ⌫ 0).
Transforming the magnitudes of perceived distances into an Euclidean em-bedding can be realized by applying Multi-Dimensional Scaling (MDS) [Mead, 1992]. The input to MDS is a matrix of perceived pairwise distances. The algo-rithm minimizes a loss function usually denoted as stress a name adopted from physics due to individual distances pulling each stimulus in a different direction. The output is a M-dimensional perceptual space. In the special case of a dense distance matrix, the perceptual space can be recovered using Eigen decomposi-tion. Let us set the distance matrix D = [di j] where di j is the distance between
sample i and sample j. To recover the perceptual space we perform the following calculation:
D(2)= [d2
i j], (2.2)
B = 0.5J D(2)J,
B = ⇤E⇤T,
where J = I N111T is the centering matrix, N is the number of samples, 1
is a column vector of ones, ⇤ is the vector of recovered eigenvalues, and E is the matrix of eigenvectors. The use of Eigen decomposition guarantees that the
13 2.1 Investigating Perception
axis of the recovered space are orthogonal. Additionally, the contribution of each axis to the distance can be directly estimated using the magnitude of the Eigenvalue. To compute a perceptual space of dimensionality M we pick the first M largest eigenvalues ⇤M and their corresponding eigenvectors EM. The
resulting perceptual space X is then:
X = EM⇤0.5M (2.3)
To recover a perceptual space from differences of perceived distance we use Non-Metric Multi-Dimensional Scaling (NMDS) [Wills et al., 2009; Silverstein and Farrell, 2001]. Let us represent the outcome of the psychophysical experi-ment as triplets (i, j, k), which indicates that the distance between samples i and k was smaller than between j and k. This is denoted as dik < djk. The goal of NMDS is to find a Euclidean embedding that satisfies as many of the constraints as possible. One can reformulate the NMDS problem using the positive semi-definite Gramian matrix K as follows. We can write:
d2
ik= ||xi xk||22 = Kik 2Kik+ Kkk, (2.4)
where xi and xk is the position of sample i and k in the recovered perceptual space, respectively. As the distances are always non-negative, we can replace the constraints dik < djk with dik2 < d2jk. For such constraints our problem of
finding the embedding is equivalent to finding a matrix K that satisfies all these constraints. The constraint that K is a Gramian matrix is sufficient and necessary for the matrix to be an inner product for some set of coordinates x. Therefore, the solution of such a problem will always lead to a valid embedding:
X = E⇤0.5, (2.5)
for a given Eigen decomposition K = ⇤E⇤T
[Wills et al., 2009].
In the raw form, the above formulation is insufficient. First of all, the con-straints do not uniquely define matrix K, as the concon-straints are invariant to scal-ing and translation. In particular, the optimization can collapse the entire space to one point. Another problem is that we want to minimize the dimensionality of the embedding; therefore, we must modify the cost function. We insert an additional term that minimizes the rank of X . This is equivalent to minimizing the rank of K. However, the rank of a matrix is a non-convex term, which com-plicates the optimization. Lastly, the above formulation seeks a matrix K that satisfies all the constraints. This, apart from the case where all participants are consistent with each other, is impossible.
Wills et al. [2009] accounted for all these problems and proposed the follow-ing optimization problem:
min K,⇠ X (i, j,k) ⇠i jk+ t r(K), (2.6) 8(i, j, k) d2 ik+ 1 d2jk+ ⇠i jk, ⇠i jk 0, X i j Ki j = 0, K º 0
Instead of reducing the rank of the matrix K, the optimization reduces the trace, as it can be used as an approximation of rank. In order to deal with possible con-straint violations, they introduce slack variables ⇠i jk. Furthermore, to prevent collapsing the embedding to one point and to remove translation ambiguity, the distance between points is enforced to be at least one and the center of the em-bedding must be at the origin (second constraint in the third line). In order to solve the above optimization problem, we use the SeDuMi 1.05 Optimization Toolbox [Sturm, 1999].
Figure 2.4. Perceptual space of gloss recovered by [Wills et al., 2009]. Since the axes of the space are apriory unknown additional experimental effort is required to identify them.
The result of either MDS or NMDS analysis is a perceptual space X valid for the stimuli included in the psychophysical experiments, (Figure 2.4). To include
15 2.2 Haptic Perception
a new sample into the space it is necessary to conduct additional experiments with the new samples and compute a new space. However, such approach is im-practical in the context of computational fabrication where we need to quickly evaluate the quality of newly generated designs. To this end, it is possible to de-sign a computational approximation of the perceptual space where the axes of the space are correlated with measurable physical attributes. Unfortunately, this is typically a manual and tedious process that leaves the tradeoff between good cor-relation and explanation of experimental data in the hands of the experimentator. As an alternative in this thesis we propose a likelihood-based optimization that automatically computes a perceptual space correlated with physical attributes (Chapter 6). Our algorithm jointly maximizes the probability of observing the experimental data and correlation with various physical properties.
2.2 Haptic Perception
Ruffini Ending
Pacnian Corpuscle
Merkel’s Disk Meissner’s Corpuscle
Nerve
Epidermis
Dermis
Figure 2.5. Diagram of human skin structure showing the mechanoreceptors responsible for tactile perception. Image taken from [Boundless, 2013].
The sense of touch is vital in interacting with real and virtual environments [Robles-De-La-Torre, 2006]. Using our fingers we can dextrously manipulate objects even without directly looking at them. The object’s shape, weight, ori-entation, and other properties are perceived by the cutaneous deformation that is captured via mechanoreceptors [Johnson, 2001]. We recognize four kinds of
![Figure 2.8. Israr, Choi and Tan [2006] used a shaker with attached stylus to investigate the sensitivity to vibration in a pen-holding posture.](https://thumb-eu.123doks.com/thumbv2/123doknet/14319597.496815/51.892.159.745.247.518/figure-israr-attached-investigate-sensitivity-vibration-holding-posture.webp)
![Figure 2.10. Stimuli used for investigating compliance ranged from real materi- materi-als [Tiest and Kappers, 2009], through robotic arms to visual stimuli [Kuschel et al., 2010].](https://thumb-eu.123doks.com/thumbv2/123doknet/14319597.496815/53.892.158.722.153.313/figure-stimuli-investigating-compliance-kappers-robotic-stimuli-kuschel.webp)
![Figure 2.15. The response of human photoreceptors to different wavelengths (left) and the CIEL*a*b* perceptually uniform color space where ellipsis mark perceptually equivalent colors [Pantone, 2018] (right).](https://thumb-eu.123doks.com/thumbv2/123doknet/14319597.496815/57.892.150.744.510.745/response-photoreceptors-different-wavelengths-perceptually-ellipsis-perceptually-equivalent.webp)
![Figure 3.1. Haptic reproduction can help during education, tele-operation of robots [Peshkin et al., 2001], or training for laparoscopic surgery [Romanelli and Earle, 2009].](https://thumb-eu.123doks.com/thumbv2/123doknet/14319597.496815/62.892.142.746.141.355/figure-reproduction-education-operation-peshkin-training-laparoscopic-romanelli.webp)
![Figure 3.2. Exemplars of haptic feedback devices ranging from haptic phantoms [3D Systems, 2020], through wearable displays [Perez et al., 2017], to static displays based on electrovibration [Bau et al., 2010].](https://thumb-eu.123doks.com/thumbv2/123doknet/14319597.496815/63.892.157.745.151.315/exemplars-feedback-phantoms-systems-wearable-displays-displays-electrovibration.webp)
![Figure 3.7. Robust handling of frictional contact allows us to predict the behav- behav-ior of an elastic object during interaction [Chen et al., 2017]](https://thumb-eu.123doks.com/thumbv2/123doknet/14319597.496815/67.892.152.745.383.611/figure-robust-handling-frictional-contact-predict-elastic-interaction.webp)
