HAL Id: hal-02566929
https://hal.umontpellier.fr/hal-02566929
Submitted on 14 May 2020
HAL is a multi-disciplinary open access archive for the deposit and dissemination of sci-entific research documents, whether they are pub-lished or not. The documents may come from teaching and research institutions in France or abroad, or from public or private research centers.
L’archive ouverte pluridisciplinaire HAL, est destinée au dépôt et à la diffusion de documents scientifiques de niveau recherche, publiés ou non, émanant des établissements d’enseignement et de recherche français ou étrangers, des laboratoires publics ou privés.
Uranium removal from mining water using Cu
substituted hydroxyapatite
Stephanie Szenknect, Adel Mesbah, Michael Descostes, Abdoulaye
Maihatchi-Ahamed, Laura Bonato, Malvina Massonnet, Yannis Ziouane,
Evelyne Vors, Thomas Vercouter, Nicolas Clavier, et al.
To cite this version:
Stephanie Szenknect, Adel Mesbah, Michael Descostes, Abdoulaye Maihatchi-Ahamed, Laura Bonato, et al.. Uranium removal from mining water using Cu substituted hydroxyapatite. Journal of Hazardous Materials, Elsevier, 2020, 392, pp.122501. �10.1016/j.jhazmat.2020.122501�. �hal-02566929�
Uranium removal from mining water using Cu
1substituted hydroxyapatite
2STEPHANIE SZENKNECT*§, ADEL MESBAH§, MICHAEL DESCOSTES, ABDOULAYE 3
MAIHATCHI-AHAMED§, LAURA BONATO§, MALVINA MASSONNET§, YANNIS ZIOUANE§, 4
EVELYNE VORS‡, THOMAS VERCOUTER‡, NICOLAS CLAVIER§, JOSEPH LAUTRU§, 5
NICOLAS DACHEUX§ 6
§ ICSM, CEA, CNRS, ENSCM, Univ. Montpellier, Site de Marcoule, BP 17171, 30207 7
Bagnols/Cèze cedex, France 8
ORANO Mines, R&D Dpt., Tour AREVA, 1, place Jean Millier, 92084 Paris, La Défense,
9
France 10
‡
Den – Service d’Etudes Analytiques et de Réactivité des Surfaces (SEARS), CEA, Université 11
Paris-Saclay, F-91191, Gif sur Yvette, France 12
ABSTRACT
13
In this study, synthetic copper substituted hydroxyapatite (Cu-Hap), CuxCa10-x(PO4)6(OH)2 were 14
prepared by co-precipitation method and were used as reactive materials in batch experiments to 15
immobilize uranyl. The limit of incorporation of Cu into a single-phased Cu-Hap reached xCu 16
1.59. The synthetic Cu-Hap samples obtained with various Cu contents were contacted with 17
synthetic uranyl doped solutions and with real mining waters showing various pH and chemical 18
compositions. A fast and strong decrease of the uranium concentration was observed, followed 19
by the establishment of an equilibrium after 1 to 4 days of contact with the solutions. 20
Examination of the solid phase after uranium uptake was performed using a combination of 21
techniques. Depending on the composition of the solution and the copper content of the Cu-Hap, 22
various mechanisms of uranium removal were observed. Based on the experimental results and 23
geochemical simulations, it appeared that the main interest for using Cu-Hap is to enlarge the 24
domain of water compositions for which the precipitation of meta-torbernite, 25
(H3O)0.4Cu0.8(UO2)2(PO4)2 ·7.6 H2O is the predominant mechanism associated to the uranium 26
removal, especially for pH > 6.7 where carbonate uranium species are predominant. 27
1. INTRODUCTION
29
Uranium ore mining, processing and manufacturing can contribute to groundwater 30
contamination. Uranium is transported in groundwater mainly as dissolved U(VI) species, which 31
can threaten ecosystems in the vicinity of contaminated sites. High costs associated with pump-32
and-treat remediation strategies and toughening of regulatory requirements regarding sewage 33
discharge have prompted research into more effective methods1, 2. In this field, new methods 34
involving hydroxyapatite (Hap) amendments to immobilize U(VI) as a nonlabile uranyl 35
phosphate phase have been extensively studied3-17. The rationale for using these methods is the 36
remarkable stability of uranyl phases of the autunite group (MII(UO2)2(PO4)2 ·xH2O or 37
MI2(UO2)2(PO4)2 ·xH2O) under environmental conditions18. The study of natural deposits in 38
oxidizing bedrock aquifers demonstrated that phases of the autunite group are stable for tens to 39
hundreds thousand years19. Examination of the reported standard solubility products of the 40
phases of the autunite group20-26 shows that meta-torbernite, (H3O)0.4Cu0.8(UO2)2(PO4)2 ·7.6 H2O 41
is the less soluble one (Erreur ! Source du renvoi introuvable. of the supporting information). 42
The ubiquity of meta-torbernite in oxidized secondary U ore deposits, contaminated sediments or 43
mine tailings strengthen this conclusion27. 44
However, the precipitation of U-phosphate phases of the autunite group is not the only 45
mechanism of immobilization observed when using Hap as reactive material to remove uranium 46
from contaminated solutions. Surface complexation, ion exchange5-8, 12 and surface 47
mineralization28 can occur depending on the composition of the solution and the total uranium 48
concentration,. The fluor-apatite structure can also accommodate hexavalent uranium by 49
substitution in the Ca1 site29. The precipitation of chernikovite or meta-autunite is the 50
mechanism responsible for the immobilization of uranyl either by surface precipitation following 51
sorption or by precipitation in the bulk solution. However, the stability of the precipitated phases 52
could be strongly impacted by the formation of uranyl carbonates species predominant in near 53
neutral pH and aerated groundwater, as observed by Simon et al.12. 54
On the other hand, Cu-substituted hydroxyapatite (Cu-Hap) has been successfully prepared 55
for its antimicrobial activity and biocompatibility in bioceramics used as bone implants, or for its 56
catalytic properties in the removal of NOx issued from diesel and lean burn gasoline30-34. Cu-Hap 57
was also prepared to improve the sorption capacity of the hydroxyapatite in groundwaters 58
contaminated with arsenate35. Mainly two ways of synthesis were reported in the literature. The 59
first one consisted in the synthesis of an hydroxyapatite by the classical neutralization method 60
initially developed by Wallayes36 followed by cation exchange step. This protocol led to the 61
preparation of Cu-Hap samples with low Cu incorporation contents. Samples prepared with Cu 62
molar contents higher than xCu = 0.02 were mixtures of phases31, 32. The second way of synthesis 63
was based on the co-precipitation method30, 34. Shanmugam et al.30 and Stanic et al.34 obtained 64
single phase Cu-Hap for xCu < 0.53 and for xCu < 0.04, respectively. 65
In this study, we assessed the feasibility of using synthetic Cu-Hap prepared by co-66
precipitation method to immobilize uranyl as stable meta-torbernite phase. The limit of 67
incorporation of Cu into a single-phased Cu-Hap was determined, then the prepared samples 68
were used as reactive materials in batch experiments. The synthetic Cu-Hap samples obtained 69
with various Cu contents were contacted with synthetic uranyl doped solutions and with real 70
mining waters showing various pH and chemical compositions, thus different uranium speciation 71
in solution. The performance of the Cu-Hap was analyzed and compared to Hap based on the 72
rate and extent of uranium sequestration. The mechanism of immobilization was investigated 73
with respect to various conditions tested through geochemical calculations and solid phase 74
characterizations. 75
2. MATERIALS AND METHODS
76
2.1. Synthesis of Cu substituted Hap
77
Copper substituted hydroxyapatite, CuxCa10-x(PO4)6(OH)2 was precipitated by 78
neutralization of 200 mL of a solution prepared by dissolving Cu(OH)2 in 0.12 M H3PO4 79
(Solution A) Sigma-Aldrich, analytical grade, Carlo Erba, ACS reagent) with 0.4 M Ca(OH)2 80
(solution B) (Sigma Aldrich, ACS reagent). The weighted amount of Cu(OH)2 was adjusted to 81
reach the desired concentration of copper in the solution A: CCu= 0.02×xCu M. A defined volume 82
of solution B was added considering the final stoichiometry of Cu-Hap. Solution A was heated at 83
70°C and solution B was rapidly added under vigorous stirring until a precipitate was formed at 84
pH = 4. Then, solution B was added slowly to avoid pH value of the mixture higher than 8. The 85
mixture was heated during 2 h under stirring, then ripened at ambient temperature during 16 h. 86
The precipitate was then filtered, washed with 1 L of deionized water then with ethanol (96 % 87
vol.) and finally dried at 60 °C in an oven during 24 h. The yield of synthesis was determined 88
from the analysis of Cu, Ca and P elemental concentrations remaining in the initial supernatant 89
and in the washing solutions. This protocol allowed the synthesis of 4 mmol of Cu-Hap. No 90
particular caution was paid to the carbonate content of Ca(OH)2 solution. 91
2.2. Batch experiments
92
Batch experiments were performed at room temperature by contacting various Cu-Hap 93
samples with several solutions contaminated with uranium in a Teflon container (Savillex). 94
Synthetic solutions of 0.02 M NaNO3 (Sigma Aldrich ReagentPlus) and Na2SO4 (Sigma Aldrich, 95
ACS reagent) spiked with 1.0 mM of uranium nitrate homemade solution or real mining waters 96
were used. The pH of the synthetic spiked solution was adjusted using 8 M NaOH solution. The 97
uranium concentration in the synthetic solution prepared was analyzed by Inductively Coupled 98
Plasma – Atomic Emission Spectroscopy (ICP-AES) following the procedure described below. 99
Table 1 summarized the experimental conditions used in the various batch experiments.
100
Table 1. Experimental conditions for the batch experiments. 101 Cu content, xCu Cu-Hap (mg) Solution Volume (mL) CU (initial) (mol/L) pH (initial) 0.44/ 1.15/ 1.59 100 0.02 M Na2SO4 100 (0.91 ± 0.01) ×10-3 7.1 ± 0.1 0.44/ 1.15/ 1.59 100 0.02 M NaNO3 100 (1.02 ± 0.01) ×10 -3 7.2 ± 0.1 0.44/ 1.15/ 1.45/ 1.59 60 V105 200 (0.97 ± 0.04) ×10-6 4.5 ± 0.1 0.44/ 1.15/ 1.45/ 1.59 60 BD200 200 (1.64 ± 0.02) ×10-6 7.1 ± 0.1 102
The containers were placed in an orbital stirrer in order to ensure the homogeneity of the 103
system. Regularly, pH were measured using a Metrohm combination-glass electrode calibrated 104
against pH buffers (Inlab® Solutions, Mettler Toledo, pH =2.00; 4.01, 7.00 and 9.21 at 25°C) 105
and 10 mL of solution were sampled to determine the elemental concentrations in U, Cu, Ca and 106
P. The samples were first centrifuged at 4500 rpm during 10 min, then 9 mL of solution were 107
taken off and acidified to pH 2 with 0.5 mL of 0.2 M HNO3 solution. The samples were 108
analyzed either by ICP-AES (Spectro Arcos EOP device) or by ICP-MS (Thermo Scientific 109
iCAP RQ). The calibration was performed using PlasmaCAL (SCP Science) single element 110
calibration standards (CU, CCa, CCu and CP = 1000 ppm) diluted in HNO3 solution. 111
Concentrations and associated uncertainties were respectively the mean and twice the standard 112
deviation of three replicates. This protocol allowed the detection as low as 50 ppb for Cu and 100 113
ppb for U, Ca and P. ICP-MS was used to measure lower concentrations using EN ISO 7980 and 114
EN ISO 11885 standards for Ca, Cu and P analyses, respectively. NF M 60 805 4 standard was 115
used to determine U elemental concentration. 116
The two mining waters (named V105 and BD200) were sampled at the former uranium mining 117
site of Bellezane (Limousin, France). The composition of the two types of water was determined 118
by ICP-AES calibrated against single element calibration standards (1000 ppm). The total 119
inorganic carbon content was measured using a TOC analyzer (Shimadzu, Japan) after dilution 120
of the mining water with 10 mL of deionized water. Total inorganic carbon concentration was 121
measured using an external calibration curve prepared by dilution of a 500 ppm NaHCO3 122
standard solution with deionized water. The detection limit reached 0.5 ppm of total carbon. The 123
main characteristics of the two mining waters are reported in Table 2. The two samples differed 124
mainly in terms of pH, sulfate, carbonate and elemental concentrations resulting from their 125
different hydrogeological origin. Uranium concentrations CU = (1.60 ± 0.02) ×10-6 and (0.97 ± 126
0.04) ×10-6 mol/L for BD200 and V105, respectively. 127
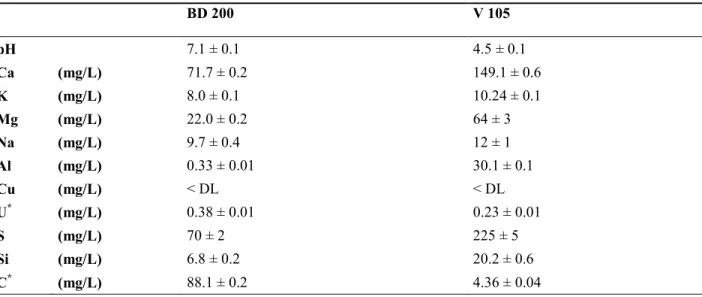
Table 2. pH, concentrations of main ions and inorganic carbon content determined by
ICP-128
AES for the two mining waters collected in the Bellezane site. Simulations of 129
uranium speciation in the two mining waters by Phreeqc Interactive37 using 130
Thermochimie38, 39 and PRODATA40 thermodynamic databases. 131 BD 200 V 105 pH 7.1 ± 0.1 4.5 ± 0.1 Ca (mg/L) 71.7 ± 0.2 149.1 ± 0.6 K (mg/L) 8.0 ± 0.1 10.24 ± 0.1 Mg (mg/L) 22.0 ± 0.2 64 ± 3 Na (mg/L) 9.7 ± 0.4 12 ± 1 Al (mg/L) 0.33 ± 0.01 30.1 ± 0.1 Cu (mg/L) < DL < DL U* (mg/L) 0.38 ± 0.01 0.23 ± 0.01 S (mg/L) 70 ± 2 225 ± 5 Si (mg/L) 6.8 ± 0.2 20.2 ± 0.6 C* (mg/L) 88.1 ± 0.2 4.36 ± 0.04
Main U(VI) species (%): Thermochimie TDB Ca2UO2(CO3)3:67.7 % CaUO2(CO3)32-: 30.5 % UO2(CO3)22-: 1.2 % UO2(SO4): 62.6 % UO22+: 24.1 % UO2SiO(OH)3+: 6.1 % UO2(SO4)22-: 3.8 % UO2(OH)+: 3.4 %
Main U(VI) species (%): PRODATA TDB#
Ca2UO2(CO3)3:67 % CaUO2(CO3)32-: 32 % UO2(SO4): 60 % UO22+: 27 % UO2SiO(OH)3+: 6 % UO2(SO4)22-: 3 % UO2CO3: 2 % UO2OH+: 2 %
*total inorganic carbon concentration analyzed by TOC meter. U analyzed by ICP-MS. 132
#data extracted from Reiller and Descostes40. PRODATA is a new thermodynamic database 133
dedicated to mining and environmental monitoring activities. 134
135
2.3. Characterization of the solid phases
136
The stoichiometry of the prepared Cu-Hap was determined by complete dissolution of 30 137
mg of the solid in 30 mL of 0.2 M HNO3. Four dilutions of the resulting solution with 0.2 M 138
HNO3 were performed then measured by ICP-AES analyses. Cu-Hap samples were characterized 139
before and after being contacted with uranium solutions by Powder X-ray diffraction (PXRD), 140
Raman spectroscopy, Time-Resolved Laser-induced Fluorescence Spectroscopy (TRLFS) and 141
Scanning Electron Microscopy (SEM). PXRD patterns were recorded using a Bruker D8 142
advance diffractometer with copper radiation (Cu K1,2 = 1.54184 Å) in a parallel mode and 143
using the reflection geometry. The patterns were recorded between 5° and 100° (2) with a step 144
of 0.02 ° and a counting time of 3 h. The resulting data were refined using the Fullprof_suite 41 145
by applying the Rietveld method and using the Thomson Cox profile function 42. Pure silicon 146
was used as a standard to determine instrumental parameters. Zero shift, unit cell parameters, 147
overall displacement, preferred orientation and anisotropic size model for the microstructural 148
characteristics were considered for all the refinements. 149
Raman spectra were recorded by the means of a Horiba - Jobin Yvon Aramis apparatus 150
equipped with an edge filter and using a Nd:YAG laser (532 nm). In order to avoid any laser-151
induced degradation of the compound, the power was turned down by the means of optical filters 152
to about 1–4 mW depending on the sample analyzed. The laser beam was then focused on a 153
small fraction of powder deposited on a glass lamella using an Olympus BX 41 microscope. A 154
×100 objective with a numerical aperture of 0.9 was used, resulting in a spot size of about 1 μm2. 155
The scattered Raman light was collected in a 180° backscattering geometry and dispersed by a 156
grating of 1800 grooves/mm after having passed a 150 μm entrance slit, resulting in a spectral 157
resolution lower than 1 cm−1. For each spectrum, a dwell time of 90 to 180 s was considered with 158
an average of 3 scans. Before analysis, the apparatus was calibrated with a silicon wafer, using 159
the first-order Si line at 520.7 cm−1. 160
TRLFS was performed with the experimental setup described in literature43. A Nd:YAG 161
laser (266 nm, pulse duration 5 ns at 10 Hz) was used. In order to avoid laser ablation, the laser 162
beam was driven through an optical system and a 50-µm diaphragm to reduce the beam diameter 163
and the delivered energy. The beam was then focused close to the surface of the sample through 164
a microscope lens (model BX-51). The surface of the sample was positioned near the focal plane 165
of the laser to obtain a probed area of about 1 mm in diameter. TRLFS was performed on powder 166
samples deposited on double-sided tapes. The fluorescence emission was collected by an optical 167
fiber placed at 45° with respect to the axis of the laser and transmitted to a monochromator 168
Andor Shamrock SR-303i (grating of 300 grooves/mm, entrance slit of 150 µm, spectral 169
resolution of about 15 nm). Each sample spectrum resulted from 300 accumulated spectra 170
recorded with a temporal gate of 200 µs delayed by 1 µs after the laser pulse. 171
Scanning electron microscopy (SEM) analyses were conducted using a Quanta 200 ESEM 172
FEG (FEI Company) electron microscope equipped either with a backscattered electron detector 173
(BSED) in high vacuum conditions with a 25 kV accelerating voltage. Powder samples were 174
directly analyzed without any preparation. Qualitative X-ray energy dispersive spectroscopy (X-175
EDS) analyses were performed under the same conditions using the Bruker AXS X-Flash 5010 176
detector coupled to the SEM device. X-EDS maps were obtained using the same detector and 177
operating conditions. For that purpose, an aliquot of each sample was embedded in an epoxy 178
resin, polished to optical grade and metalized by carbon deposition. 179
The specific surface area of the synthesized Cu-Hap powder were determined using 10 180
point adsorption isotherm of N2(g) at 77 K and the B.E.T. method (Tristar, Micromeritics). 181
182
2.4. Speciation calculations
183
From the composition of the synthetic solutions or mining waters (Table 2), the average 184
elemental concentrations and pH values of the systems at equilibrium, the saturation index of the 185
solutions with respect to the solid phases of interest were calculated with the geochemical 186
speciation model Phreeqc Interactive (Version 3.3.3)37. The solutions were considered at 187
equilibrium with air (pO2 = 0.2 atm and pCO2 = 10-3.5 atm). The calculations of the solubility 188
product accounted for the aqueous complexation reactions incorporated in the Thermochimie 189
database38, 39. The thermodynamic database was completed for Cu speciation using the data 190
reported in the Minteq.V4 database44 and for the standard solubility product of meta-autunite 191
(Ca(UO2)2(PO4)2 ·3H2O), uranyl hydrogen phosphate (UO2HPO4 ·3H2O) and meta-torbernite 192
determined by Gorman-Lewis et al.21 and by Cretaz et al.22, respectively. The activity 193
coefficients were calculated using the Davies equation implemented in the Phreeqc software. 194
195
3. RESULTS AND DISCUSSION
196
3.1.Characterizations of prepared Cu-Hap
197
The composition of the prepared Cu-Hap is indicated in Table 3. The Cu mole fraction 198
determined by total dissolution of the sample differed slightly from the expected value and 199
showed a decrease of the Ca incorporation yield when increasing the Cu content in the starting 200
mixture. This decrease led to the formation of non-stoichiometric Cu-Hap (with 1.67).
201
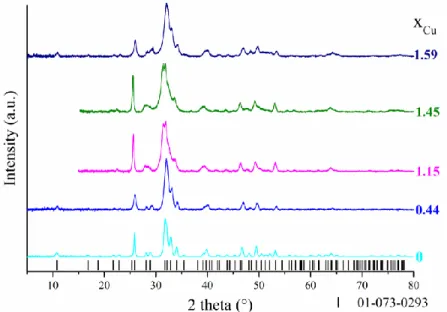
The PXRD patterns of the synthesized Cu-Hap is presented in Figure 1. All patterns showed the 202
XRD lines related to the hexagonal structure of hydroxyapatite (space group P63/m), excluding 203
the presence of secondary phase. The prepared samples were thus single phase for xCu 1.59. 204
The Rietveld refinement of the patterns indicated the contraction of the unit cell volume versus 205
the incorporation rate of copper (Table 3), as the result of the replacement of calcium by the 206
smaller copper in the structure. The unit-cell volume of the prepared Cu-Hap were also 207
compared to several values reported in the literature (Figure S2 included in the supporting 208
information). The results agreed well with the data reported by Shanmugam et al.30 and Li et al.32 209
for Cu substituted Hap. The unit cell volume presented a minimum for xCu = 0.44 (i.e. V = 210
524.86(8) Å3), then was found to be almost constant for xCu = 1.15; 1.45 and 1.59. Shanmugam 211
et al.30 obtained smaller unit cell volumes for 0.05 xCu 0.25 then observed an increase for xCu 212
= 0.5 (i.e. V= 525.6 Å3), which is in agreement with the data determined for xCu = 0.44. Such a 213
variation of the unit cell volume when substituting Ca by Cu could indicate different 214
incorporation modes in the solid solution, i.e. substitution in Ca1 or Ca2 sites and/or insertion in 215
the structure. Similar behavior was observed by Gomes et al.45 for Zn-Hap in which Zn atoms 216
occupy interstitial sites in Hap (Wyckoff site 2b), leading to solid solution with general 217
composition Ca10Znx(PO4)6O2x(OH)2–2x. Even if different substitution/incorporation mechanisms 218
could have led to the precipitation of these Cu-Hap samples, the variation of the unit cell volume 219
versus the copper content indicates that copper was not only adsorbed at the surface of Hap, but 220
incorporated in the lattice. This result suggests that the rate of Cu release in solution may be 221
controlled by the dissolution of the Cu-Hap sample. 222
Table 3. Reaction yield of precipitation determined from the analysis of the supernatant by 223
ICP-AES. Copper mole fraction xCu and (xCu+xCa)/xP ratio determined by total 224
dissolution of the precipitate, unit cell parameters determined by Rietveld refinement 225
from PXRD patterns and specific surface area of the synthesized Cu-Hap. The 226
copper contents in the Cu-Hap taken from the literature corresponds to the 227
stoichiometry of the mixture of reactants during the synthesis (except for Stanić et 228 al.34). 229 Ca yield (mol. %) Cu yield (mol. %) P yield (mol. %) xCu a (Å) c (Å) Cell volume (Å3) SBET (m²/g) 99.9 ± 0.1 N.D. 99.9 ± 0.1 0 1.7 ± 0.1 9.4213(3) 6.8908(2) 529.69(2) 80 97.6 ± 0.1 99.9 ± 0.1 99.8 ± 0.1 0.44 ± 0.01 1.9 ± 0.2 9.3859(8) 6.8794(6) 524.86(8) 85 88.5 ± 0.3 98.9 ± 0.1 95.6 ± 0.1 1.15 ± 0.01 1.4 ± 0.2 9.4240(5) 6.8500(4) 526.87(5) 147 82.9± 0.2 99.2 ± 0.1 96.0± 0.3 1.45 ± 0.01 1.5 ± 0.2 9.4282(6) 6.8493(4) 527.28(5) 76 N.D. N.D. N.D. 1.59 ± 0.01 1.6 ± 0.2 9.404(1) 6.8728(8) 526.4(1) 65 Shanmugam et al.30 0 9.42 6.88 528.8 0.05 9.328(4) 6.844(3) 515.6 0.1 9.358(9) 6.837(9) 518.7 0.15 9.333(0) 6.843(3) 516.2 0.2 9.353(2) 6.842(7) 518.4 0.25 9.337(8) 6.842(7) 516.7 0.5 9.397(0) 6.872(7) 525.6 Karpov et al.46 0.54 9.4303(1) 6.9069(1) 531.95(1) Stanić et al.34 0 1.65 9.4261 6.8971 530.71 0.0042 1.65 9.4249 6.8957 530.40 0.041 1.63 9.4218 6.8954 530.10 N.D.: not determined 230
231
Figure 1. PXRD patterns of the synthesized Cu-Hap. Black bars are the Bragg positions for
232
stoichiometric Hap (PDF 01-073-0293). 233
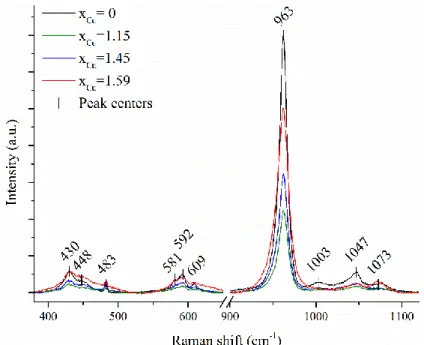
The Raman spectra recorded for all the synthesized Cu-Hap are showed in Figure 2 as well 234
as the position of the bands obtained for xCu = 0. The strongest Raman active mode 145, 47, 48 235
associated to symmetric stretching of the P-O bond was observed at 963 cm-1 and did not shift 236
when increasing the Cu content. As an example, O’Donnell et al.48 showed that the position of 237
the 1 band decreased linearly from 963 cm-1 (Hap) to 949 cm-1 for full substitution of Ca by 238
heavier Sr. For Zn-substituted Hap, Gomes et al.45 observed that the intense single band at 963 239
cm-1 was split in three resolved contributions indicating a local structure ordering. The absence 240
of shift in energy of this mode for the Cu-substituted hydroxyapatite indicates a negligible 241
compositional effect. The variation of the peak intensity was not correlated to the Cu content, but 242
rather revealed different degrees of crystallinity of the samples. 243
244
Figure 2. Raman spectra of the synthesized Cu-Hap. 245
3.2. Batch experiments
246
The prepared Cu-Hap were put in contact with solutions spiked with uranium. The 247
composition of the solutions at equilibrium with the Cu-Hap is listed in Table 4. The evolution 248
of the uranium concentration in the two mining waters contacted with the different Cu-Hap 249
samples is reported in Figure 3. The evolution of phosphorus and copper concentrations in
250
BD200 and V105 mining waters are showed in Figure S3 and Figure S4 of supporting
251
information, respectively.
253
254
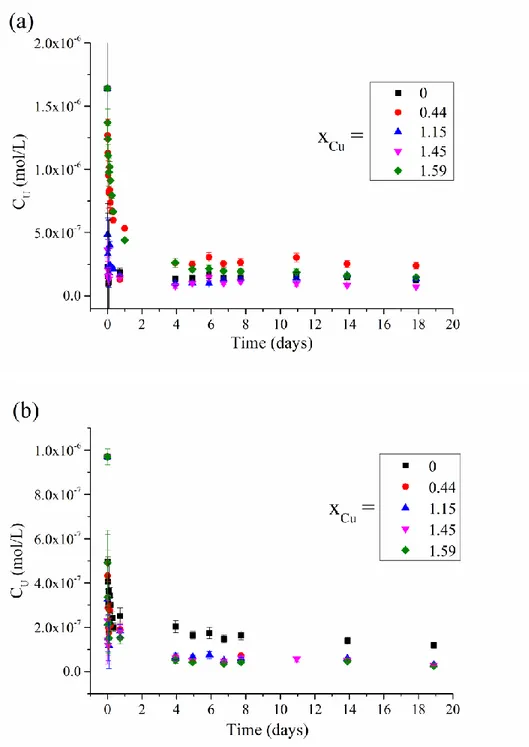
Figure 3. Evolution of the U elemental concentrations in BD200 (a) and V105 (b) mining
255
waters when contacting with the different prepared Cu-Hap samples. 256
From these results, a fast decrease of the uranium concentration was observed, followed by 257
the establishment of an equilibrium after 4 days of contact with the mining waters. For 258
experiments involving BD200 mining water, uranium concentrations obtained at equilibrium 259
with the Cu-Hap were found to vary between 0.7 ×10⁻⁷ to 2.4 ×10⁻⁷ mol/L without any 260
correlation with the amount of Cu incorporated in the Cu-Hap. For V105 mining water, it ranged 261
between 0.2 ×10⁻⁷ to 1.2 ×10⁻⁷ mol/L and slightly decreased with increase of the Cu mole 262
fraction in Cu-Hap. The benefit linked to the increase of the Cu content in the hydroxyapatite 263
structure was only significant for V105 mining water. V105 is more acidic than BD200 and the 264
synthetic solutions and contains less carbonate ions and more sulfate ions, affecting the 265
speciation of uranium in the mine waters (Table 2). Ca2(UO2)(CO3)3 and CaUO2(CO3)32- were 266
found to be the predominant species in BD200 (68 and 31%, respectively) whereas UO2(SO4) 267
and free UO22+ were predominant in V105 (63 and 24%, respectively). 268
The results obtained for the 0.02 mol/L NaNO3 and Na2SO4 synthetic solutions spiked with 269
10-3 mol/L of uranium are given in supporting information (Figure S5 and Figure S6, 270
respectively). Once again, a strong and fast decrease of the uranium elemental concentration was 271
observed. Uranium concentration obtained at equilibrium with Cu-Hap varied from 0.5 ×10⁻⁶ to 2 272
×10-6 mol/L whatever the Cu content in the Hap sample and the composition of the solution. This 273
decrease reached 3 orders of magnitude after only 1 day, showing that the presence of sulfate or 274
nitrate ions did not affect significantly the apparent solubility of the neoformed phase. This result 275
was supported by speciation calculations, which showed similar distribution of uranium in all the 276
synthetic solutions. Indeed, (UO2)2CO3(OH)3- was the predominant species in both 0.02 M 277
NaNO3 and Na2SO4 solutions (87.5 and 93.4%, respectively). 278
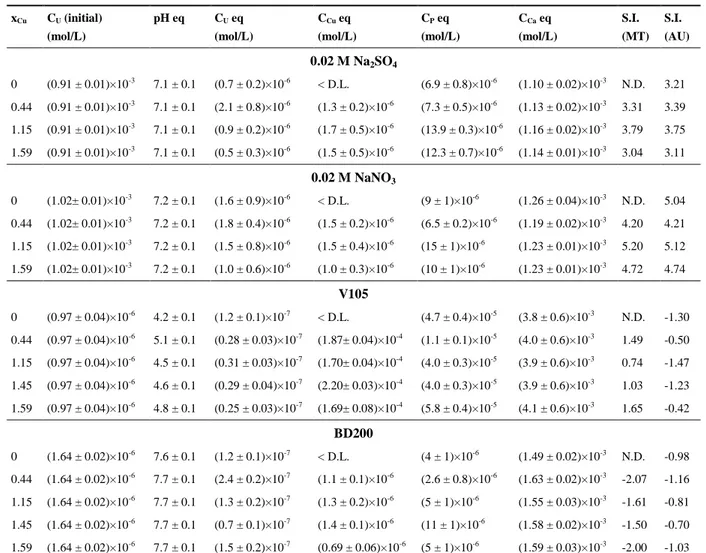
Table 4. Composition of the synthetic solutions at equilibrium with the Hap-Cu with various
280
Cu contents. Calculated saturation index of the solutions relative to meta-torbernite 281
(S.I. MT) and autunite (S.I. AU) using Phreeqc associated to selected thermodynamic 282 data21, 22, 38, 39, 44. 283 xCu CU (initial) (mol/L) pH eq CU eq (mol/L) CCu eq (mol/L) CP eq (mol/L) CCa eq (mol/L) S.I. (MT) S.I. (AU) 0.02 M Na2SO4 0 (0.91 ± 0.01)×10-3 7.1 ± 0.1 (0.7 ± 0.2)×10-6 < D.L. (6.9 ± 0.8)×10-6 (1.10 ± 0.02)×10-3 N.D. 3.21 0.44 (0.91 ± 0.01)×10-3 7.1 ± 0.1 (2.1 ± 0.8)×10-6 (1.3 ± 0.2)×10-6 (7.3 ± 0.5)×10-6 (1.13 ± 0.02)×10-3 3.31 3.39 1.15 (0.91 ± 0.01)×10-3 7.1 ± 0.1 (0.9 ± 0.2)×10-6 (1.7 ± 0.5)×10-6 (13.9 ± 0.3)×10-6 (1.16 ± 0.02)×10-3 3.79 3.75 1.59 (0.91 ± 0.01)×10-3 7.1 ± 0.1 (0.5 ± 0.3)×10-6 (1.5 ± 0.5)×10-6 (12.3 ± 0.7)×10-6 (1.14 ± 0.01)×10-3 3.04 3.11 0.02 M NaNO3 0 (1.02± 0.01)×10-3 7.2 ± 0.1 (1.6 ± 0.9)×10-6 < D.L. (9 ± 1)×10-6 (1.26 ± 0.04)×10-3 N.D. 5.04 0.44 (1.02± 0.01)×10-3 7.2 ± 0.1 (1.8 ± 0.4)×10-6 (1.5 ± 0.2)×10-6 (6.5 ± 0.2)×10-6 (1.19 ± 0.02)×10-3 4.20 4.21 1.15 (1.02± 0.01)×10-3 7.2 ± 0.1 (1.5 ± 0.8)×10-6 (1.5 ± 0.4)×10-6 (15 ± 1)×10-6 (1.23 ± 0.01)×10-3 5.20 5.12 1.59 (1.02± 0.01)×10-3 7.2 ± 0.1 (1.0 ± 0.6)×10-6 (1.0 ± 0.3)×10-6 (10 ± 1)×10-6 (1.23 ± 0.01)×10-3 4.72 4.74 V105 0 (0.97 ± 0.04)×10-6 4.2 ± 0.1 (1.2 ± 0.1)×10-7 < D.L. (4.7 ± 0.4)×10-5 (3.8 ± 0.6)×10-3 N.D. -1.30 0.44 (0.97 ± 0.04)×10-6 5.1 ± 0.1 (0.28 ± 0.03)×10-7 (1.87± 0.04)×10-4 (1.1 ± 0.1)×10-5 (4.0 ± 0.6)×10-3 1.49 -0.50 1.15 (0.97 ± 0.04)×10-6 4.5 ± 0.1 (0.31 ± 0.03)×10-7 (1.70± 0.04)×10-4 (4.0 ± 0.3)×10-5 (3.9 ± 0.6)×10-3 0.74 -1.47 1.45 (0.97 ± 0.04)×10-6 4.6 ± 0.1 (0.29 ± 0.04)×10-7 (2.20± 0.03)×10-4 (4.0 ± 0.3)×10-5 (3.9 ± 0.6)×10-3 1.03 -1.23 1.59 (0.97 ± 0.04)×10-6 4.8 ± 0.1 (0.25 ± 0.03)×10-7 (1.69± 0.08)×10-4 (5.8 ± 0.4)×10-5 (4.1 ± 0.6)×10-3 1.65 -0.42 BD200 0 (1.64 ± 0.02)×10-6 7.6 ± 0.1 (1.2 ± 0.1)×10-7 < D.L. (4 ± 1)×10-6 (1.49 ± 0.02)×10-3 N.D. -0.98 0.44 (1.64 ± 0.02)×10-6 7.7 ± 0.1 (2.4 ± 0.2)×10-7 (1.1 ± 0.1)×10-6 (2.6 ± 0.8)×10-6 (1.63 ± 0.02)×10-3 -2.07 -1.16 1.15 (1.64 ± 0.02)×10-6 7.7 ± 0.1 (1.3 ± 0.2)×10-7 (1.3 ± 0.2)×10-6 (5 ± 1)×10-6 (1.55 ± 0.03)×10-3 -1.61 -0.81 1.45 (1.64 ± 0.02)×10-6 7.7 ± 0.1 (0.7 ± 0.1)×10-7 (1.4 ± 0.1)×10-6 (11 ± 1)×10-6 (1.58 ± 0.02)×10-3 -1.50 -0.70 1.59 (1.64 ± 0.02)×10-6 7.7 ± 0.1 (1.5 ± 0.2)×10-7 (0.69 ± 0.06)×10-6 (5 ± 1)×10-6 (1.59 ± 0.03)×10-3 -2.00 -1.03 U concentrations at equilibrium with BD200 and V105 measured by ICP-MS for BD200 and 284
V105 and by ICP-AES for the other solutions. The uncertainties associated to the concentrations 285
at equilibrium were estimated as the standard deviation between consecutive concentrations 286
values that were not significantly different considering the experimental errors. < D.L.: below 287
detection limit. N.D.: not determined. 288
In order to gain insights in the mechanism associated to the uranium uptake by Cu-Hap, the 289
saturation indices (S.I.) with respect to uranium containing phases were calculated using the final 290
concentrations and pH for the various experiments (pH eq and Ci eq, Table 4) and the Phreeqc 291
software associated to selected thermodynamic data21, 22, 38, 39, 44. Positive S.I. values indicate that 292
the bulk solution is oversaturated with respect to the phase of interest, thus that precipitation of 293
the phase may occur. 294
For near neutral pH values, the synthetic solutions were found to be highly oversaturated 295
with respect to meta-autunite and meta-torbernite. The calculated S.I. of these two phases were 296
very close and did not allow to conclude which precipitation is privileged in the bulk solution. At 297
the end of these experiments, it is worth noting that the synthetic solutions were close to 298
equilibrium or slightly oversaturated with respect to hydroxyapatite49 (S.I. (Hap) varying from -299
0.35 to 2.17). 300
For BD200 mining water (pH eq = 7.7), the S.I. with respect to meta-torbernite and 301
autunite were negative, which indicated that precipitation in the bulk solution was not the driving 302
mechanism for uranium removal from solution. At the end of the experiments performed in 303
BD200, the solutions remained highly oversaturated with respect to hydroxyapatite, with S.I. 304
ranging from 4.7 to 6.5. The fact that the Cu-Hap was not dissolved in BD200 also argued in 305
favor of adsorption or surface precipitation caused by local saturation as the most likely 306
mechanisms. 307
For V105 mining water (pH eq < 5), meta-torbernite was the only uranium bearing phase 308
with positive S.I. at the end of experiments. Also, the solutions remained highly undersaturated 309
with respect to hydroxyapatite with S.I. ranging from -12.4 to -7.9. In such acidic solution, Cu-310
Hap was dissolved whereas meta-torbernite was precipitated in the bulk solution, leading to the 311
immobilization of uranium. 312
3.3. Characterization of neoformed phases
313
At the end of the batch experiments, solid and liquid phases were separated by 314
centrifugation and the solid phase was characterized systematically by PXRD. As an example, 315
the patterns recorded for the Cu-Hap with xCu = 1.59 contacted with the sodium nitrate and 316
sodium sulfate solutions spiked with uranyl are presented in Figure 4. The PXRD patterns 317
recorded for the Cu-Hap sample contacted with the synthetic solutions presented characteristic 318
peaks of a mixture of Hap and chernikovite (for xCu = 0) or meta-torbernite (for xCu > 0). These 319
patterns were refined by the Rietveld method to quantify the weight fraction of uranium bearing 320
phase in the mixture of crystalline phases (Table 5). All the samples exposed to the synthetic 321
solutions spiked with uranium at 10-3 mol/L presented high weight fraction of uranium (from 24 322
to 29 wt. %). The uranium loading calculated from the refinement of the PXRD patterns of the 323
remaining solid phase was found to be lower or close to the uranium weight fraction calculated 324
from the decrease of the uranium concentration in solution. This result indicated that a major part 325
of uranium (from 55 to 100 %) was uptaken from the solution by precipitation in a crystalline 326
phase. For Cu-undoped Hap structure, the neoformed phase was chernikovite (also called H-327
autunite). It was also observed in the uranium phase precipitates by Fanizza et al.3, Lammers et 328
al.14. and Fuller et al.5. Simon et al.12 reported the formation of chernikovite in mixtures with 329
autunite and meta-autunite. Mehta et al.6 also reported its formation in the absence of Ca or Na 330
co-solutes. Lingjun Kong et al.16, as well as Minhua Su et al.17 observed the incorporation of 331
U(VI) ions into autunite after removal from mining water by biochar Hap and porous Hap, 332
respectively. It is noteworthy that meta-autunite is the thermodynamically stable phase in our 333
conditions, but the formation of chernikovite is reported to be kinetically favored6, 12, 50. Fuller et 334
al.5 determined a threshold for the onset of chernikovite formation. Below 0.58 ± 0.08 wt. % of 335
uranium loading (i.e. 0.44 µmol/m² of uranium at the surface of Hap), the mechanism of sorption 336
is dominated by surface complexation. Above this limit, nucleation of chernikovite occurs either 337
at the Hap surface or in the bulk solution. Finally, depending on the composition of solution and 338
time, chernikovite can be transformed to meta-autunite by cationic exchange. For the synthetic 339
spiked solutions, U loadings of the Hap were much higher than the threshold authorizing 340
precipitation of chernikovite. Immobilization of uranium contacted with the Cu-Hap could have 341
followed a similar sorption mechanism. However, due to the presence of copper, meta-torbernite 342
was the uranium solubility controlling phase. 343
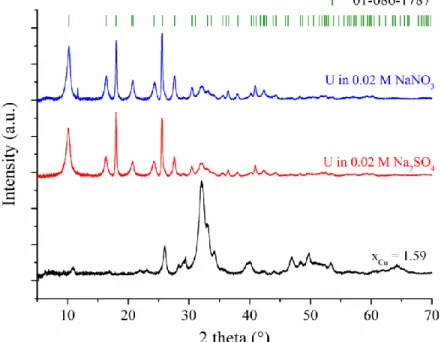
344
Figure 4. PXRD patterns of Cu-Hap sample (xCu = 1.59) before (black line) and after contact 345
with 0.02 M Na2SO4 (red line) and NaNO3 (blue line) solutions doped with uranium 346
(10-3 mol/L). The green bars correspond the Bragg positions obtained for meta-347
torbernite (PDF 01-086-1787). 348
The PXRD patterns recorded for Cu-Hap samples contacted with V105 and BD200 mining 349
waters are gathered in the supporting information (Figure S4). The PXRD patterns recorded at 350
the end of the batch experiments were similar to the XRD diagram of the starting Cu-Hap. 351
Considering the low amount of U immobilized in the solid phase (Table 5), the weight fraction 352
of any precipitated crystalline phase would be too low to be identified by PXRD, except for the 353
sample corresponding to xCu = 1.45 and contacted with V105. Raman spectroscopy was used to 354
characterize the solid phase at the end of the batch experiments. In order to illustrate the results, 355
Raman spectra obtained for Cu-Hap samples (xCu = 1.45) contacted with V105 and BD200 356
mining waters are compared to the Raman spectrum of the synthetic meta-torbernite (Figure S5). 357
This comparison did not show the presence of the characteristic bands of meta-torbernite. 358
Especially, the very intense band ascribed to the symmetric stretching vibration of UO22+ at 826 359
cm-1 51 was not observed in the Raman spectra of Cu-Hap samples contacted with mining waters. 360
These techniques are not sensitive enough to give insights into the mechanism of uranium 361
removal from the mining waters. 362
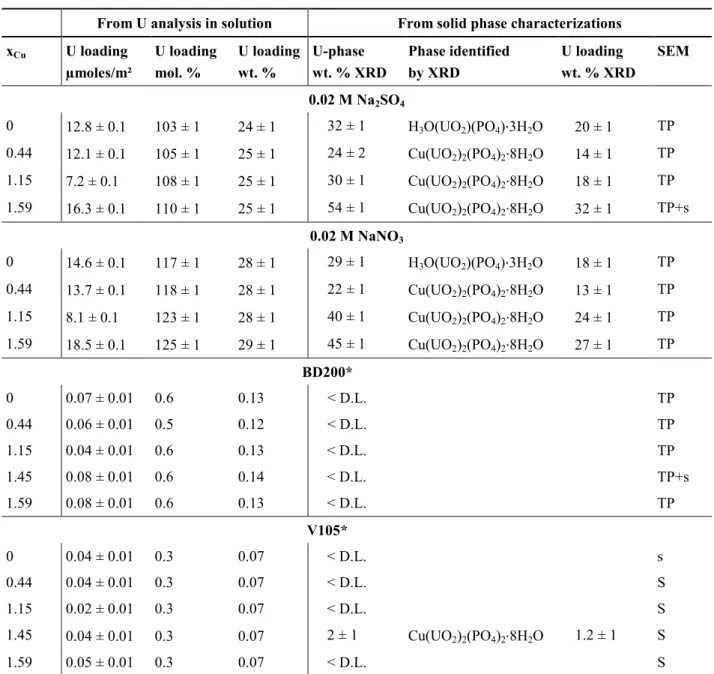
Table 5. Uranium loading of the solid phase calculated from CU decrease in solution at 364
equilibrium (by m², mol or mass of Cu-Hap introduced in the batch experiment) and 365
calculated from Rietveld refinement of the PXRD patterns of the solid phase after 366
exposure to spiked synthetic solutions (CU 10-3 mol/L) and mining waters (CU 10 -367
6 mol/L). Summary of SEM observations of the samples. 368
From U analysis in solution From solid phase characterizations xCu U loading µmoles/m² U loading mol. % U loading wt. % U-phase wt. % XRD Phase identified by XRD U loading wt. % XRD SEM 0.02 M Na2SO4 0 12.8 ± 0.1 103 ± 1 24 ± 1 32 ± 1 H3O(UO2)(PO4)·3H2O 20 ± 1 TP 0.44 12.1 ± 0.1 105 ± 1 25 ± 1 24 ± 2 Cu(UO2)2(PO4)2·8H2O 14 ± 1 TP 1.15 7.2 ± 0.1 108 ± 1 25 ± 1 30 ± 1 Cu(UO2)2(PO4)2·8H2O 18 ± 1 TP 1.59 16.3 ± 0.1 110 ± 1 25 ± 1 54 ± 1 Cu(UO2)2(PO4)2·8H2O 32 ± 1 TP+s 0.02 M NaNO3 0 14.6 ± 0.1 117 ± 1 28 ± 1 29 ± 1 H3O(UO2)(PO4)·3H2O 18 ± 1 TP 0.44 13.7 ± 0.1 118 ± 1 28 ± 1 22 ± 1 Cu(UO2)2(PO4)2·8H2O 13 ± 1 TP 1.15 8.1 ± 0.1 123 ± 1 28 ± 1 40 ± 1 Cu(UO2)2(PO4)2·8H2O 24 ± 1 TP 1.59 18.5 ± 0.1 125 ± 1 29 ± 1 45 ± 1 Cu(UO2)2(PO4)2·8H2O 27 ± 1 TP BD200* 0 0.07 ± 0.01 0.6 0.13 < D.L. TP 0.44 0.06 ± 0.01 0.5 0.12 < D.L. TP 1.15 0.04 ± 0.01 0.6 0.13 < D.L. TP 1.45 0.08 ± 0.01 0.6 0.14 < D.L. TP+s 1.59 0.08 ± 0.01 0.6 0.13 < D.L. TP V105* 0 0.04 ± 0.01 0.3 0.07 < D.L. s 0.44 0.04 ± 0.01 0.3 0.07 < D.L. S 1.15 0.02 ± 0.01 0.3 0.07 < D.L. S 1.45 0.04 ± 0.01 0.3 0.07 2 ± 1 Cu(UO2)2(PO4)2·8H2O 1.2 ± 1 S 1.59 0.05 ± 0.01 0.3 0.07 < D.L. S
< D.L.: below detection limit. H3O(UO2)(PO4)·3H2O: chernikovite (PDF 01-075-1106); 369
Cu(UO2)2(PO4)2·8H2O: meta-torbernite (PDF 01-086-1787). 370
*Analyses of uranium concentrations at equilibrium performed by ICP-MS. TP: thin platelets 371
covering Cu-Hap observed by SEM, s: presence of small square-shaped crystals (less than 1×1 372
µm²) observed by SEM, S: presence of large square-shaped crystals (more than 3×3 µm²) 373
observed by SEM. 374
In order to confirm the precipitation of uranium from the synthetic doped solutions either 375
as chernikovite (for xCu = 0), or as meta-torbernite (for xCu >0), SEM micrographs were recorded 376
in the backscattered electron mode. The micrographs presented in Figure 5 showed the presence 377
of Cu-Hap agglomerates covered by thin platelets showing a strong backscattered emission 378
indicative of uranium. X-EDS maps (supporting information, Figure S6) evidenced the 379
precipitation of uranium as secondary phase at the surface of Cu-Hap, which confirms the 380
uranium uptake from the synthetic solutions spiked with CU 10-3 mol/L. Additionally, the 381
presence of bright platy squared-shape crystals of 0.5×0.5 µm² in size was identified for Cu-Hap 382
contacted with synthetic sulfate solution (xCu = 1.59, see xCu= 1.59/ S in Figure 5). This 383
morphology was characteristic of crystals of the autunite family5, 16, 19, 22, 52. 384
For Cu-Hap samples contacted with the BD200 mining water, U was not detected by X-385
EDS. However, backscattered images showed the presence of thin platelets covering the surface 386
of agglomerates of Cu-Hap particles (Figure 6). In the samples contacted with V105, the 387
presence of bright and platy squared-shape crystals was systematically observed (Figure 6). The 388
crystals reached 2 to 4 µm in size for Cu-Hap compared to 0.5 µm for non-substituted Hap (xCu = 389
0). U, P, Ca, Cu and Al were detected by X-EDS in the squared-shape grains. Although the 390
quantification of the mass content of each element in the square-shaped crystals was difficult due 391
to the vicinity of Cu-Hap particles, U elemental content was found to vary between 40 wt.% (for 392
xCu = 0) and 62 wt. % for (xCu =1.59), which was consistent with the precipitation of either 393
chernikovite, autunite or meta-torbernite phases. 394
The different morphologies of uranium bearing phase observed for the samples contacted 395
with V105 and BD200 mining waters could indicate the existence of different immobilization 396
mechanisms for uranium. This assumption was strengthened by the values of saturation index 397
calculated for the bulk solution (Table 4). Indeed, positive saturation indexes was found for 398
meta-torbernite at the end of experiments for Cu-Hap contacted with V105, whereas negative 399
saturation indexes were determined for meta-torbenite and autunite for Cu-Hap contacted with 400
BD200. The main reason for this discrepancy was due to differences of the pH value, which was 401
much lower for V105 than for BD200. During the experiments with V105, such pH favored the 402
dissolution of the Cu-Hap and finally led to the strong increase of the Ca, Cu and P 403
concentrations in the solution. This allowed the establishment of oversaturated conditions in the 404
bulk solution with respect to meta-torbernite even for low uranium concentration in solution. On 405
the contrary, for experiments with BD200, the formation of thin platelet crystals could result 406
from local oversaturation when U, P, Ca and/or Cu concentrations were higher at the Cu-Hap 407
surface than in the bulk. A similar mechanism was evidenced by Ohnuki et al.28. It was called 408
surface mineralization. Nevertheless, the presence of brighter thin platelets could also result from 409
uranium sorption phenomena onto the surface of Cu-Hap, as already evidenced by Fuller et al.5 410
for Hap using low uranium loadings. 411
412
Figure 5. SEM micrographs (backscattered electron mode) of Cu-Hap resulting from the
413
contact with synthetic solutions doped with uranyl (CU 10-3 mol/L), showing the 414
presence of very thin platelets covering the Cu-Hap surfaces (bright areas). The
415
yellow-circled zone highlights the presence of square-shaped uranium bearing
416
crystals.
417 418
420
Figure 6. SEM micrographs of Cu-Hap (xCu = 1.45) resulting from contact with mining waters 421
V105 and BD200 (backscattered electron mode, except for x= 1.45/ BD200) 422
containing uranyl (CU 10-6 mol/L). The images at high magnifications highlights 423
the presence of square-shaped uranium bearing crystals of various sizes. 424
425
The TRLFS spectra of Cu-Hap samples at the end of the batch experiments are reported in 426
Figure 7. All the spectra were characteristic of the luminescence of U(VI) compounds, with the
427
observation of the five main peaks in the 480-600 nm range. The fluorescence spectra of the 428
samples contacted with the synthetic solutions of uranyl in Na2SO4 (Figure 7 a) or NaNO3 429
(Figure 7 b) synthetic solutions were all similar whatever the Cu content. These spectra were 430
also comparable, in terms of peak locations, to the spectra recorded for synthesized meta-431
autunite, meta-torbernite and chernikovite (peaks positions and FWHM are gathered in Table S1 432
of the supporting information). The larger peak widths in the sample spectra probably suggested 433
a lower degree of crystallinity or different crystal shapes. TRLFS hardly distinguished meta-434
torbernite from chernikovite, which appears in agreement with previous recordings on 435
chernikovite53 and meta-torbernite minerals54. It can be inferred that the luminescence of U(VI) 436
in both minerals is similar due to the very similar local environment of uranyl in both 437 10 µm 500 nm xCu= 0 / V105 10 µm xCu= 0 / BD200 2 µm
structures55-57. As a matter of fact, regardless of the Cu content in the Cu-Hap, the fluorescence 438
spectra suggest the precipitation of an uranium-bearing phase from the autunite family. 439
The spectra of Cu-Hap samples contacted with the mining waters differed from the 440
previous ones (Figure 7 c). It is noteworthy that the intensity of the TRFLS signal was much 441
lower than for the samples contacted with synthetic solutions due to lower uranyl loading (Table 442
5). The positions of the maximum of the peaks were shifted towards the lower wavelengths by
443
about 5 and 2 nm for the samples contacted with V105 and BD200, respectively. For 444
experiments developed with V105, no significant change in the peak position was observed with 445
increasing xCu. This suggests that the local structure around U(VI) was not significantly different. 446
For BD200, the fluorescence signal was only detected for xCu = 0. Because U loading is similar 447
in all the samples contacted with BD200, the absence of signal for xCu > 0 could be due to the 448
existence of fluorescence quenching effects. Cu2+, among other metal cations, is well known to 449
be a quencher of the U(VI) luminescence in solution58. The precise assignment of the spectra 450
recorded for Cu-Hap samples contacted with V105 and BD200 is difficult. It confirms that the 451
mechanism of interaction may be different to that observed when Cu-Hap was contacted with 452
synthetic uranyl solutions. 453
455
457
Figure 7. TRLFS spectra of Cu-Hap samples resulting from contact with 0.02 M Na2SO4 (a); 458
and 0.02 M NaNO3 (b) synthetic solutions; with BD200 and V105 mining waters (c). 459
The spectra are compared with reference spectra obtained for synthetic meta-460
torbernite, meta-autunite and chernikovite59. Doted lines indicate the position of the 461
maximum of the peaks for the meta-torbernite reference. 462
463
3.4.ENVIRONMENTAL IMPLICATIONS
464
This study demonstrated that Cu-Hap was effective in lowering U concentration when 465
contacting with synthetic solutions or real mining waters. These results showed the high 466
reactivity of the prepared Cu- Hap, which was associated to its poor crystallinity and high 467
specific surface area. Furthermore, the potential carbonate substitution for OH- and PO43- in the 468
Hap lattice is known to increase its solubility and thus its global reactivity60, 61. Thus, this 469
material appears as promising in the field of passive treatment devices such as permeable 470
reactive barriers for mining water remediation. Depending on the initial pH and CU of the mining 471
or doped solutions, several processes were evidenced to support the uranium uptake (Figure 8). 472
First, the precipitation of meta-torbernite actually occurred when the bulk solution was 473
oversaturated (case I and II). For V105 (case I), the low pH of the mining water led to the 474
increase of the Cu-Hap solubility. As the S.I. of the bulk solution remained close to equilibrium, 475
the growth of MT crystals was favored. In the second case (synthetic solutions at near neutral 476
pH, case II), oversaturated conditions were reached due to the high uranium concentrations 477
whereas the low solubility of Cu-Hap led to low Cu and P concentrations in solution. As the S.I. 478
of the solutions were highly positive, the nucleation rate was high especially close to the 479
solid/solution interface, leading to the formation of clusters of small crystals covering the surface 480
of the Cu-Hap. These experimental results indicated that precipitation of meta-torbernite can be 481
considered as a potential effective strategy to remove uranium from contaminated water 482
contacted with Cu-Hap. For BD200 mining water (case III), the mechanism for U removal was 483
only speculative. As the bulk solution remained undersaturated, adsorption4, 5, 12, 15, incorporation 484
in the Cu-Hap structure28 or combination of both processes7 were likely to occur. 485
486
Figure 8. Saturation index of the synthetic solutions and mine waters with respect to
meta-487
torbernite obtained at the end of the batch experiments after contact with Cu-Hap (a). 488
Schematic representation of the three potential processes associated to the uranium 489
uptake (b). 490
491
In the absence of Cu and as evidenced by several authors, chernikovite is the precipitating 492
uranium-bearing phase. In order to illustrate the interest of incorporating copper in the Hap, 493
simulations were performed with synthetic 0.02 M NaNO3 and 0.02 M Na2SO4 solutions doped 494
with 7.6 µM of uranium, which corresponds to the current French regulatory limit for water 495 4 5 6 7 8 9 -8 -4 0 4 8 Saturation ind ex (MT) pH Na2SO4 synthetic solution NaNO3 synthetic solution BD200 mining water V105 mining water
I
II
III
(a)
(b)
discharges in the environment. Ca, Cu and P concentrations were calculated by dissolving Cu-496
Hap with xCu = 1.45 until the solubility of Hap49 was reached. Using the same selected 497
thermodynamic data21, 22, 38, 39, 44, the S.I. were calculated in the solutions with respect to meta-498
torbernite and chernikovite, for pH range representative of most of the mining waters. From 499
these calculations, it is clear that the pH range associated to the precipitation of meta-torbernite is 500
larger than for chernikovite (Figure 9). Especially, for 6.7 pH 8.2, the solution remained 501
oversaturated regarding to meta-torbernite whereas it was undersaturated regarding to 502
chernikovite. Moreover, meta-torbernite was the most stable phase in the whole pH range. For all 503
the conditions examined, the simulations demonstrated that the precipitation of meta-torbernite 504
could occur in solutions contacted with Cu-Hap, leaving uranium concentration below the 505
regulatory limit in a wide pH range. 506
507
Figure 9. Variation of the saturation index relative to meta-torbernite (MT) and chernikovite
508
(CH) versus pH obtained for a synthetic solution doped with 7.6 µM of uranium. 509
Continuous and dashed lines correspond to 0.02 M NaNO3 and 0.02 M Na2SO4 510
solution, respectively. Gray and hatched areas show the pH range for precipitation of 511
MT and CH, respectively. 512
To conclude, the main interest for using Cu-Hap is to enlarge the domain of water 513
compositions for which the precipitation of uranyl phosphate is the predominant mechanism 514 4 5 6 7 8 9 -12 -8 -4 0 4 8 12 Saturation ind ex pH Meta-torbernite Chernikovite
associated to the uranium removal, especially for pH > 6.7 where carbonate uranium species are 515
predominant in the speciation diagrams and pH < 3.3. Fast kinetics of precipitation associated 516
with large field of stability of the meta-torbernite made the formation of meta-torbernite crystals 517
less sensitive to the uranium speciation than for chernikovite or meta-autunite. This mechanism 518
of uranium immobilization led to the formation of crystals, highly enriched in uranium, which 519
could be separated afterwards from the Cu-Hap matrix (e.g. through differential sedimentation). 520
Using this kind of separation process could strongly reduce the amount of contaminated waste to 521
be treated or stored. 522
523
Supporting Information. Figure S1 to S6 and Table S1 are available in the supporting
524 information file. 525 Corresponding Author 526 *Email: [email protected] 527 ACKNOWLEDGMENT 528
This research was carried out within the framework of a CEA-Orano Mining collaboration and 529
with the precious assistance of people from the Orano Mining Après-Mines France Department 530
(Bessines sur Gartempe, France) to access and sample the mining waters from the Bellezane site. 531
532
REFERENCES 533
1. Naftz, D. L.; Morrison, S. J.; Feltcorn, E. M.; Freethey, G. W.; Fuller, C. C. P., M.J.; 534
Wilhelm, R. G.; R.C., R.; J.A., D.; J.E., B. Field Demonstration Of Permeable Reactive Barriers 535
To Remove Dissolved Uranium From Groundwater, Fry Canyon, Utah; 2000. 536
2. Tokunaga, T. K.; Kim, Y.; Wan, J. M., Potential Remediation Approach for Uranium-537
Contaminated Groundwaters Through Potassium Uranyl Vanadate Precipitation. Environ Sci 538
Technol 2009, 43, (14), 5467-5471. 539
3. Fanizza, M. F.; Yoon, H.; Zhang, C. Y.; Oostrom, M.; Wietsma, T. W.; Hess, N. J.; 540
Bowden, M. E.; Strathmann, T. J.; Finneran, K. T.; Werth, C. J., Pore-scale evaluation of uranyl 541
phosphate precipitation in a model groundwater system. Water Resources Research 2013, 49, 542
(2), 874-890. 543
4. Fuller, C. C.; Bargar, J. R.; Davis, J. A., Molecular-scale characterization of uranium 544
sorption by bone apatite materials for a permeable reactive barrier demonstration. Environ Sci 545
Technol 2003, 37, (20), 4642-4649. 546
5. Fuller, C. C.; Bargar, J. R.; Davis, J. A.; Piana, M. J., Mechanisms of uranium 547
interactions with hydroxyapatite: Implications for groundwater remediation. Environ Sci Technol 548
2002, 36, (2), 158-165.
549
6. Mehta, V. S.; Maillot, F.; Wang, Z.; Catalano, J. G.; Giammar, D. E., Effect of co-solutes 550
on the products and solubility of uranium(VI) precipitated with phosphate. Chemical Geology 551
2014, 364, 66-75.
552
7. Mehta, V. S.; Maillot, F.; Wang, Z.; Catalano, J. G.; Giammar, D. E., Effect of Reaction 553
Pathway on the Extent and Mechanism of Uranium(VI) Immobilization with Calcium and 554
Phosphate. Environ Sci Technol 2016, 50, (6), 3128-3136. 555
8. Mehta, V. S.; Maillot, F.; Wang, Z. M.; Catalano, J. G.; Giammar, D. E., Transport of 556
U(VI) through sediments amended with phosphate to induce in situ uranium immobilization. 557
Water Research 2015, 69, 307-317. 558
9. Pan, Z. Z.; Giammar, D. E.; Mehta, V.; Troyer, L. D.; Catalano, J. G.; Wang, Z. M., 559
Phosphate-Induced Immobilization of Uranium in Hanford Sediments. Environ Sci Technol 560
2016, 50, (24), 13486-13494.
561
10. Troyer, L. D.; Maillot, F.; Wang, Z. M.; Wang, Z. M.; Mehta, V. S.; Giammar, D. E.; 562
Catalano, J. G., Effect of phosphate on U(VI) sorption to montmorillonite: Ternary complexation 563
and precipitation barriers. Geochimica Et Cosmochimica Acta 2016, 175, 86-99. 564
11. Saldi, G. D.; Daval, D.; Guo, H.; Guyot, F.; Bernard, S.; Le Guillou, C.; Davis, J. A.; 565
Knauss, K. G., Mineralogical evolution of Fe-Si-rich layers at the olivine-water interface during 566
carbonation reactions. American Mineralogist 2015, 100, (11-12), 2655-2669. 567
12. Simon, F. G.; Biermann, V.; Peplinski, B., Uranium removal from groundwater using 568
hydroxyapatite. Applied Geochemistry 2008, 23, (8), 2137-2145. 569
13. Raicevic, S.; Wright, J. V.; Veljkovic, V.; Conca, J. L., Theoretical stability assessment 570
of uranyl phosphates and apatites: Selection of amendments for in situ remediation of uranium. 571
Science of the Total Environment 2006, 355, (1-3), 13-24. 572
14. Lammers, L. N.; Rasmussen, H.; Adilman, D.; deLemos, J. L.; Zeeb, P.; Larson, D. G.; 573
Quicksall, A. N., Groundwater uranium stabilization by a metastable hydroxyapatite. Applied 574
Geochemistry 2017, 84, 105-113. 575
15. Arey, J. S.; Seaman, J. C.; Bertsch, P. M., Immobilization of uranium in contaminated 576
sediments by hydroxyapatite addition. Environ Sci Technol 1999, 33, (2), 337-342. 577
16. Kong, L.; Ruan, Y.; Zheng, Q.; Su, M.; Diao, Z.; Chen, D.; Hou, L. a.; Chang, X.; Shih, 578
K., Uranium extraction using hydroxyapatite recovered from phosphorus containing waste water. 579
Journal of Hazardous Materials 2020, 382, 120784. 580
17. Su, M.; Tsang, D. C. W.; Ren, X.; Shi, Q.; Tang, J.; Zhang, H.; Kong, L.; Hou, L. a.; 581
Song, G.; Chen, D., Removal of U(VI) from nuclear mining effluent by porous hydroxyapatite: 582
Evaluation on characteristics, mechanisms and performance. Environmental Pollution 2019, 254, 583
112891. 584
18. Dzik, E. A.; Lobeck, H. L.; Zhang, L.; Burns, P. C., Thermodynamic properties of 585
phosphate members of the meta-autunite group: A high-temperature calorimetric study. Journal 586
of Chemical Thermodynamics 2017, 114, 165-171. 587
19. Jerden Jr, J. L.; Sinha, A. K., Phosphate based immobilization of uranium in an oxidizing 588
bedrock aquifer. Applied Geochemistry 2003, 18, (6), 823-843. 589
20. Gorman-Lewis, D.; Burns, P. C.; Fein, J. B., Review of uranyl mineral solubility 590
measurements. Journal of Chemical Thermodynamics 2008, 40, (3), 335-352. 591
21. Gorman-Lewis, D.; Shvareva, T.; Kubatko, K. A.; Burns, P. C.; Wellman, D. M.; 592
McNamara, B.; Szymanowski, J. E. S.; Navrotsky, A.; Fein, J. B., Thermodynamic Properties of 593
Autunite, Uranyl Hydrogen Phosphate, and Uranyl Orthophosphate from Solubility and 594
Calorimetric Measurements. Environ Sci Technol 2009, 43, (19), 7416-7422. 595
22. Cretaz, F.; Szenknect, S.; Clavier, N.; Vitorge, P.; Mesbah, A.; Descostes, M.; Poinssot, 596
C.; Dacheux, N., Solubility properties of synthetic and natural meta-torbernite. Journal of 597
Nuclear Materials 2013, 442, (1-3), 195-207. 598
23. Vesely, V.; Pekarek, V.; Abbrent, M., A study of uranyl phosphates. 3. Solubility 599
products of uranyl hydrogen phosphate uranyl orthophosphate and some alkali uranyl 600
phosphates. J Inorg Nucl Chem 1965, 27, (5), 1159-1166. 601
24. Pekarek, V.; Vesely, V.; Ullrich, J., Synthetic double phosphates of uranyl with divalent 602
cations - Solubility and some physico-chemical properties. Bulletin De La Societe Chimique De 603
France 1968, 1844-&. 604
25. Ilton, E. S.; Zachara, J. M.; Moore, D. A.; McKinley, J. P.; Eckberg, A. D.; Cahill, C. L.; 605
Felmy, A. R., Dissolution Study of Metatorbernite: Thermodynamic Properties and the Effect of 606
pH and Phosphate. Environ Sci Technol 2010, 44, (19), 7521-7526. 607
26. Van Haverbeke, L.; Vochten, R.; Van Springel, K., Solubility and spectrochemical 608
characteristics of synthetic chernikovite and meta-ankoleite. Mineralogical Magazine 1996, 60, 609
(5), 759-766. 610
27. Schindler, M.; Durocher, J. L.; Kotzer, T. G.; Hawthorne, F. C., Uranium-bearing phases 611
in a U-mill disposal site in Northern Canada: Products of the interaction between 612
leachate/raffinate and tailings material. Applied Geochemistry 2013, 29, 151-161. 613
28. Ohnuki, I.; Kozai, N.; Samadfam, M.; Yasuda, R.; Yamamoto, S.; Narumi, K.; Naramoto, 614
H.; Murakami, T., The formation of autunite (Ca(UO2)2(PO4)2. nH2O)within the leached layer of 615
dissolving apatite: incorporation mechanism of uranium by apatite. Chemical Geology 2004, 616
211, (1-2), 1-14. 617
29. Rakovan, J.; Reeder, R. J.; Elzinga, E. J.; Cherniak, D. J.; Tait, C. D.; Morris, D. E., 618
Structural characterization of U(VI) in apatite by X-ray absorption spectroscopy. Environ Sci 619
Technol 2002, 36, (14), 3114-3117. 620
30. Shanmugam, S.; Gopal, B., Copper substituted hydroxyapatite and fluorapatite: 621
Synthesis, characterization and antimicrobial properties. Ceramics International 2014, 40, (10), 622
15655-15662. 623
31. Tounsi, H.; Djemal, S.; Petitto, C.; Delahay, G., Copper loaded hydroxyapatite catalyst 624
for selective catalytic reduction of nitric oxide with ammonia. Applied Catalysis B: 625
Environmental 2011, 107, (1–2), 158-163. 626
32. Li, C.; Ge, X.; Zhao, J.; Li, G.; Bai, J.; Du, Q.; Ding, R., Preparation and characterization 627
of novel hydroxyapatite/copper assemblies with well-defined morphologies. Solid State Sciences 628
2014, 29, 66-74.
629
33. Li, Y.; Ho, J. H.; Ooi, C. P., Antibacterial efficacy and cytotoxicity studies of copper (II) 630
and titanium (IV) substituted hydroxyapatite nanoparticles. Materials Science & Engineering C-631
Materials for Biological Applications 2010, 30, (8), 1137-1144. 632
34. Stanic, V.; Dimitrijevic, S.; Antic-Stankovic, J.; Mitric, M.; Jokic, B.; Plecas, I. B.; 633
Raicevic, S., Synthesis, characterization and antimicrobial activity of copper and zinc-doped 634
hydroxyapatite nanopowders. Applied Surface Science 2010, 256, (20), 6083-6089. 635
35. Liu, G.; Talley, J. W.; Na, C. Z.; Larson, S. L.; Wolfe, L. G., Copper Doping Improves 636
Hydroxyapatite Sorption for Arsenate in Simulated Groundwaters. Environ Sci Technol 2010, 637
44, (4), 1366-1372. 638
36. Wallaeys, R., Contribution à l'études des apatites phosphocalciques. Annales de Chimie 639
1952, 7, 808-848.
640
37. Parkhurst, D. H.; Appelo, C. A. J. User's Guide to PHREEQC (Version 2) - A Computer 641
Program for Speciation, Batch-Reaction, One-Dimensional Transport, and Inverse Geochemical 642
Calculations; U.S.G.S Water-Resources Investigations Report 99-4259: 1999. 643
38. Giffaut, E.; Grivé, M.; Blanc, P.; Vieillard, P.; Colàs, E.; Gailhanou, H.; Gaboreau, S.; 644
Marty, N.; Madé, B.; Duro, L., Andra thermodynamic database for performance assessment: 645
ThermoChimie. Applied Geochemistry 2014, 49, 225-236. 646
39. Grivé, M.; Duro, L.; Colàs, E.; Giffaut, E., Thermodynamic data selection applied to 647
radionuclides and chemotoxic elements: An overview of the ThermoChimie-TDB. Applied 648
Geochemistry 2015, 55, 85-94. 649
40. Reiller, P. E.; Descostes, M., Building and Application of the Thermodynamic Database 650
PRODATA, Dedicated to Mining and Environmental Monitoring Activities. Submitted in 651
Chemosphere 2019. 652
41. Frontera, C.; Rodriguez-Carvajal, J., FullProf as a new tool for flipping ratio analysis. 653
Physica B: Condensed Matter 2003, 335, (1-4), 219-222. 654
42. Thompson, P.; Cox, D. E.; Hastings, J. B., Rietveld Refinement of Debye-Scherrer 655
Synchrotron X-Ray Data from Al2O3 Journal of Applied Crystallography 1987, 20, 79-83. 656
43. Othmane, G.; Allard, T.; Vercouter, T.; Morin, G.; Fayek, M.; Calas, G., Luminescence 657
of uranium-bearing opals: Origin and use as a pH record. Chemical Geology 2016, 423, 1-6. 658
44. Allison, J. D.; Brown, D. S.; Novo-Grada, K. J., MINTEQA2/PRODEFA2 - A 659
Geochemical Assessment Model for Environmental Systems - Version 3.0 User's Manual: 660
Environmental Research Laboratory. Office of Resaerch Athens, Georgia. 1990. 661
45. Gomes, S.; Nedelec, J.-M.; Jallot, E.; Sheptyakov, D.; Renaudin, G., Unexpected 662
Mechanism of Zn2+ Insertion in Calcium Phosphate Bioceramics. Chemistry of Materials 2011, 663
23, (12), 3072-3085. 664
46. Karpov, A. S.; Nuss, J.; Jansen, M.; Kazin, P. E.; Tretyakov, Y. D., Synthesis, crystal 665
structure and properties of calcium and barium hydroxyapatites containing copper ions in 666
hexagonal channels. Solid State Sciences 2003, 5, (9), 1277-1283. 667
47. Antonakos, A.; Liarokapis, E.; Leventouri, T., Micro-Raman and FTIR studies of 668
synthetic and natural apatites. Biomaterials 2007, 28, (19), 3043-3054. 669
48. O'Donnell, M. D.; Fredholm, Y.; de Rouffignac, A.; Hill, R. G., Structural analysis of a 670
series of strontium-substituted apatites. Acta Biomaterialia 2008, 4, (5), 1455-1464. 671