HAL Id: tel-01249564
https://tel.archives-ouvertes.fr/tel-01249564
Submitted on 4 Jan 2016
HAL is a multi-disciplinary open access archive for the deposit and dissemination of sci-entific research documents, whether they are pub-lished or not. The documents may come from teaching and research institutions in France or abroad, or from public or private research centers.
L’archive ouverte pluridisciplinaire HAL, est destinée au dépôt et à la diffusion de documents scientifiques de niveau recherche, publiés ou non, émanant des établissements d’enseignement et de recherche français ou étrangers, des laboratoires publics ou privés.
Earthquake cycle and continental deformation along the
Peruvian subduction zone
Juan Carlos Villegas Lanza
To cite this version:
Juan Carlos Villegas Lanza. Earthquake cycle and continental deformation along the Peruvian subduc-tion zone. Earth Sciences. Université Nice Sophia Antipolis, 2014. English. �NNT : 2014NICE4087�. �tel-01249564�
UNIVERSITE DE NICE SOPHIA ANTIPOLIS - UFR SCIENCES
Ecole Doctorale des Sciences Fondamentales et AppliquéesT H E S E
pour obtenir le titre de
Docteur en Sciences
de l’UNIVERSITE de Nice-Sophia Antipolis
Spécialité: Sciences de la Terre et de l’Univers - Géophysique
Présentée et soutenue par
Juan Carlos VILLEGAS LANZA
Earthquake cycle and continental deformation along the
Peruvian subduction zone
Cycle sismique et déformation continentale le long de la
subduction Péruvienne
Thèse dirigée par
Jean-Mathieu NOCQUET
etMohamed CHLIEH
Soutenue le 05 Novembre 2014
Jury :
VIGNY Christophe Directeur de Recherche Rapporteur
AUDIN Laurence Chargée de Recherche Rapporteur
M. DELOUIS Bertrand Professeur Examinateur
SOCQUET Anne Physicien Adjoint Examinatrice
NOCQUET, Jean-Mathieu Directeur de Recherche Directeur de thèse
Abstract
The Nazca/South American subduction zone is one of the most active regions on Earth. Large earthquakes and associated tsunamis occur recurrently almost all along its margin. Nevertheless, the ~1000 km long (from lat.2ºS to 9ºS) segment in northern Peru and southern Ecuador subduction has remained in relative seismic silence for at least the past five centuries. Before the work presented in this thesis, no information about the processes accommodating the convergence was available for this region and it was impossible to answer whether it could host a great Mw>8.5 earthquake in future or not. Nowadays, spatial geodesy, and more specifically GPS/GNSS enable us to quantify the surface displacement on the overriding plate with a millimeter accuracy. Geodetic measurements together with the use of elastic models allow us to determine the amount of interseismic coupling at the plate interface. My thesis focuses on the seismic cycle and the continental deformation along the Peruvian subduction margin, with particular interest along its northern and central segments. We use GPS measurements acquired since 2008 in the frame of an international French-Peruvian-Ecuadorian project (the Andes Du Nord project, ADN). Our GPS velocity field covers the entire Peruvian subduction margin, with measurements in the Andean cordillera and part of the sub-Andean region. Modeling of GPS velocity field show the existence of a new tectonic microplate that we baptized as the Inca Sliver, which is in southeastward translation a rate of 4-5 mm/yr with respect to stable South America. The Inca sliver encompasses the entire Peruvian subduction margin from southern Ecuador to northern Bolivia including the coastal areas and the Western cordillera of Peru. We find that the Inca sliver diverges from the North Andean Sliver in Ecuador and Colombia, contributing to the opening of the Gulf of Guayaquil. In its southern part, the Inca sliver possibly contributes to the lateral holding of the Altiplano plateau. We propose that the primary driving process that induces the motion of the slivers observed all along the Andes is partitioning of the oblique Nazca/South America convergence. However, our results show that the level of partitioning is partial in Peru (~25%). Inland the Inca sliver motion appears to be accommodated by complex fault systems and internal deformation within its eastern part. In terms of interseismic coupling (ISC), we demonstrate important variations both along-strike and along-dip. We find that the subduction segments of northern Peru and southern Ecuador (from lat.2ºS to 9ºS) shows in general a low to weak ISC, with possibly shallow partial coupling confined near the trench. Our results therefore explain the absence of large earthquakes in this region and correlate with the occurrence of moderate magnitude tsunami-earthquakes that occurred in the last decades. Contrasting with this behavior, the central Peru segment (lat. 10ºS a 14ºS) shows a high ISC that spatially correlates with the rupture area of past large earthquakes (M>8) and in particular with the Mw~8.8 1746 devastating earthquake. The present-day interseismic moment deficit suggests a recurrence time of 266-347 to reproduce a similar event. In southern Peru, our models show two areas with high ISC near Nazca (lat. 15ºS) and near the boundary with Chile (lat. 18ºS). We also find evidence for ongoing postseismic deformation in the area of the 2001 Mw=8.4 Arequipa earthquake. Finally, we document a Slow Slip Event (SSE) synchronous to seismicity swarms that took place in northern Peru in 2009. This sequence lasted 7 months and released a total moment equivalent to an earthquake of Mw=6.7. We analyze the relationship between seismic and aseismic processes. Finally based on all these results, we propose inferences about the anatomy of the plate interface in terms of its frictional properties at the scale of the Peruvian subduction. In overall, our results contribute to better quantify the hazard posed by subduction and continental earthquakes in Peru. They also shed light on the active tectonics and the long-term deformation of the Peruvian Andes.
Résumé
La zone de subduction entre les plaques Nazca et Amérique du Sud est une des régions les plus actives de notre planète. De grands tremblements de terre et tsunamis associés se produisent de façon récurrente presque tout au long de sa marge. Néanmoins, le segment de subduction au nord du Pérou (de lat.3ºS à 9ºS) est resté le seul segment sismiquement silencieux depuis les premières informations historiques sur les séismes qui remontent au XVème siècle. Avant le travaux présentés dans ce manuscrit, aucune information sur les processus accommodant la convergence de la plaque Nazca vers le continent Sud-Américain n’était disponible le long du segment de 1000km au nord Pérou et sud Equateur. Les techniques de géodésie spatiale, en particulier le GPS/GNSS, nous permettent de quantifier les mouvements à la surface de la plaque supérieure avec une précision millimétrique. Ces mesures, couplées à l'utilisation de modèles élastiques, nous permettent de déterminer le niveau du couplage intersismique le long de l'interface entre les plaques. Le but de ma thèse est d'étudier le cycle sismique et la déformation continentale le long de la zone de subduction du Pérou, avec un intérêt particulier pour son segment nord. Nous utilisons des mesures GPS acquises depuis 2008 dans le cadre d'un projet international (le projet Andes Du Nord, ANR-ADN). Le champ de vitesse GPS obtenu couvre l’ensemble de la marge de subduction péruvienne, avec des mesures dans la cordillère et dans une moindre mesure dans la région sub-Andine. L'analyse et la modélisation du champ de vitesse GPS ont permis d'obtenir les résultats suivants: Premièrement: nous mettons en évidence l'existence d'un nouveau domaine continental, que nous avons baptisé comme le sliver Inca et qui est en translation a une vitesse de 4-5 mm/an en direction sud-est par rapport au craton Sud Américain. Le sliver Inca s’étend tout le long de la marge péruvienne. Le sliver Inca diverge du sliver Nord-Andin en Equateur et en Colombie, contribuant ainsi à l'ouverture du golfe de Guayaquil. Dans sa partie sud, le sliver Inca contribue probablement à maintenir latéralement l'Altiplano. Nous proposons que le processus responsable du mouvement des slivers est le partitionnement de la convergence oblique de la plaque Nazca vers le continent Sud-Américain. Cependant, nos résultats montrent que ce partitionnement est partiel (~25%). A l’intérieur du continent, le mouvement de ces slivers semble être accommodé par des systèmes de failles complexes dans la partie orientale des Andes. En terme de couplage intersismique (ISC) le long de l’interface de subduction, nous démontrons d’importantes variations latérales et en profondeur. Nos résultats indiquent que le segment de subduction du nord du Pérou et du sud de l'Equateur (de lat.2ºS à 9ºS, 1000 km long) sont faiblement couplés, avec éventuellement un couplage partiel superficiel proche de la fosse. Ces résultats expliquent l'absence de grands séismes dans cette région. Au contraire, le segment central du Pérou (lat. 10ºS un 14ºS) montre une fort couplage intersismique qui corrèle avec les zones de rupture des grands séismes (M>8.0) dans du siècle passé. Le déficit actuel de moment intersismique suggère un temps de récurrence de 266 à 347 années pour reproduire un séisme similaire à celui de 1746 (~M8.8). Dans le sud du Pérou, nos modèles montrent deux zones fortement couplées près de Nazca (lat. 15ºS) et près de la frontière avec le Chili (lat. 18ºS). Nous mettons de plus en évidence que le région du séisme du 2001 Mw8.4 2001 d’Arequipa subit actuellement une déformation postsismique significative. Enfin, nous documentons un épisode de glissement transitoire asismique simultané à un essaim de sismicité dans le nord du Pérou en 2009. Cette séquence a duré 7 mois et libéré un moment total équivalent à un séisme de Mw6.7. Nous analysons la relation entre les processus sismiques et asismiques. Enfin sur la base de ces résultats, nous proposons des inférences sur l'anatomie de l'interface de subduction et en particulier de ses propriétés frictionnelles, à l'échelle de la subduction péruvienne. Nos résultats contribuent à quantifier l'aléa associé aux séismes de subduction et continentaux. Ils contribuent aussi à mieux comprendre la tectonique active et la déformation long terme de la Cordillère des Andes.
Resumen
La zona de subducción de Sudamérica es una de las regiones más activas de la Tierra. A lo largo de casi todo este margen ocurren grandes terremotos y tsunamis de manera cíclica. Sin embargo, el segmento de la subducción entre el norte de Perú y sur de Ecuador (from lat.2ºS to 9ºS, de aprox. ~1000 km de largo), ha permanecido relativamente en silencio sísmico desde hace al menos 5 siglos, desde los primeros reportes históricos, sin conocer si en esta región se han producido grandes sismos en el pasado. Hasta antes de los resultados presentados en esta tesis, no existía información disponible acerca de los procesos que acomodan la convergencia de placas en esta región, por lo cual resultaba imposible saber si en el futuro podría ocurrir o no un sismo de gran magnitud Mw>8.5 en dicha región. Las técnicas de geodesia espacial, en particular el GPS/GNSS, permiten cuantificar con precisión milimétrica la deformación de la placa superior en zonas de subducción. Las mediciones geodésicas junto con el uso de modelos de dislocación elástica permiten determinar el grado de acoplamiento intersísmico en la interfaz de placas. Mi tesis tiene por objetivo central estudiar el ciclo sísmico y la deformación continental el la zona de subducción de Perú, con interés particular en la región centro y norte de Perú. Para ello, hago uso de mediciones GPS adquiridas desde el año 2008 en el marco de un proyecto internacional (Andes del Norte, ANR-ADN). El campo de velocidad GPS obtenido cubre todo el margen de subducción de Perú con algunas mediciones en la cordillera de los Andes y parte de la región sub-Andina. El modelamiento del campo de velocidad muestra la existencia de una nueva microplaca a la cual hemos denominado el sliver Inca, que se encuentra en traslación hacia el Sur-Este a una velocidad de 4-5 mm/yr con respecto a la parte estable de Sudamérica. Este sliver abarca todo el margen de subducción peruano desde el sur de Ecuador hasta el norte de Bolivia, incluyendo el margen costero y la cordillera occidental de Perú. Los resultados muestran que el sliver Inca junto con el sliver nor-Andino se encuentran en movimiento divergente, contribuyendo a la apertura del Golfo de Guayaquil. En el extremo sur el sliver Inca posiblemente contribuye a sostenimiento lateral del Altiplano. Proponemos que el principal proceso que induce el movimiento de los slivers a lo largo de toda Sudamérica es el particionamiento de la convergencia oblicua de las placas Nazca/Sudamericana. Sin embargo, nuestros resultados muestran que el particionamiento es solo parcial en el Perú (25%). En el interior del continente el movimiento del sliver Inca parece ser acomodado por complejos sistemas de fallas con deformación activa hacia el Este en la cordillera Oriental y zona sub-Andina. En términos de acoplamiento intersísmico (ISC), nuestros resultados muestran importantes variaciones tanto de manera lateral como en profundidad a lo largo de toda la interfaz. El segmento de subducción del norte de Perú y sur de Ecuador (lat. 2ºS a 9ºS) muestra en general un bajo a débil ISC, con posible acoplamiento parcial confinado en la parte superficial de la zona de contacto (<30km). Estos resultados permiten explicar la ausencia de grandes terremotos en el pasado reciente y se correlacionan con la ocurrencia de eventos tipo tsunami-earthquakes como los ocurridos en las décadas anteriores (i.e 1960 & 1996). La región central de Perú (lat. 10ºS a 14ºS) muestra un alto ISC que se correlaciona espacialmente con las áreas de ruptura de grandes terremotos (M≥8.0) ocurrido en el pasado, en particular con el área de ruptura del devastador terremoto de 1746 (Mw~8.6-8.8). Los cálculos actuales del déficit de momento intersísmico sugieren un tiempo de recurrencia de 266-347 años para reproducir un evento de características similares. En el sur del Perú los modelos muestran dos áreas con alto ISC cerca de la ciudad de Nazca (lat. 15ºS) y cerca a la frontera con Chile (lat. 18ºS). Estas zonas representan son de alto peligro en términos del potencial sísmico. Los resultados también muestran evidencia del efecto post-sísmico del sismo de 2001 (Mw 8.4) aún perdura. Finalmente, es esta tesis se documenta un sismo lento (Slow Slip Event) sincronizado con una secuencia de sismicidad en el año 2009. Esta secuencia duró 7 meses y liberó un momento equivalente a un sismo de Mw=6.7. Estudiamos la evolución espacio temporal de la secuencia y analizamos la relación entre los procesos sísmicos y asísmicos. Finalmente, en base a todos estos resultados obtenidos en esta tesis planteamos inferencias sobre la anatomía de la interfaz de placas en términos de las propiedades friccionales a escala de toda la zona de subducción de Perú. Los resultados obtenidos en esta tesis contribuyen en general, a cuantificar mejor el riesgo tanto en la zona de subducción como en el interior del continente, además que permiten comprender mejor los procesos de la tectónica activa así como la deformación de los Andes Peruanos.
Remerciements
Cette thèse a été réalisée avec le soutien de l’Institut de Recherche pour le Développement (IRD-DSF), le projet ANR-ADN (Andes du Nord), le laboratoire Géoazur UMR7329 UR082 et l’Instituto Geofísico del Perú (IGP).
Je tiens tout d’abord à remercier mon directeur et co-directeur de thèse, Jean-Mathieu Nocquet et Mohamed Chlieh. Ce fut un grand privilège d'avoir travaillé sous leurs encadrements. Je les remercie de m’avoir transmis de leur expérience, esprit de synthèse, et recul sur les résultats obtenus. Enfin je les remercie pour leurs conseils et encouragement. J’adresse mes remerciements aux membres du jury qui ont accepté de prendre de leur temps pour évaluer ce travail: Pr. Christophe Vigny et Dr. Laurence Audin d’avoir accepté d’être rapporteurs, Pr. Betrand Delouis et Dr. Anne Socquet d’avoir accepté d’être examinateurs. Je tiens à remercier Pr. Emmanuel Tric, directeur du laboratoire Géoazur, pour m’avoir accueilli au sein du laboratoire, ainsi que Jenny Trevisan directrice adjointe, ainsi que l’ensemble de l’équipe administrative, informatique et bibliothèque pour leur aide précieuse. Je remercie l’Instituto Geofísico del Perú et plus particulièrement son Président, ses directeurs et chefs d’équipes: Pr. Dr. R. Woodman, Dr. J. Macharé, Dr. H. Tavera, Dr. J. Chau et Dr. E. Norabuena, pour leur confiance, conseils et les facilites pour mener cette thèse à son terme. Je tiens à remercier la représentation de l’ IRD de Lima, ses directeurs G. Hérail et J. L. Guyot, ainsi que toute l’équipe administrative, notamment L. Lalonde, M. Soto, et A. Corde pour leur aide précieuse.
J’adresse aussi mon remerciement aux chercheurs de Géoazur et de l’IRD en particulier: O. Cavalier, A. Sladen, J. Salichon, L. Rolland, M. Vergnolle, F. Courboulex, T. Monfret, B. Delouis, G. Nolet, P. Charvis, T. Sempere, et P. Baby avec qui j’ai pu discuter et échanger. Un grand merci à F. Rolandone de l’ISTeP et M. Vallée de l’IPGP pour les discussions et ses conseils. Je remercie aussi les membres des équipes ‘Failles’ et ‘Astrogeo’ de Géoazur pour m’avoir accueilli en leur sein.
Un grand merci aux ingénieurs et techniciens avec qui j’ai eu l’opportunité de faire des missions de terrain et voyager a travers le Pérou pour installer et mesurer des stations GPS. Un grand Merci à toi Francis, Xavier, José, Jimmy, Gudner, Manuel et autres. Merci également aux institutions, autorités et personnes des différentes villes et pueblitos qui nous ont aidé ces six dernières années.
A tous le thésards, collègues et amis avec qui j’ai partagée des agréables moments, pendants mes séjours à Nice et Lima: Amina, Clarita, Marianne, Flore, Luisa, Elodie, Huyen, Zahida, Imane, Yevgeniya, Nestor, Tran, Dung, Benoit, Swann, Alain, Vincent, Clément, Eddy, Pedro, Quentin, Sadrac, Battulga, Aurélien, Kuan-Chuan, Jérémi, Maurin, Liliana, Isabel, Marita Cristobal, Christian, Rocio et John. Un grand merci à mon ami David Cisneros de l’IGM Equateur ainsi que Paul Jarrin, Patty Mothes Victor Naya de l’IG-EPN.
Enfin, je remercie a ma famille pour leur soutien constant et pour partager mes espoirs, je pense à mes parents Serapio y Grimalda et mes frères Lincoln, Tonny, Jésus y Jimmy. A Sheilita pour son amour et sa patience.
GRACIAS !!! Juan Carlos Villegas Lanza
A mis Padres y Hermanos.
Contents
Abstract ... i Résumé ... III Resumen ... V Remerciements ... vii Contents ... XI CHAPTER 1 ... 1 1. INTRODUCTION ... 1 2. EARTHQUAKE CYCLE ... 3 2.1. The birth of the concept of the earthquake cycle ... 3 2.2. Earthquake cycle in subduction zone ... 4 2.2.1. Phases of the earthquake cycle ... 4 2.2.1.1 The interseismic phase ... 5 2.2.1.2. The coseismic phase ... 5 2.2.2. Transient phases of the earthquake cycle ... 8 2.2.2.1. Postseismic deformation ... 8 2.2.2.2. Slow Slip Events (SSE) ... 9 2.3. Nature of the subduction interface ... 113. THE SUBDUCTION ZONE IN PERU ... 12
3.1. Geological context of the Peruvian subduction zone ... 12 3.1.1 The Trench and Coastal zone ... 13 3.1.2. The Occidental Cordillera ... 14 3.1.3. The Altiplano ... 14 3.1.4. The Oriental Cordillera ... 14 3.1.5. The Sub‐Andean Fold and Thrust Belt ... 15 3.2. Overall characteristics of large earthquakes along the Peruvian subduction zone ... 16 3.3. Further research of historical earthquakes in northern and central Peru ... 18
4. PREVIOUS STUDIES USING SPACE GEODESY (GPS) IN THE PERUVIAN SUBDUCTION ... 21
5. MAIN QUESTIONS ADDRESSED IN THIS THESIS ... 24 6. OUTLINE OF THIS THESIS ... 27 CHAPTER 2 ... 29 MOTION OF CONTINENTAL SLIVERS AND CREEPING SUBDUCTION IN THE NORTHERN ANDES ... 29 SUPPLEMENTARY INFORMATION ... 35 GPS Data Set ... 36 GPS Data Analysis ... 36 Euler Pole Estimation for the Inca Sliver ... 38 Euler Pole Estimation for the North Andean Sliver ... 39 Subduction Earthquake Slip Vectors and Partitioning of oblique Nazca/South America Convergence ... 40 Inversion of Interseismic Coupling ... 42 Supplementary References ... 47 CHAPTER 3 ... 48
PRESENT‐DAY DEFORMATION OF THE PERUVIAN MARGIN FROM 2008‐2013 GPS MEASUREMENTS: THE INCA SLIVER KINEMATICS AND INTERSEISMIC COUPLING ALONG THE MEGATHRUST ... 48
Abstract ... 49
1. Introduction ... 50
2. Historical seismicity and Seismotectonic setting ... 53
2.2 Geological structures on the Nazca plate ... 56 2.3 Active faults inland Peru ... 56 3. GPS Datasets and processing ... 58 3.1 Datasets and Analysis strategy ... 58 3.2 Definition of the Stable South America reference frame ... 59 4. Main patterns of the GPS velocity field ... 60 5. Interseismic models ... 62 5.1 Finite fault approach ... 63 5.2 Forward uniformly locked fault zone models ... 63 5.3 Inversion procedure for spatially variable interseismic coupling ... 65 5.4 Evidence for internal deformation within the Inca sliver ... 66 6. Inversion of the interseismic coupling ... 69 6.1 Inversion Results ... 69 6.2. Along‐strike variations of the rate of moment deficit ... 72 7. Discussion ... 74 7.1. Continental deformation: motion and deformation of the Inca sliver ... 74 7.2 Interseismic Coupling along the Peruvian subduction zone ... 78 7.2.1 Weak coupling in northern Peru ... 78 7.2.2 High coupling in the central Peru segment ... 78 7.2.3 Highly heterogeneous coupling and evidence for ongoing post‐seismic deformation along the southern Peru segment ... 79 7.3 Factors controlling the interseismic coupling ... 82 7.3.1. Thermal Modeling ... 82 7.3.2. Forearc structure ... 84 7.3.3 Seismic segmentation controlled by oceanic structures ... 85 8. Conclusions ... 85 Acknowledgements ... 88 References ... 90 SUPPLEMENTAL MATERIAL: ... 96 1. GPS Dataset ... 96 2. Definition of the Stable South America reference frame ... 101 3. Inca Sliver pole determination directly from GPS observations ... 103 4. Inca Sliver pole determined from the misfits between the data and modeled displacements (former 2‐plates inversion) ... 105 5. Earth Structure Model ... 106 6. Determination of the best Euler pole for the eastern Inca sliver ... 106 7. Comparison of the location and prediction of the Euler Poles ... 108 8. Subduction earthquake Slip vectors and partitioning of the Nazca ‐ South America convergence ... 109 9. Spatial resolution of the formal inversion ... 112 10. Misfit of the GPS data as function of the smoothing factor used in our inversion ... 114 11. Trade‐off between the Inca Sliver kinematic and the interseismic coupling ... 114 12. Misfit of data as a function of the final moment deficit rate ... 115 13. Large differences with previous geodetic solutions in central Andes ... 116 14. Thermal model parameters ... 117 15. Simple forward models ... 118 16. Cumulative deficit of moment and seismic moment released due to major subduction earthquakes ... 121 17. Correlation of the age of the Nazca oceanic lithosphere and the ISC in Peru ... 121 References ... 122 CHAPTER 4 ... 124
ANATOMY OF A SEISMIC SWARM SYNCHRONOUS TO SLOW ASEISMIC SLIP: THE NORTHERN PERU 2009 SEQUENCE ... 124 Figures ... 130 References ... 133 Acknowledgments: ... 134 SUPPLEMENTARY INFORMATION ... 135 GPS analysis and aseismic slip inversion ... 135 Relocation of the seismicity ... 138 Source time function ... 140
References ... 142
CHAPTER 5: CONCLUSIONS AND PERSPECTIVES ... 144
1. CONTINENTAL DEFORMATION: THE INCA SLIVER AND THE OBLIQUE CONVERGENCE PARTITIONING ... 145
2. INTERSEISMIC COUPLING (ISC) ALONG THE MEGATHRUST OF PERU ... 147
3. PECULIAR SLOW SLIP EVENTS AND SEISMIC SWARM IN A WEAKLY COUPLED SUBDUCTION ZONE ... 149
4. ANATOMY OF THE SUBDUCTION PLATE INTERFACE ... 150
List of figures ... 151
List of tables ... 156
Chapter 1
1. Introduction
Subduction zones are converging plate boundaries where an oceanic plate moves beneath another and sinks into the mantle. The subduction process gives raise to the most active and dynamic phenomena on the Earth’s surface, including crustal deformation, earthquakes, tsunamis, volcanism, mountain building, among others. My thesis focuses on the surface deformations associated with the subduction zone in Peru and its relation with the processes leading to continental deformation and the occurrence of large subduction earthquakes.
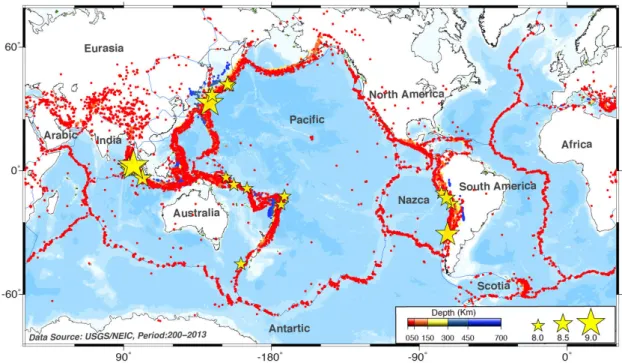
The largest earthquakes recorded on Earth usually happen at subduction zones. Among the 19 largest earthquakes (M>8.5) recorded by seismometers since 1900. 17 occurred at subduction megathrust (Figure 1.1). Indeed, only during the last decade 6 great subduction earthquakes occurred and were followed by large tsunamis leading to dramatic consequences for human societies. For the two most devastating events, the 2004 Sumatra-Andaman Islands (Mw 9.2) and the Tohoku-Oki 2011 Japan (Mw 9.0), the seismic potential had not been correctly assessed prior to their occurrence, because several assumptions were incorrect [Stein et al., 2012]. First, because of a correlation found between the age of subducting ocean floor and convergence rate with the occurrence of past M>8.5 earthquakes, it was thought that the old oceanic subduction in Sumatra and Japan would not be able to generate M~9 earthquakes [Ruff and Kanamori, 1980]. Second, seismic hazard assessment in Japan relied on the earthquake catalog spanning roughly 4 centuries, which was thought to be all-inclusive of earthquake types along the Honshu subduction zone. Finally, the large amount of slip along the shallowest part of the plate interface that lead to the generation of the huge tsunami challenged the view that significant stress could not accumulate in the shallowest portion of the subduction interface.
Currently, several hundreds of million of people live under the direct threat of large earthquakes and potentially associated tsunamis all along coastal regions of the
circum-Pacific subduction. According to official estimates more than a third of the world population will be living in seismically active areas by 2040 [UNAVCO Science
Report, 1994; United Nations, 2004]. It is therefore essential and urgent to better
understand the processes and parameters controlling the occurrence of great subduction earthquakes to identify which areas are prone to produce them and provide reliable assessment of their location and potential size.
Figure 1.1: Global distribution of earthquakes for the period 2000–2013 of magnitudes M≥5.0 extracted from the NEIC catalog (http://earthquake.usgs.gov/earthquakes). Earthquakes are represented by dots and plotted in function of depth according to the color bar. Shallow events (<50km) delineate the plate boundaries. During this period up to 17 events of M>8.0 occurred in various subduction zones. The scaled stars indicate their location and magnitude.
In the following paragraphs, I present the main concepts of the earthquake cycle in subduction zones, describing the principal phases of the cycle with its associated crustal deformation. I briefly present recent discoveries of transient slip events that add-up more insights to the complexities of the seismic cycle. Then, I introduce the main aspects of the geological and seismotectonic setting of the Peruvian subduction zone and present a state of the art of previous geodetic studies carried out in Peru. Finally, I state the main questions that this thesis tries to answer and present the contents of this manuscript.
2. Earthquake cycle
2.1. The birth of the concept of the earthquake cycle
Probably the first observations that describes and quantifies the characteristics and effects of a great subduction earthquake and tsunami relating them to a cyclic
behavior were done by Charles Darwin during the Voyage of the Beagle (1831 - 1836).
During that expedition, in 1835 he was onshore near Valdivia in Chile, when a great earthquake occurred near the Concepcion city (~300 km to the north). Darwin’s
description indicates that the shaking lasted about 2 minutes with a trend motion in an
eastward direction. He also found that rocks lined with recent marine shells were elevated above the tide after the earthquake. Uplifts measurements along the coast were of ~1 m with a maximum of ~3 m at the Santa Maria island [Darwin et al., 1846]. During expedition into the pre-Cordillera he discovered a series of remaining marine shells at 2000 m of altitude, proof that the shifting that had uplifted the coast during the earthquake may have occurred over and over to bring shells to that altitude. The eyewitness testimony of Darwin suggested that the Andes of South America were very slowly rising and its growth was linked to the earthquakes occurrence.
We know today that earthquakes result of a sudden slip at the interface of two plates boundary moving relatively one to each other in the long term. In the simplest concept of the seismic cycle, a fault remains locked and accumulates stress during the interseismic period, which is totally or partially released by seismic slip. In this view, the amount of seismic slip equals the cumulated plate convergence of the plates during the interseismic period. This concept known as the elastic rebound model was introduced by Reid, [1910] after the M7.8 San Francisco 1906 earthquake that ruptured a segment of the San Andreas Fault (Figure 2). He hypothesized that the Earth’s crust behaves like an elastic solid driven by forces at a constant rate, rupturing in earthquakes at periodic intervals. Under this concept, if the date of the last great earthquake is known, using the rate of relative motion determined by geodesy, it is possible then to make some prediction about the slip deficit to be caught up in the next earthquake.
Figure 1.2: Left: Schematic representation of the elastic rebound model after Reid, [1910]. Right: picture showing a fence that was offset due to the fault slip during 1906 San Francisco earthquake. USGS image: (http://earthquake.usgs.gov/regional/nca/1906/18april/reid.php).
Reid went a step further. He also showed that the static displacement observed after the San Francisco 1906 earthquake followed the prediction of a rupture dislocation in an elastic medium. Since the sum of the interseismic and co-seismic slip should be equal to the long-term relative displacement of plates, the interseismic strain should reflect the stress accumulation along the fault. During the interseismic period, the ground deforms smoothly in a manner that depends on the relative plate velocities, the elastic plate rigidity and the thickness of the elastic plate. The size of an earthquake on a fault would depend on the length and depth of the locked fault zone, and the recurrence time suspected on that fault would depend on how much strain had built up since the last one.
2.2. Earthquake cycle in subduction zone
2.2.1. Phases of the earthquake cycle
The concept of the earthquake cycle was initially applied for the case of continental faults (i.e. strike-slip type), and then adapted to the subduction zone context. Fedotov, [1967] introduced the ‘seismic cycle’ expression to describe the
cycle of elastic deformation during and between large (Mw>8.0) megathrust earthquakes. In this model, the seismic cycle was characterized by two principal phases of deformation: A permanent interseismic phase and a transient coseismic phase
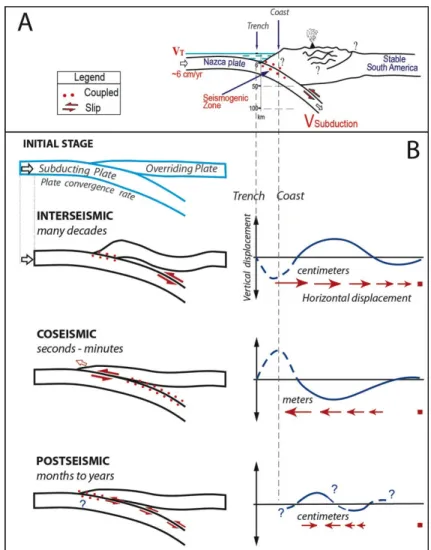
2.2.1.1 The interseismic phase
This phase corresponds to the period where seismic asperities on the megathrust are locked during decades to hundreds of years. The plate convergence induces a slip deficit in the locked fault zone that accumulates stress on the plate interface and deforms the overriding plate. The horizontal surface deformation is characterized by GPS gradients of the order of mm/yr to cm/yr, which decrease as the distance from the trench increases. The vertical deformation pattern is characterized by a subsiding area linked to the updip limit of the locked fault zone followed by an uplifted area linked to the downdip limit of the locked fault zone (Figure 1.3B). The width of the locked fault zone controls the wavelengths and the level of locking controls the amplitudes of the displacements.
2.2.1.2. The coseismic phase
The coseismic phase corresponds to the seismic rupture when sudden slip occur on the megathrust interface. The moment deficit accumulated during the interseismic phase was supposed in the first models to be totally released during the tens of second to minutes of rupture. For large earthquake in 0-50km depths, the surface displacements are typically of the order of decimeters to meters. The pattern of deformation observed during this phase is opposite in sign of the pattern observed during the interseismic period.
This is only later, that a third major phase of the seismic cycle called the postseismic period has been introduced to explain the relaxation processes that follow large earthquakes [Brown et al., 1977; Bürgmann et al., 1997; Heki et al., 1997]. Each phase of the seismic cycle is well characterized by a specific signature of the Earth crust deformation with amplitudes and wavelengths varying in order of magnitude.
Figure 1.3 shows a simplified schematic representation of the three main phases of the seismic cycle together with the associated predicted horizontal and vertical displacements produced with forward elastic dislocation models.
Figure 1.3: A: Schematic cross-section of the South American subduction zone. B: Schema showing the main phases of the seismic cycle and its associated horizontal (red arrows) and vertical patterns of deformation (blue line). We consider a stable South America reference frame.
Using an elastic rheology for the earth Lithosphere, we can relate the locking at a specific elementary fault with respect to the displacement components at any site on the surface. A widely used approach to mimic the inter-seismic behavior of a locked fault segment is the back-slip model introduced by Savage, [1983]. In this model, the interseismic pattern of deformation is the sum of two terms, the first being a rigid plate motion where an oceanic plate subducts beneath the overriding plate at a fixed
region supposed to be locked (Figure 1.4). The back-slip rate equals the plate convergence rate when it is fully locked but can be a fraction of it for partial locking. Using the analytical equations of Okada that link the 3D surface displacements with elementary source points embedded in an elastic half-space, we can retrieve the characteristics of the source from surface displacement measurements [Okada, 1985, 1992].
Figure 1.4: Schematic representation of the back-slip model showing the superposition of a stable steady state at plate convergence rate and a supplemental solution that is slip normal to the plate convergence at the same rate, resulting in locking and strain accumulation at the subduction interface during the interseismic period. Gray areas correspond to the tectonic plates and colored area to the asthenosphere. Figure modified after Savage, [1983].
Dislocations solutions, either analytical for a semi-infinite homogeneous elastic half-space or numeric for an heterogeneous elastic half-space, can then be used to predict the 3-D displacement at GPS sites. An inverse problem, relating the GPS displacement to the amount of normal slip at each elementary sub-fault of the interface can then be setup to derive a model of the back-slip rate. The ratio of the back-slip rate divided by the plate convergence defines the interseismic coupling coefficient.
2.2.2. Transient phases of the earthquake cycle
Numerous transient deformations have been observed during the seismic cycle. After large earthquakes, a postseismic deformation takes place in the form of rapid afterslip at the plate interface that generate aftershocks and visco-elastic relaxation of the Lithosphere that can spend decades for the greater Mw9-type earthquakes. Similarly, slow slip events lasting from days to several years and releasing energy comparable to moderate magnitude earthquakes are reported frequently since the
beginning of the XXIth century in most subduction zones.
2.2.2.1. Postseismic deformation
The postseismic deformation refers to the deformation that occurs in the months to decades after an earthquake (Figure 1.5), and is attributed to three different processes: i) Afterslip, that is the frictional response of the plate interface propagating around the rupture area stressed by the coseismic slip; this process is usually thought to occur during the first stage of the post-seismic phase (days to years). ii)
Viscoelastic relaxation, which is the viscous response of the upper mantle and lower
crust to the rapid stress increment induced by the coseismic rupture; this process can last up to more than 50 decades as observed for the 1960 M9.5 Chile earthquake [Wang et al., 2012]. iii) Poro-elastic effect, that is deformation induced by fluids flow in response to the coseismic stress change [Jonsson et al., 2003]. The slip during this period can release as much moment as the earthquake itself [Bürgmann et al., 2001]. Permanent measurements of the postseismic deformation help to constraint the principal characteristics of the frictional parameters of the plate interface and the rheology of the surrounding medium [Perfettini and Avouac, 2004; Perfettini et al., 2010].
Figure 1.5: Displacement in a N55ºE direction of the GPS station AREQ showing the displacement associated with the 2001 Mw=8.4 Arequipa earthquake. The tree main phases of the seismic cycle are evidenced here (Figure adapted after [Perfettini et al., 2005]).
2.2.2.2. Slow Slip Events (SSE)
Slow Slip Events (called also silent or slow earthquakes) are slip episodes that occur during the interseismic period and are characterized by long-lasting slips with duration typically ranging from days to years (Figure 1.6). Slip occurs without radiating detectable seismic energy and induces surface displacements of several millimeters to centimeters [Schwartz and Rokosky, 2007]. This type of events has started to be detected since the deployment of continuous GPS networks in subduction zones, principally in Cascadia and Japan, where they are observed to occur in the downdip portion of the seismogenic zone [Dragert et al., 2001; Ozawa et
al., 2001]. The progressive deployment of GPS together with sensitive seismic
networks in various subduction zones has evidenced that SSE would be a common process including a series of episodic transient. Some slip events are synchronous to tremor or low frequency earthquakes emitting low seismic radiation [Ide et al., 2007;
Peng and Gomberg, 2010]. Recent observations of SSE suggest that these events can
also occur in the shallow part of the of the seismogenic zone [Walter et al., 2011]. The modeled sources are consistent with slip on the plate interface, accommodating the relative plate motion and contributing to release the accrued stresses. The geodetic moment released by SSEs is equivalent to earthquakes of magnitude from ~6.0 to 7.6
Mw, as the observed in Cascadia, Japan, New Zealand, Ecuador and Mexico [Dragert
et al., 2001; Douglas et al., 2005; Vallée et al., 2013].
Figure 1.6: GPS time series showing Slow Slip Events recorded in different subduction zones of the world. One of the most classical examples of SSE occur in Cascadia where they use to last several weeks and recur with a periodicity of around 14 months, releasing stress equivalent to Mw=6.7 earthquakes [Dragert et al., 2001]. In Mexico in 2006 occurred the largest SSE recorded so far, it was equivalent to an earthquake Mw=7.6Mw [Radiguet et al., 2012]. Similarly, SSEs reported in Japan and New Zealand last various months to years and as the previous regions they occur in the downdip of the seismogenic zone [Obara, 2002;
Douglas et al., 2005]. A different type of SSEs occurring in the shallow portion of the
seismogenic zone are characterized by short durations and associated microseismicity. This new type of events have been documented in the Northern Hikurangui [Wallace and Beavan, 2010], the Boso Peninsula and recently in Ecuador [Vallée et al., 2013].
Another type of transient deformation, termed as Preseismic deformation, has also been reported in few particular cases during the weeks to days before large earthquakes [Ruegg et al., 2001; Melbourne and Webb, 2002; Ruiz et al., 2014]. This deformation is believed to act as an acceleration of the slip in the bounds of the locked fault portion. This process is sometimes associated to an increase in the rate of seismicity (Figure 1.5).
All these features add more complexities to the anatomy of the subduction interface and the mode of stress accumulation and release that vary in space and time, thus a diversity of deformation processes are expected during the earthquake cycle.
2.3. Nature of the subduction interface
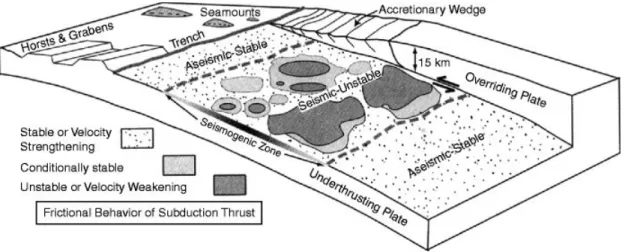
The seismogenic zone is the portion of the plate interface where earthquakes nucleate via stick-slip sliding [Brace and Byerlee, 1966]. A current view, is that the anatomy of the plate interface is made of an inter-fingering of areas that are locked accumulating stress and strain during the interseismic period –named asperities- that will rupture during an earthquake. They are surrounded by areas that are partially or weakly locked, that either could facilitate post-seismic slip and/or either arrest the coseismic rupture, those areas that arrest laterally the rupture are named barriers [Schwartz and Rokosky, 2007; Kaneko et al., 2010]. According to the frictional properties of the materials the asperities that undergo unstable regime are characterized by a velocity weakening behavior, while weakly locked areas and barriers that undergo conditionally stable and stable regime are characterized by a velocity strengthening behavior [Scholz, 1998] (Figure 1.7).
Figure 1.7: Simplified illustration of the subduction interface environment showing the heterogeneous distribution of asperities (velocity weakening material) surrounded by areas that undergo a conditionally stable regime both embedded in a stable or velocity strengthening material. Figure from: Bilek, [2010] and Hasegawa, [2014].
3. The Subduction zone in Peru
Along the Colombia-Ecuador-Peru-Chile trench the oceanic Nazca plate subducts beneath the South American continent at a rate of 5.3 cm/yr in Colombia (lat. 6ºN) increasing gradually southward up to 6.3 cm/yr in south central Chile (lat. 30ºS) in a N78ºE average direction [Kendrick et al., 2003]. The South America subduction zone is one of the most seismically active areas in the world. This rapid convergence has generated three among the seven greatest subduction earthquakes (M≥8.8) ever recorded (Colombia-Ecuador 1906, Chile 1960 and 2010) and almost its entire length has ruptured through several large (M≥8.0) earthquakes [Bilek, 2010]. The Peruvian subduction zone, where I focus my study, is located in the central part of the Andean subduction (from 3ºS to 19ºS), extending over ~2300 km long that constitutes about a third of the total length of the Nazca/South America subduction. In the next paragraphs I present a brief description of the geological and seismotectonic context of the Peruvian subduction margin.
3.1. Geological context of the Peruvian subduction zone
The subduction in Peru is believed to have been ongoing since the early Jurassic (~200Ma) [Mégard, 1978]. The current tectonic configuration of the Andes is attributed to compressional and transpressional episodes during the Cenozoic
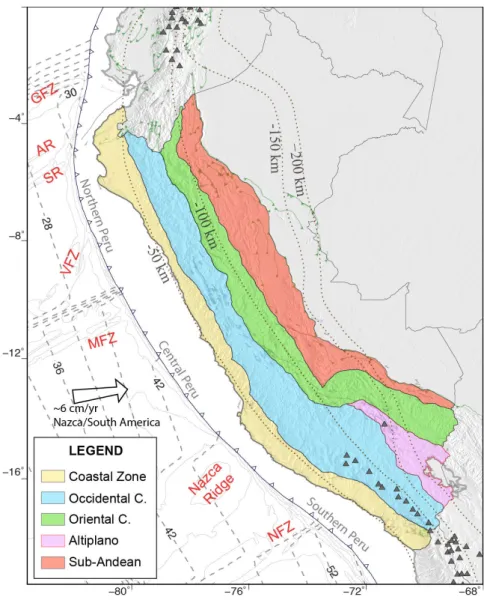
evolution of the plate boundary. The main tectonic characteristics vary both parallel and perpendicular to the strike of the trench (Figure 1.8).
Among the along-strike variations, there are remarkable bathymetric features on the subducting Nazca plate entering the trench that are believed to play a role in the segmentation and seismotectonics of the Peruvian subduction margin. From north to south these structures are: the Grijalva (GR), Alvarado (AR), and Sarmiento (SR) ridges, the Virú (VFZ) and Mendaña fracture zones (MFZ), the Nazca ridge (NR), and the Nazca fracture zone (NFZ). At the trench, the age of the oceanic plate increases gradually from ~30 Myr (Oligocene-age) in front of the Gulf of Guayaquil, to 54 Myr (Eocene-age) offshore the Arica bend. The MFZ, NR and NFZ correlate with rapid positive changes in the age of the plate (Figure 1.5).
The presence of these structures together with the occurrence of large earthquakes led authors to divide the Peruvian subduction zone into three segments: the north, the central and the south segments, being the MFZ (Lat. 9ºS) and the NR (Lat. 14ºS) the structures delimiting the central segment from the north and south segments [Kelleher, 1972; Beck and Ruff, 1989; Dorbath et al., 1990]. Moreover, seismological studies have evidenced two distinct modes of subduction in Peru. In the southern segment (south of 15ºS) the slab is steeply dipping with an angle 20-30º diving into the mantle, while in central and northern Peru the slab dips gently with an angle of 10º to 20º up to a depth of about 100 km where it becomes flat over an extension of about 300 km width and 1500 km along-strike long [Barazangi and
Isacks, 1976; Cahill and Isacks, 1992]. Active volcanism is only present in southern
Peru where steeply dipping subduction exits.
Perpendicular to the strike of the trench the structural style of the Andean subduction margin is characterized by five main tectonic regions [Dalmayrac, 1978]
3.1.1 The Trench and Coastal zone
This zone extends from the trench up to the western boundary of the Andean Cordillera. This region is the primary target to study most of the processes related to the plate convergence (interplate coupling, deformation of the overriding plate, seismic and aseismic slip, etc.). The offshore portion shows lower rates of sediment
deposition, and a small or restricted presence of the accretionary prism [von Huene
and Lallemand, 1990; Krabbenhöft et al., 2004; Heuret et al., 2012]. The onshore
portion in northern Peru consists of gently folded Mesozoic volcanic and sedimentary rocks [Suarez et al., 1983; Megard, 1984], in central and southern Peru the intense deformation lead to outcrops of strongly folded crystalline basement and extensional and compressional faulting around the Altiplano [Megard, 1984; Machare and
Ortlieb, 1992; Sempere et al., 2004].
3.1.2. The Occidental Cordillera
It is a high mountain range of about 150km width and elevations from 3500 to 5000 m being bounded by trench-coastal zone and the Altiplano. This region is dominated by the coastal batholith consisting in multiple intrusions, although intense volcanism since the late Eocene masks part of the central and the southern region. The older units show effects of compressive deformation presumably occurred during the late Eocene to Miocene [Mégard, 1978; Wipf, 2006].
3.1.3. The Altiplano
It is a high plateau at a mean elevation of 4000 m and a maximum width of 450 km that is bounded by the oriental and occidental cordilleras. It is composed of thick deposits of Paleozoic and Mesozoic marine and continental sedimentary rocks that were compressed and folded during the early Cenozoic [Mégard, 1978]. In Peru, there is evidence for quaternary normal and strike-slip faulting over the last 1 Myr but with negligible submetric displacements [Suarez et al., 1983].
3.1.4. The Oriental Cordillera
It is a mountain range that reaches elevations of ~4000 m and a width that increases from north to south from ~100 to 150 km width. It is composed of crystalline and plutonic rocks overlain by Paleozoic shallow marine and continental deposits [Dalmayrac, 1978]. The main structures in the region include open folds and
edge is predominantly thrust with components of strike slip and normal faulting [Suarez et al., 1983; Barke and Lamb, 2006].
3.1.5. The Sub-Andean Fold and Thrust Belt
This is the region of present day most active deformation occurring in the Andes. It is characterized by active thin-skinned thrusting since at least the Pleistocene [Mégard, 1978; Suarez et al., 1983]. Focal mechanisms analysis of recent shallow crustal earthquakes (< 60 km) in this region are consistent with thrust faults steeply dipping (30-60º) to the west becoming shallower toward the south [Suarez et
al., 1983; Devlin et al., 2012]. Post-Oligocene crustal shortening is probably the
dominant process for thickening the Andean crust, although shortening has migrated Eastward with time from the Altiplano in the Miocene to its present position to the East in the Sub-Andean zone [Suarez et al., 1983; Isacks, 1988].
Geologic shortening rates averaged over the past 10 Ma to present in the Andes exceed 10 mm/yr, contrasting with the shortening estimated from GPS 5-10 mm/yr [Norabuena et al., 1998; Bevis et al., 2001; Brooks et al., 2011; Chlieh et al., 2011], and shortening rates estimated from the seismic energy released by major crustal earthquakes range between 2 to 3.8 mm/yr [Suarez et al., 1983; Dorbath et al., 1991].
Recent compilations of quaternary faults [Macharé et al., 2003; Veloza et al., 2011, and http://neotec-opendata.com] evidence reverse active faulting all along the sub-andean domain through thrust and folds belts, while within the Andes the deformation shows a complex pattern with reverse, normal and strike-slip faults.
Figure 1.8: Main elements of the geotectonic context of the Peruvian subduction zone. The structures on the Nazca plate subducting into the trench are: the Grijalva Fracture Zone (GFZ), the Alvarado (AR) and Sarmiento ridges (SR), the Virú (VFZ) and Mendaña Fracture Zones (MFZ), the Nazca Ridge (NR) and the Nazca Fracture Zone (NFZ). The NR and the MFZ delimit the central subduction segment from the north and south segments, respectively. Dashed lines represent the 2-Ma contours of the age of the oceanic Nazca plate and dotted lines represent 50-km iso-surface contours of the subducting slab from the Nazca plate [Hayes et al., 2012]. Triangles denote Holocene volcanic centers. Modified from Dalmayrac, [1978; and Carlotto et al., [2009].
3.2. Overall characteristics of large earthquakes along the Peruvian
subduction zone
The historical earthquake catalogs for Peru date back to the 16th century, since the Spanish conquest, and they are based on reports, narrations and chronicles from civil and ecclesiastic authorities [Silgado, 1978]. The compilation of historical large
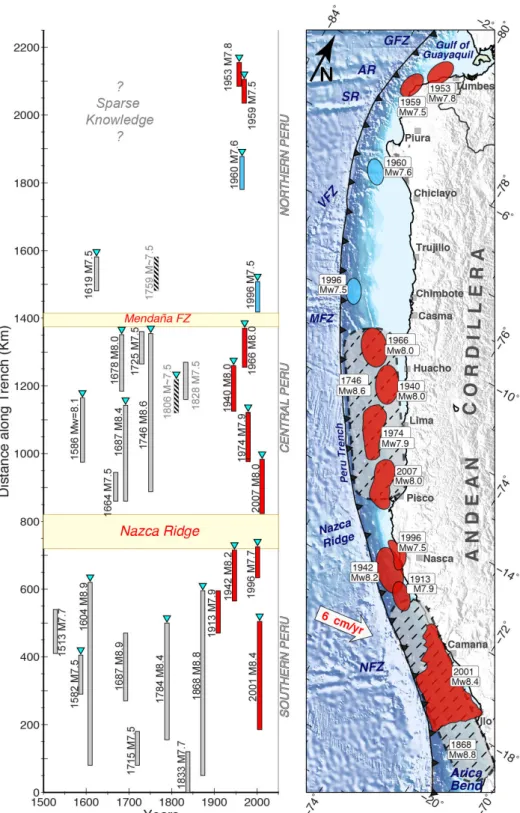
south to north [Dorbath et al., 1990]. While in the southern and central Peru segments large earthquakes (M≥8) occurred with a recurrence interval of ~100 to 250 years, the northern segment shows a sparse and rare occurrence of lower to moderate (M≤~7.5) magnitude events [Kelleher, 1972; Beck and Ruff, 1989; Dorbath et al., 1990;
Nishenko, 1991; Bilek, 2010]. According to chronicles the largest events ever known
in Peru occurred in 1746 in the central segment and in 1604, 1868 in the southern segment. These events generated devastating tsunamis, whose magnitude were used to infer moment magnitudes of 8.6, 8.7 and 8.8, respectively [Dorbath et al., 1990]. For northern Peru, chronicles only report a moderate event that occurred in 1619 near Trujillo (estimated in 7.7Mw) and another moderate event occurred in 1912 near Piura though their attribution to interplate events remained uncertain [Dorbath et al., 1990] (Figure 1.9).
Instrumental records of large subduction earthquakes in Peru started with the 1913 (7.8M) earthquake in the southern segment (~17ºS, near Nazca). This event was preceded by a foreshock of M~7.0 nine days before [Abe and Noguchi, 1983]. Three larger earthquakes within this segment occurred in 1942 (~8.0M) and 1996 (7.6Mw) near Nazca, and 2001 (8.4Mw) near Arequipa [Swenson and Beck, 1999; Salichon et
al., 2003; Pritchard et al., 2007; Chlieh et al., 2011], rupturing almost the entire
segment except by a remaining length of 150–200 km of the southernmost rupture area of the 1868 (8.8 Mw) earthquake (Figure 1.9). In the central Peru segment a sequence of four large earthquakes occurred in 1940 (8.0Mw) near Huacho, 1966 (8.0Mw) Casma, 1974 (7.9Mw) Lima, and 2007 (8.0Mw) Pisco [Beck and Ruff, 1989;
Sladen et al., 2010], rupturing almost the entire central segment, although their
magnitudes only represent a fraction of the seismic moment released by the 1746 ~8.6Mw) [Beck and Nishenko, 1990; Chlieh et al., 2011]. In the northern Peru segment the records of large earthquakes only show moderate magnitude earthquakes, confirming the particular behavior seen during the historical period. These events occurred near Tumbes in 1953 (7.8Mw) and 1959 (7.5Mw), Piura 1960 (7.6Mw) and Chimbote 1996 (7.5Mw) [Pelayo and Wiens, 1990; Ihmle et al., 1998; Bourgeois et
al., 1999]. The two latter, due to their slow rupture velocity, long source time duration
and tsunamis significantly greater than expected, were categorized as tsunami-earthquake type events.
3.3. Further research of historical earthquakes in northern and
central Peru
It appeared useful to further investigate the earthquake history of Peru, especially of its northern segment. I noticed that recent compilations of subduction thrust or tsunamigenic earthquakes [Dorbath et al., 1990; Bilek, 2010] do not include the 1953 (7.8M) and 1959 (7.5M) events of northern Peru. However we notice that tsunami catalogs report local tsunamis for these events with runup > 1 m near Tumbes and southern Ecuador (Lat. 3°S - 4°S) [NGDC http://www.ngdc.noaa.gov, n.d.;
Soloviev and Go, 1975; Lockridge, 1985; Espinoza, 1992]. Tsunami observation
suggests that these events originated at the plate interface and that they must be included in future catalogs. Another particular case is the 1619 event (~7.5M, Lat. 8ºS), which was not associated with a tsunami in the historical catalogs [Silgado, 1978; Dorbath et al., 1990], remaining its origin as a doubt. A recent paleotsunami study by [Spiske et al., 2013], found evidence of tsunami deposits layers in the coast of Casma (Lat. 9°S) with an age of 370 ± 30 yrs, which seems to correlate with the 1619 earthquake, suggesting that this events can be classified as an interplate event.
Additional information of historical earthquakes for Peru comes from an exhaustive revision of the chronicles and reports of historical earthquakes done by Seiner, [2009, 2011]. We found that several historical events documented by Seiner, [2009, 2011] were not included in the widely used catalog of Silgado, [1978] on which most seismological studies rely. Two significant events are worth to be added to the history of subduction large earthquakes in Peru. The first occurred in northern Peru in 1759 causing destruction, five casualties and severe damages in the Trujillo region. The chronicles compare this event with that occurred in 1619. The second occurred in 1806 near Lima, causing destruction and disturbances in the sea in front of the Callao port where some vessels were pulled out from the sea, suggesting that a tsunami was associated to this event. For these 2 events there is no a magnitude assigned but based on the intensity and tsunami characteristics, a magnitude of the order of ~7.5Mw or even greater is plausible. Figure 1.9 shows an updated temporal and spatial distribution of large (M>7.5) historical and recent earthquakes since 1513 to date for the entire Peruvian subduction zone.
Figure 1.9: Updated compilation of large earthquakes occurred along the Peruvian subduction zone. Left: Rupture length as a function of time of large historical and instrumental earthquakes with M>7.5 occurred since the XV century. Right: Seismotectonic setting of the Peruvian subduction zone, showing the rupture area of large earthquakes occurred during the last century, blue polygons are events that were characterized as tsumami-earthquakes. Polygons in gray represent the approximate rupture area of the greatest 1868 (south) and 1746 (central) events. See text for more details.
The background seismicity (M<7) in the Peruvian subduction for the last 5 decades appears to be uniformly spatially distributed all along the margin (Figure 1.10) (ISC reprocessed catalog (http://www.isc.ac.uk/)). Figure 1.10B shows a comparison of the number of events every 0.2º of latitude and their seismic moment released for events of magnitude M≥4.5 since 1960 to 2012. We note, however, that the earthquakes occurred in the northern segment does not release significant stress as large earthquakes do. A cluster of seismicity is distinguished at the entrance of the Nazca Ridge. Holtkamp et al., [2011] using a global earthquake catalog identified this and a series of swarms along the Nazca South America subduction, and suggested that the swarms are related to segments that undergo aseismic slip.
In general, this panorama shows that the northern Peru subduction segment remains as the sole portion of entire South American subduction where no large earthquake (M>8) occurred at least since the XVI century. Whether the convergence is being accommodated through aseismic processes, that is the plates are practically freely sliding one respect to each other, or whether the strain is accumulating over several centuries to produce a very large earthquake in the future is one of the questions that has remained unknown so far. In this manuscript I address this issue.
Figure 1.10: A: Spatial distribution of the shallow (<70 km) seismicity extracted from the ISC declustered catalog for the period 1960-2012. Sized circles show the events of magnitude M ≥ 4.5. B: Continuous line indicates the number of shallow earthquakes located in the seismogenic zone every 0.2º of latitude and red dashed line the seismic moment released by such events.
4. Previous studies using space geodesy (GPS) in the Peruvian
Subduction
Spatial geodetic studies in the South American subduction zone have been carried out in almost the entire margin of the subduction zone including Colombia, northern Ecuador, central and southern Peru and Chile. These studies have evidenced for a generally high level of interseismic coupling. Moreover, these studies evidenced a long-term deformation of the continental lithosphere, which is accommodated by crustal deformation and mountain building via crustal shortening in the sub-Andean region [Norabuena et al., 1998; Bevis et al., 2001; Kendrick et al., 2001; Trenkamp et
al., 2002; Brooks et al., 2003; Chlieh et al., 2004; Ruegg et al., 2009; Moreno et al.,
2010; Vigny et al., 2011; Métois et al., 2013].
The first GPS measurements carried out in Peru, specifically in the central and southern regions, initiated in 1994 with the SNAPP project [Norabuena et al., 1998]. In that study the authors showed the simultaneous contributions of locking at the plate interface and the remaining deformation on the overriding plate contributing to the Andean mountain building via crustal shortening. Bevis et al., [1999] analyzed previous results and suggested a bias of 50% of the velocity field proposed by
Norabuena et al., [1998] due to an issue in the definition of the reference frame, that
then impact the level of locking at the plate interface. In 2005 Gagnon et al., [2005] published one of the first studies using sea bottom geodesy in a subduction zone, offshore central Peru. They combined sea bottom geodetic measurements with land based GPS along a profile and found that the shallow part of the plate interface is highly locked from 2 to a depth of 40 km, therefore suggesting that central Peru can host large earthquake and tsunami. More recently Chlieh et al., [2011] compiled previous studies observations to model the interseismic coupling at the plate interface and compute the seismic source of recent large earthquakes in the central Andes subduction zone. They found that the plate interface is heterogeneously locked and that areas undergoing high interseismic coupling were loci of rupture areas of past large earthquakes. They hypothesized that if all the stress accumulated before the 1868 and 1746 events (M>8.6) had entirely been released with these events, the moment deficit accumulated since those great earthquakes is high enough to produce similar size events. They further show that the 7 M~8.0 events occurred in central (1940, 1966,1974, 2007) and south (1942, 1996, 2001) Peru only released a fraction of the slip deficit, still leaving the potential for earthquakes of large magnitude in these segments.
Figure 1.11: Interseismic GPS velocities and coupling models for the central Andes subduction zone. a) Velocities are compared with the prediction of simple uniform model produced by elastic loading of the upper plate in response to locking on the plate interface [Bevis et al., 2001]. b) Distribution of interseismic coupling on the megathrust derived from the inversion of GPS velocities. The model shows that the pattern of interseismic coupling is heterogeneous. [Chlieh et al., 2011].
Understanding the problem of partitioning in subduction zones has been evidenced to be fundamental. In subduction zones where the plate convergence is oblique, as it is the case in Central America, south of Chile or Sumatra, major strike-slip lateral faults in the back of the forearc are found parallel to the trench axis accommodating the lateral motion of large continental slivers [Mccaffrey, 1992; Wang
et al., 2007]. In the Central Andes the problem of partitioning has been adopted in
terms of shortening in the Sub-Andean fold and thrust belt [Norabuena et al., 1998;
Bevis et al., 2001; Chlieh et al., 2011]. Other studies adopt this issue in terms of a
sliver motion [Métois et al., 2013]. Those approaches are usually adopted for subduction segments where a clear volcanic forearc and major faults systems accommodating are present.
The northern and central Peru subduction segment also shows oblique convergence, however, it is characterized by the absence of a volcanic forearc. Despite obliquity has been suspected to induce significant trench-parallel motion [Dewey and Lamb, 1992; Veloza et al., 2011], the partitioning has not been well characterized nor demonstrated. In this manuscript I analyze this issue and evaluate how partitioning is accommodated in Peru.
5. Main questions addressed in this thesis
Mega-tsunamigenic earthquakes of the decade 2004-2014 have pointed out the importance of correctly assessing the seismic hazard in subduction zones and the need to improve our understanding on the processes that lead to the occurrence of giant earthquakes. Indeed, the mechanisms whereby stresses are being accumulated and released along the plate interface are not well understood. The ANR-ADN (Andes du Nord) project financed by the French government between 2008 and 2012 proposed an integrated approach involving geodesy, seismology, tectonics, marine geophysics and modeling in order to address these issues. My thesis was done in the frame of that project considering the Peruvian subduction segment.
So far, GPS studies have focused in southern and partially in central Peru. The northern Peru segment (from 9ºS to -3ºS) remained as the sole portion without being studied using this technique. No information about was available before this thesis for
this segment, from the north of Lima to the Gulf of Guayaquil. As a consequence, even first order information was not available to assess neither the level of deformation and stress accumulation nor the associated seismic risk at the beginning of this thesis.
Figure 1.12: Left: Rupture area for known earthquakes with M>7.6 and GPS campaigns measurements since 1990 [Norabuena et al., 1998; Bevis et al., 2001; Kendrick et al., 2001;
Trenkamp et al., 2002; Chlieh et al., 2004]. Right: GPS derived model of mechanical
coupling along the subduction interface. Highly coupled zones are shown in red. They show similar sizes to ruptures of past large earthquakes. At the beginning of this thesis, no information was currently available to constrain the level of stress accumulation along a ~1200 km long segment between Lima (Peru) and Guayaquil (Ecuador).
The fundamental questions addressed in this thesis are:
- How the convergence is being accommodated along the Peruvian subduction zone, especially in its northern segment?
- What portion of the GPS surface deformation field could be attributed to the permanent continental deformation and what portion to the mechanical coupling at the megathrust interface? Where are the principal seismic asperities?
![Figure 1.2: Left: Schematic representation of the elastic rebound model after Reid, [1910]](https://thumb-eu.123doks.com/thumbv2/123doknet/13083678.384969/21.892.194.686.151.464/figure-left-schematic-representation-elastic-rebound-model-reid.webp)