HAL Id: hal-01292423
https://hal-mines-paristech.archives-ouvertes.fr/hal-01292423
Submitted on 23 Mar 2016HAL is a multi-disciplinary open access archive for the deposit and dissemination of sci-entific research documents, whether they are pub-lished or not. The documents may come from teaching and research institutions in France or abroad, or from public or private research centers.
L’archive ouverte pluridisciplinaire HAL, est destinée au dépôt et à la diffusion de documents scientifiques de niveau recherche, publiés ou non, émanant des établissements d’enseignement et de recherche français ou étrangers, des laboratoires publics ou privés.
pressurized water reactors primary water
Fabrice Gaslain, Hong Thai Le, Cecilie Duhamel, Catherine Guerre, Pierre
Laghoutaris
To cite this version:
Fabrice Gaslain, Hong Thai Le, Cecilie Duhamel, Catherine Guerre, Pierre Laghoutaris. The role of intergranular chromium carbides on intergranular oxidation of nickel based alloys in pressurized water reactors primary water. IOP Conference Series: Materials Science and Engineering, IOP Publishing, 2016, 109 012004, 10 p. �10.1088/1757-899X/109/1/012004�. �hal-01292423�
The role of intergranular chromium carbides on
intergranular oxidation of nickel based alloys in pressurized
water reactors primary water
F O M Gaslain1, H T Le1, C Duhamel1, C Guerre2 and P Laghoutaris3
1 MINES ParisTech, PSL - Research University, MAT - Centre des Matériaux, CNRS
UMR 7633, P.O. Box 87, 91003 Evry cedex, France
2 CEA, DEN, DPC, SCCME, Laboratoire d’Etude de la Corrosion Aqueuse, 91191
Gif-sur-Yvette, France
3 CEA, DEN, DPC, SCCME, Laboratoire d’Etude de la Corrosion Non Aqueuse,
91191 Gif-sur-Yvette, France
E-mail: fabrice.gaslain@mines-paristech.fr
Abstract. Alloy 600 is used in pressurized water reactors (PWRs) but is susceptible to
primary water stress corrosion cracking (PWSCC). Intergranular chromium carbides have been found beneficial to reduce PWSCC. Focussed ion beam coupled with scanning electron microscopy (FIB/SEM) 3D tomography has been used to reconstruct the morphology of grain boundary oxide penetrations and their interaction with intergranular Cr carbides in Alloy 600 subjected to a PWR environment. In presence of intergranular Cr carbides, the intergranular oxide penetrations are less deep but larger than without carbide. However, the intergranular oxide volumes normalized by the grain boundary length for both samples are similar, which suggest that intergranular oxidation growth rate is not affected by carbides. Analytical transmission electron microscopy (TEM) shows that the intergranular oxide consists mainly in a spinel-type oxide containing nickel and chromium, except in the vicinity of Cr carbides where Cr2O3 was evidenced. The formation of chromium oxide may explain the lower
intergranular oxide depth observed in grain boundaries containing Cr carbides. 1. Introduction
Currently, there are plans to extend the lifetime of pressurized water reactors (PWRs) of French nuclear power plants up to 60 years. Among the materials used in PWRs, nickel based alloys such as Alloy 600 (Ni-15Cr-10Fe) are used as structural materials in the primary circuit. Alloy 600 provides a good overall corrosion resistance but is susceptible to primary water stress corrosion cracking (PWSCC) [1, 2]. As a consequence, PWSCC of Alloy 600 and parent weld metals (Alloys 182/82) is a significant cause of failure in the primary circuit of PWRs [3]. This mode of damage leads to a brittle-type intergranular cracking of the material under the combined action of the environment and a tensile stress state. The SCC phenomenon is composed of several stages: development of oxide penetrations at the grain boundaries, fracture of the oxide leading to crack initiation, and then propagation of an intergranular crack [4]. However, SCC is a complex process and even though it has been studied extensively over the last thirty-five years, the cracking process is still under question [5-11]. To prevent PWSCC of Alloy 600, the presence of chromium carbides at the grain boundaries
Content from this work may be used under the terms of theCreative Commons Attribution 3.0 licence. Any further distribution of this work must maintain attribution to the author(s) and the title of the work, journal citation and DOI.
have shown to be beneficial [12-16]. Depending on the final thermal treatment, two kinds of chromium carbides can be formed: Cr23C6 and/or Cr7C3.
The aim of this work is to study the effect of intergranular chromium carbides on intergranular oxidation, which is a key step in the PWSCC mechanism. Indeed, intergranular Cr carbides are assumed to delay oxidation along the grain boundaries [17]. For this purpose, two A600 samples with model microstructures have been analysed after exposure to simulated nominal primary water in order to determine the influence of intergranular Cr carbides. The intergranular oxidation kinetics as well as the nature of the intergranular oxides was studied. To date, most of the studies describing such oxides are either based on cross-section observations (SEM, TEM), or volumetric techniques with either atomic resolution (atom probe tomography) or macroscopic approaches (SIMS or Auger depth profiling). Recently, Lozano-Perez and co-workers have shown that 3D tomography using a dual column scanning electron microscope associated with a focussed ion beam (FIB/SEM) is an appropriate technique for investigating such oxides [18, 19]. In this work, the oxidation depth and path along given grain boundaries were characterized by 3D FIB/SEM tomography. Cubic micrometre volumes of the two model microstructure materials were reconstructed with nanometric resolution to reveal the oxide shapes and their interactions with intergranular carbides. Additional characterisations by analytical transmission electron microscopy (TEM) were performed to investigate the chemical composition and structure of the intergranular oxide by coupling information from energy filtered TEM (EFTEM) analyses, electron diffraction patterns and high resolution images. Using this original analytical approach, we will give a better description of the role of Cr carbides on intergranular oxidation in nickel based alloys.
2. Materials and experimental procedures 2.1. Materials and oxidation test
Two specimens (thickness: 1.5 mm) with model microstructures have been prepared from commercial grade Alloy 600 (Ni-16Cr-10Fe), by applying two different thermal treatments under vacuum [20]. The two samples are named, SA for “Solution Annealed” and SA+TT for “Solution Annealed followed by Thermal Treatment”. All the experimental conditions are detailed in table 1.
Table 1. Overview of the thermal and oxidation treatments applied to the A600 samples.
SA SA+TT
Thermal
treatment 1,050 ºC for 1 h + water quenching 1,050 ºC for 1 h + water quenching + tempering at 700 ºC for 16 h Aim Microstructures without carbides intergranular carbide precipitation Microstructures with a dense
SEM image
Oxidation test conditions
1,400 h in simulated PWR water conditions at 325°C (P = 120 bar, [H2] = 30 mL (TPN)/kg H2O (200 mbar à 325ºC),
The SA microstructure exhibits no chromium carbides whereas SEM observations of the SA+TT one reveals a high density of intergranular chromium carbides. The stoichiometry of these carbides (Cr23C6 or Cr7C3) was not identified at this stage. Oxidation tests were then performed at the CEA
Saclay (France) in stainless steel autoclaves under simulated pressurized water reactor (PWR) primary water conditions at 325 ºC for 1,400h.
2.2. 3D FIB/SEM tomography
The oxidation depth and path along given grain boundaries of samples SA and SA+TT were characterized using a FEI Helios 660 dual column scanning electron microscope associated with a focussed ion beam (SEM/FIB). Before sectioning, a Pt protective coating was deposited above the area of interest. Then three trenches were excavated at the front and at the sides of the volume of interest to clear up the cross-section view imaged by SEM and to avoid any material re-deposition. The samples were orientated such that the focussed Ga+ ion beam was at a perpendicular incidence to
the surface (x-z plane). SEM secondary electron (SE) images of the cross-section were taken after each sequential 2D slice (in the x-y plane) at a tilt angle of 52° (figure 1). FIB sectioning parameters and SEM image acquisitions conditions are summarized in table 2.
Figure 1. SEM image showing an example of the volume isolated for the reconstruction after coating the exposed surface with Pt and milling two sides and one front trenches.
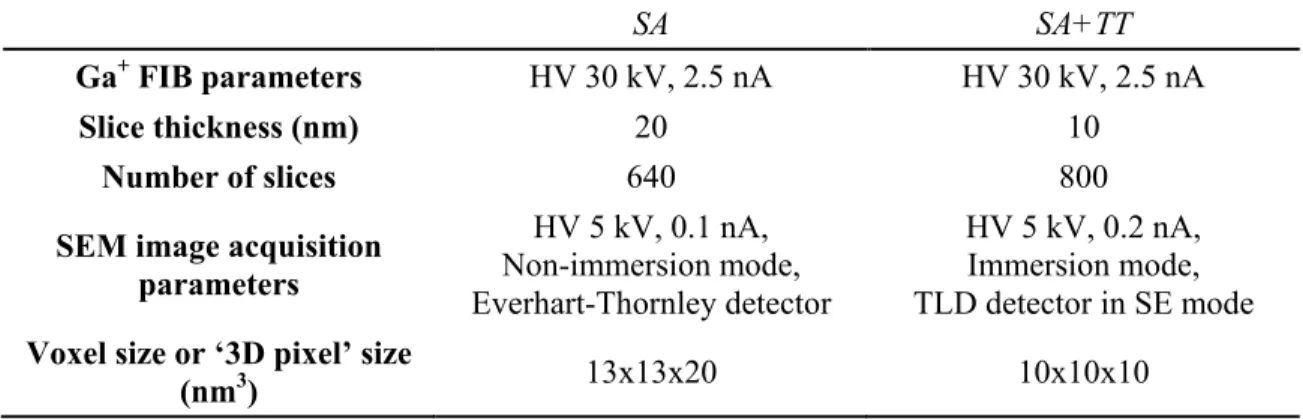
Table 2. FIB parameters and SEM image acquisition conditions.
SA SA+TT
Ga+ FIB parameters HV 30 kV, 2.5 nA HV 30 kV, 2.5 nA
Slice thickness (nm) 20 10
Number of slices 640 800
SEM image acquisition parameters HV 5 kV, 0.1 nA, Non-immersion mode, Everhart-Thornley detector HV 5 kV, 0.2 nA, Immersion mode, TLD detector in SE mode Voxel size or ‘3D pixel’ size
(nm3) 13x13x20 10x10x10
The 3D reconstructions were carried out using FEI software Avizo Fire 8.1. For both stacks of 2D SE images, stretching caused by the 38° tilt was corrected during image acquisition. Those images were then aligned and corrected for drift using cross-correlation of static features on the sample original surface following the method described in [21]. Then an area containing the region of interest, with its topside coinciding with the sample top surface, was extracted from each image and arranged as a 3D dataset.
The different regions of interest appearing in the 2D images (e.g., protecting Pt layer, oxides, carbides and metal matrix) were automatically segmented using intensity thresholding tools. When the contrasts between oxides, carbides and/or grains were too small, the automated segmentation methods failed and manual corrections were done until the result was satisfactory. One of these images extracted from the sample SA+TT stack of images is shown in figure 2 as an example.
Figure 2. a) Example of a SEM image showing the cross-sectional view from sample SA+TT. b) Binary mask of the oxide penetration (white) and the Cr carbides (grey) after segmentation.
2.3. Analytical TEM
Additional characterisations by analytical transmission electron microscopy (TEM) were performed on a FIB prepared thin foil. The thin foil was carefully micro-sampled then thinned down following the “lift-out” method described in [22, 23]. TEM observations and analyses were carried out at 200 kV using a FEI Tecnai F20 ST field emission gun microscope equipped with a Gatan Imaging Filter (GIF) device.
Analytical TEM was used to investigate the chemical composition and structure of the intergranular oxide by coupling information on composition from energy filtered TEM (EFTEM) analyses and on crystallography from electron diffraction patterns.
3. Results and discussions 3.1. 3D SEM/FIB tomography
For both samples, a 3D reconstruction model of the intergranular oxidation was created (figure 3) and three grain boundaries were analysed. The dimensions of the reconstructed volumes were 18.0 x 11.4 µm2 for sample SA and 14.0 x 15.4 µm2 for sample SA+TT. For each grain boundary, the
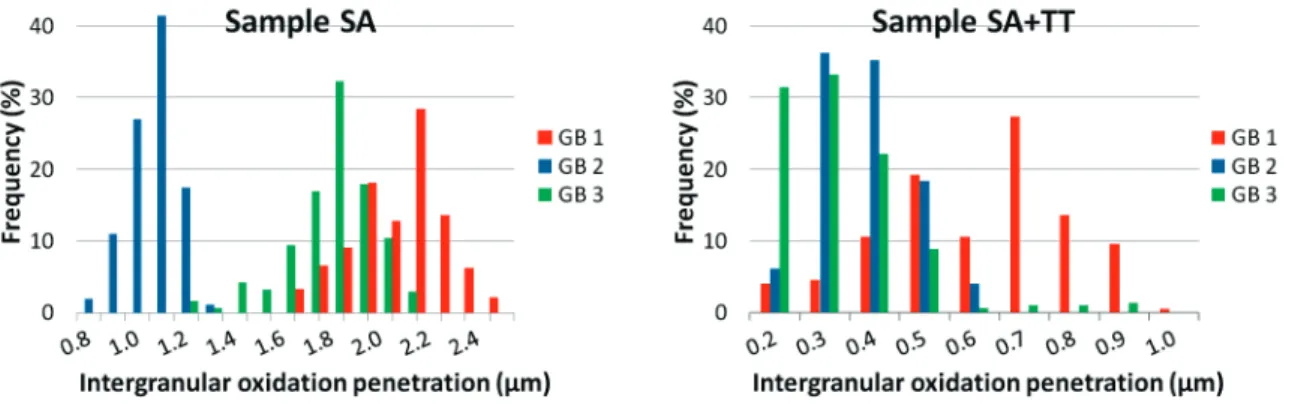
intergranular oxide depths were automatically measured for all the segmented images using a Python script. The average intergranular oxidation depths are presented in table 3 and the intergranular oxide penetrations distribution are shown in figure 4.
Figure 3. Reconstructed 3D volumes of the oxide penetrations represented in red of both sample SA (top) and sample SA+TT (bottom). The surface oxide present on sample SA is represented in yellow and the Cr carbides present on sample SA+TT are represented in green.
Table 3. Average intergranular oxidation depth for each grain boundary (GB).
SA SA+TT Average intergranular oxidation depth (nm) Standard
deviation (nm) intergranular Average oxidation depth (nm) Standard deviation (nm) GB 1 2168 180 661 183 GB 2 1113 93 430 98 GB 3 1824 174 378 136 5
Figure 4. Intergranular oxidation depth distributions of each grain boundary for samples SA and SA+TT.
For sample SA, oxide depths along each grain boundary are relatively even and continuous but the average lengths are relatively different from one grain boundary to another. Oxidation depth distributions vary from 0.9 to 2.6 µm. The deepest oxide penetration for this sample is found at the triple junction.
In contrast, for sample SA+TT, oxide depths are much shallower, uneven and wider along grain boundaries than the previous sample, but the average lengths seem to be more homogeneous from one grain boundary to another. In this sample, the oxidation depth distribution varies from 0.2 to 1.0 µm. Again, the deepest oxide penetration for this sample is found at the triple junction. The deepest oxide penetration is found along GB1 and can be explained by a less dense carbide distribution along this grain boundary. 3D reconstruction also highlights two features when an oxide reaches a Cr carbide: either the oxide is stopped by the carbide or the oxide is surrounding the carbide forming a cap on it.
Comparison of both samples highlights that intergranular oxidation goes much deeper along grain boundaries in Alloy 600 when Cr carbides are not present, since they probably act as obstacles for the oxidation to get through. We have also noticed that for sample SA+TT, intergranular oxide penetrations are much wider than in sample SA (table 4) by a factor of 3. This suggests that the oxidation penetrations are inhibited by Cr carbides, but oxide will nevertheless expand in the adjoining grains as shown by the oxide width reported in table 4.
Table 4. Average depths and surface widths of intergranular oxides.
SA SA+TT
Average intergranular
oxide depths (nm) 1679 447
Standard deviation (nm) 445 179
Average surface width of
intergranular oxides (nm) 247 719
Standard deviation (nm) 111 327
In order to have a global vision, the intergranular oxide volumes have been evaluated for both samples. The measurements were performed using the “Label analysis” tool from the Avizo software and normalized by the total length of the grain boundary to make the results comparable. The results
are summarized in table 5. Despite evident heterogeneities from one intergranular oxide penetration to another one, the total volumes of oxide penetration normalized by the total GB length are similar for each sample (i.e., 0.160 µm3/µm for sample SA against 0.140 µm3/µm for sample SA+TT,
respectively). These results are interesting but need to be moderated since we have extracted values from a relatively small volume compared to the total sample volume.
Table 5. Intergranular oxide volumes.
SA SA+TT Oxide volume (µm3) GB length (µm) Normalized oxide volume (µm3/µm) Oxide volume (µm3) GB length (µm) Normalized oxide volume (µm3/µm) GB 1 1.419 9.3 0.153 0.513 7.0 0.073 GB 2 1.000 14.0 0.071 0.412 6.0 0.068 GB 3 2.276 6.0 0.455 1.522 4.5 0.338 Total 4.695 29.3 0.160 2.447 17.5 0.140
3.2. Analytical TEM studies
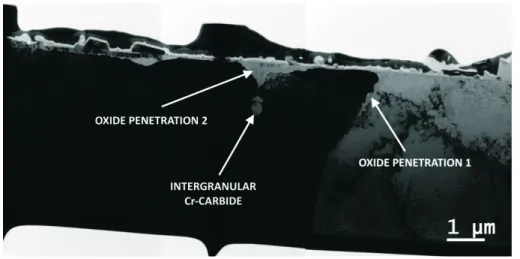
The FIB thin foil was taken close to a triple junction visible at the surface of sample SA and has the particularity to reveal a cross-section of two oxidized grain boundaries with two oxide penetration features. As can be seen from bright field TEM micrographs of the thin foil (figure 5), there is a relatively deep oxide penetration along a grain boundary exempt of carbide (oxide penetration 1) and a second one that is stopped by an intergranular carbide close to the surface (oxide penetration 2). In addition, these micrographs reveal that the oxide found at the surface is made from large discontinuous crystallites of about 1 µm wide and 0.3 µm high and from a thin continuous inner layer of 0.1 - 0.2 µm thickness.
Figure 5. Bright field TEM micrograph overview of the thin foil sampled from sample SA.
EFTEM analyses reveal that the large crystallites are iron rich oxides and that the inner layer is composed of chromium rich oxides. Diffraction patterns also confirm EFTEM observations: outer crystallites are identified as nickel ferrite NiFe2O4 whereas the inner oxides are of spinel-type and
close to the nickel chromite NiCr2O4 composition.
The oxide penetration 1, along a GB which does not contain any carbide (figure 6), is representative of oxide penetrations found in sample SA. It is composed of about 2 µm long chromium and nickel rich oxide. It is important to notice that the central part and the penetration tip are richer in chromium. Rings on the diffraction patterns acquired on the oxide penetration show that it is nanocrystalline. The distances match with a spinel-type oxide.
Figure 6. Left: Bright field TEM micrograph of oxide penetration 1 with insets showing the diffraction patterns of the intergranular oxide (A) and of the A600 matrix (zone axis: <110>) on one side of the oxide (B). Right: Corresponding EFTEM RGB composition map of respectively oxygen, chromium and nickel elemental maps.
The oxide penetration 2, which in this case is ended by a carbide (figure 7) like those found in sample SA+TT, is composed of a much broader chromium and nickel rich oxide penetration stopped by a chromium carbide particle. The oxide forms a cap on top of the carbide and seems to consume the surrounding matrix as it could be observed by FIB/SEM tomography.
4. Conclusions
Intergranular oxide penetrations in model Alloy 600 samples oxidized under simulated PWR primary water conditions have been characterized by FIB/SEM 3D tomography and analytical TEM. The effect of intergranular Cr carbides on the intergranular oxide depth has been studied. It was found that intergranular Cr carbides reduce intergranular oxide depths but enlarge them compared to intergranular oxide depths without carbide. However, the intergranular oxide volumes normalized by the GB length for both samples are similar, which suggest that intergranular oxidation growth rate is not affected by carbides. The FIB/SEM 3D tomography has allowed the reconstruction of volumes containing several oxide penetrations along grain boundaries with a remarkable nanometre spatial resolution. It also produced results of statistical significance, where intergranular oxidation depth
Figure 7. Left: Bright field TEM micrograph of oxide penetration 2 with an inset showing the oxide diffraction pattern. Right: Corresponding EFTEM RGB composition map of respectively oxygen, chromium and nickel elemental maps.
distribution histograms are used for characterisation. TEM observations have given a complete insight of the oxide penetration compositions and were identified as Cr and Ni rich spinel type oxides with the end tip richer in Cr.
Acknowledgement
This work was carried out within the MATMECA consortium and supported by the ANR under contract number ANR-10-EQUIPEX-37. It has benefited from the facilities of the Laboratory MSSMat (UMR CNRS 8579), CentraleSupélec, France.
References
[1] Combrade P, Scott P M, Foucault M, Andrieu E and Marcus P 2005 Oxidation of Ni base alloys in PWR water: oxide layers and associated damage to the base metal. in: 12th International Conference on Environmental Degradation of Materials in Nuclear Power Systems Water Reactors (Salt Lake City, USA) 883-890
[2] Bruemmer S M and Was G S 1994 Microstructural and microchemical mechanisms
controlling intergranular stress corrosion cracking in light-water-reactor systems. J. Nucl. Mater. 216 348-363
[3] Turluer G, Cattiaux G, Monnot B, Emond D, Reuchet J and Chartier P 2003 The French regulatory experience and views on nickel-base alloy PWSCC prevention and treatment. (Fontenay aux Roses, France: Institut de Radioprotection et de Surete Nucleaire, IRSN) [4] Wehbi M 2014 Modélisation de l’amorçage de la corrosion sous contrainte dans les alliages
base nickel 182 et 82 en milieu primaire des réacteurs à eau sous pression. Thesis (Paris, France: Ecole Nationale Supérieure des Mines de Paris)
[5] Perusin S, Viguier B, Monceau D, Ressier L and Andrieu E 2004 Injection of vacancies at metal grain boundaries during the oxidation of nickel. Acta Mater. 52 5375-5380
[6] Delabrouille F, Viguier B, Legras L and Andrieu E 2005 Effect of the chromium content on the corrosion of nickel based alloys in primary water of pressurised nuclear reactors. Mater. High Temp. 22 287-292
O Cr Ni
[7] Panter J, Viguier B, Cloué J-M, Foucault M, Combrade P and Andrieu E 2006 Influence of oxide films on primary water stress corrosion cracking initiation of alloy 600. J. Nucl. Mater. 348 213-221
[8] Lecoester F, Chêne J and Noel D 1999 Hydrogen embrittlement of the Ni-base Alloy 600 correlated with hydrogen transport by dislocations. Mater. Sci. Engng. A 262 173-183 [9] Scott P M 1999 An overview of internal oxidation as a possible explanation of intergranular
stress corrosion cracking of alloy 600 in PWRs. in: Proc. 9th Int. Symp. on Environmental Degradation of Materials in Nuclear Power Systems-Water Reactors (Newport Beach) 3-14 [10] Magnin T, Foct F and De Bouvier O 1999 Hydrogen effects on PWRSCC mechanisms in
monocrystalline and polycrystalline alloy 600. in: Proc. 9th Int. Symp. on Environmental Degradation of Materials in Nuclear Power Systems-Water Reactors (Newport Beach) vol 27
[11] Chêne J and Brass A M 2004 Role of temperature and strain rate on the hydrogen-induced intergranular rupture in alloy 600. Metall. Mater. Trans. A 35 457-464
[12] Kergaravat J-F 1996 Influence de la microstructure sur la sensibilité à la corrosion sous contrainte des Alliages 600 et 690 en milieu primaire des réacteurs à eau sous pression. Thesis (Grenoble, France: Institut National Polytechnique de Grenoble)
[13] Thomas L E and Bruemmer S M 2000 High-Resolution Characterization of Intergranular Attack and Stress Corrosion Cracking of Alloy 600 in High-Temperature Primary Water. Corrosion 56 572-587
[14] Panter J 2002 Étude de la corrosion sous contrainte des alliages 690 et 600 en milieu primaire de R.E.P.: influence des procédés de fabrication des tubes de générateur de vapeur sur la phase d’amorçage. Thesis (Toulouse, France: Institut National Polytechnique)
[15] Laghoutaris P 2009 Corrosion sous contrainte de l’Alliage 600 en milieu primaire des Réacteurs à Eau Pressurisée : apport à la compréhension des mécanismes. Thesis (Evry, France: Mines Paristech, PEMAT- Centre des matériaux PM Fourt)
[16] Dugdale H, Armstrong D E J, Tarleton E, Roberts S G and Lozano-Perez S 2013 How oxidized grain boundaries fail. Acta Mater. 61 4707-4713
[17] Sennour M, Laghoutaris P, Guerre C and Molins R 2009 Advanced TEM characterization of stress corrosion cracking of Alloy 600 in pressurized water reactor primary water
environment. J. Nucl. Mater. 393 254-266
[18] Lozano-Perez S, Kruska K, Iyengar I, Terachi T and Yamada T 2012 Understanding surface oxidation in stainless steels through 3D FIB sequential sectioning. J. Phys. Conf. Ser. 371 012086
[19] Lozano-Perez S, Kruska K, Iyengar I, Terachi T and Yamada T 2012 The role of cold work and applied stress on surface oxidation of 304 stainless steel. Corros. Sci. 56 78-85 [20] Guerre C, Laghoutaris P, Chêne J, Marchetti L, Molins R, Duhamel C and Sennour M 2012
Stress Corrosion Cracking of Alloy 600 in PWR Primary Water: Influence of Chromium, Hydrogen and Oxygen Diffusion. in: 15th Int. Conf. Environmental Degradation of Materials in Nuclear Power Systems-Water Reactors. (Busby J T, Ilevbare G and Andresen P L; Eds.) (New York, NY: John Wiley & Sons, Inc.) 1477-1488
[21] Schaffer B, Grogger W and Kothleitner G 2004 Automated spatial drift correction for EFTEM image series. Ultramicroscopy 102 27-36
[22] Giannuzzi L A and Stevie F A 1999 A review of focused ion beam milling techniques for TEM specimen preparation. Micron 30 197-204
[23] Giannuzzi L A, Drown J L, Brown S R, Irwin R B and Stevie F A 1998 Applications of the FIB lift-out technique for TEM specimen preparation. Microsc. Res. Tech. 41 285-290