HAL Id: hal-01074228
https://hal-polytechnique.archives-ouvertes.fr/hal-01074228
Submitted on 30 Oct 2014
HAL is a multi-disciplinary open access
archive for the deposit and dissemination of
sci-entific research documents, whether they are
pub-lished or not. The documents may come from
teaching and research institutions in France or
abroad, or from public or private research centers.
L’archive ouverte pluridisciplinaire HAL, est
destinée au dépôt et à la diffusion de documents
scientifiques de niveau recherche, publiés ou non,
émanant des établissements d’enseignement et de
recherche français ou étrangers, des laboratoires
publics ou privés.
Afforestation in China cools local land surface
temperature
S.-S. Peng, S. Piao, Z. Zeng, P. Ciais, L. Zhou, L.Z.X. Li, R.B. Myneni, Y.
Yin, H. Zeng
To cite this version:
S.-S. Peng, S. Piao, Z. Zeng, P. Ciais, L. Zhou, et al.. Afforestation in China cools local land surface
temperature. Proceedings of the National Academy of Sciences of the United States of America ,
Na-tional Academy of Sciences, 2014, 111 (8), pp.2915-2919. �10.1073/pnas.1315126111�. �hal-01074228�
Afforestation in China cools local land
surface temperature
Shu-Shi Penga, Shilong Piaoa,b,1, Zhenzhong Zenga, Philippe Ciaisc, Liming Zhoud, Laurent Z. X. Lie, Ranga B. Mynenif, Yi Yina, and Hui Zengg
aSino-French Institute for Earth System Science, College of Urban and Environmental Sciences, Peking University, Beijing 100871, China;bInstitute of Tibetan Plateau Research, Chinese Academy of Sciences, Beijing 100085, China;cLaboratoire des Sciences du Climat et de l’Environnement, UMR 1572 CEA-CNRS-UVSQ, 91191 Gif sur Yvette, France;dDepartment of Atmospheric and Environmental Sciences, University at Albany, State University of New York, Albany, NY 12222;eLaboratoire de Météorologie Dynamique, Centre National de la Recherche Scientifique, Université Pierre et Marie Curie-Paris 6, 75252 Paris, France;fDepartment of Earth and Environment, Boston University, Boston, MA 02215; andgPeking University Shenzhen Graduate School, Shenzhen 518055, China
China has the largest afforested area in the world (∼62 million hectares in 2008), and these forests are carbon sinks. The climatic effect of these new forests depends on how radiant and turbulent energy fluxes over these plantations modify surface temperature. For instance, a lower albedo may cause warming, which negates the climatic benefits of carbon sequestration. Here, we used satellite measurements of land surface temperature (LST) from planted forests and adjacent grasslands or croplands in China to un-derstand how afforestation affects LST. Afforestation is found to decrease daytime LST by about 1.1± 0.5 °C (mean ± 1 SD) and to increase nighttime LST by about 0.2± 0.5 °C, on aver-age. The observed daytime cooling is a result of increased evapo-transpiration. The nighttime warming is found to increase with latitude and decrease with average rainfall. Afforestation in dry regions therefore leads to net warming, as daytime cooling is offset by nighttime warming. Thus, it is necessary to carefully consider where to plant trees to realize potential climatic benefits in future afforestation projects.
vegetation feedback
|
climate change mitigation|
plantation effects|
surface coolingT
he area of planted forest (PF) in China has increased by∼1.7 million hectares per year (about 41% of the global affores-tation rate) during the last 2 decades (1, 2). China had the largest PF area in the world in 2008, at∼62 million hectares (Fig. 1), or ∼23% of global plantation area (264 million hectares) (1, 2). The Chinese government launched several projects to convert crop-lands (CR) and marginal crop-lands into forests, to reduce soil and water quality degradation, in the 1980s and 1990s (2). This af-forestation contributed to increased carbon storage (3, 4) but also altered local energy budgets, which has the potential to offer feedback on local and regional climates (5–10).Forests generally have a lower albedo than grasslands (GR) and CR. Thus, afforestation increases the amount of absorbed solar radiation at the surface (9, 10). Surface cooling will result if this extra energy is dissipated as evapotranspiration (ET) (11) or heat convection (7); otherwise, afforestation will result in surface warming. The biophysical effects of afforestation on local climate can be much larger than the small global cooling effect resulting from uptake of CO2by growing forests (8, 12, 13). However, these
biophysical effects are also complex and depend on “back-ground” climate (14). Afforestation generally cools the sur-face in tropical areas but warms it in boreal lands (6, 8–10). The effects of afforestation in temperate regions are not clear. The large area under afforestation in China, the diversity of projects (over former CR, GR, or marginal lands), and the broad range of background climates (most plantations are in temperate regions with varying degrees of annual average rainfall) pro-vide an interesting test bed to assess how afforestation affects local temperature.
In this article, we investigate how plantations affect land sur-face temperature (LST) across China, using satellite-derived LST data sets from Earth Observing System (EOS)-Terra and EOS-Aqua Moderate-Resolution Imaging Spectroradiometer (MODIS) instruments during the period from 2003 to 2010 (Methods). These LST data depend on the radiative properties of the land surface (15, 16) and, therefore, have a larger diurnal amplitude than the standard 2-m air temperature data from meteorological stations (17). The primary objective of this in-vestigation is to quantify the space–time distribution of differ-ences in LST between PF and adjacent GR or CR (ΔLST), during both daytime and nighttime.
Results and Discussion
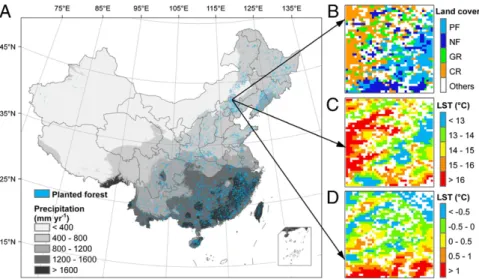
We first randomly sampled 1,000 grid cells, 40× 40 km in size, that have at least 10% fractional cover of PF (Methods). Grid cells in which an elevation difference in the range of−100∼100 m between PF and natural forests (NF), GR, and CR were se-lected for further analysis to minimize the effect of elevation on ΔLST. This resulted in 787, 163, and 155 sample grid cells for comparison between PF and NF, GR, and CR, respectively (Fig. 1; SI Appendix, Fig. S1). Fig. 1 B–D shows an example of the distribution of land cover types within a grid cell and the annual daytime and nighttime LSTs. There is almost no difference in annual daytime (∼10:30 AM and ∼13:30 PM) and nighttime (∼22:30 PM and ∼01:30 AM) temperatures between PF and NF (ΔLST∼0 °C, Fig. 2). However, annual daytime temperatures of GR and CR were higher than that of PF (Fig. 2), at about 1.1±
Significance
China has the largest afforested area in the world. Afforesta-tion not only contributes to increased carbon storage but also alters local albedo and turbulent energy fluxes, which offers feedback on the local and regional climate. This study presents previously unidentified observational evidence of the effect of large-scale afforestation on land surface temperature (LST) in China. Afforestation decreases daytime LST, because of en-hanced evapotranspiration, and increases nighttime LST. This nighttime warming tends to offset daytime cooling in dry regions. These results suggest it is necessary to carefully con-sider where to plant trees to achieve potential climatic benefits in future afforestation projects.
Author contributions: S.-S.P. and S.P. designed research; S.-S.P. and Z.Z. performed re-search; S.-S.P. and Z.Z. analyzed data; and S.-S.P., S.P., P.C., L.Z., L.Z.X.L., R.B.M., Y.Y., and H.Z. wrote the paper.
0.6 °C (mean ± 1 SD) between GR and PF and 1.2 ± 0.5 °C between CR and PF (these differences are statistically significant atP < 0.001). In contrast, the average annual nighttime ΔLSTs between PF and GR and CR were 0.2± 0.5 °C and 0.3 ± 0.5 °C, respectively (Fig. 2), indicating that afforestation warms land surface during the night, a signal of opposite sign but smaller magnitude than the daytime cooling.
The average annual daytime and nighttimeΔLST between PF and short vegetation shows an asymmetric diurnal variation, with a larger magnitude in daytime cooling than nighttime warming (Fig. 2). This asymmetric diurnal cycle ofΔLST between PF and short vegetation is observed in more than 93% (PF vs. GR) and 86% (PF vs. CR) of the sampled grid cells, respectively (SI Ap-pendix, Figs. S2 and S3). We conclude that afforestation of for-mer GR and CR decreases the average daily mean LST by 0.5± 0.4 °C and 0.4± 0.4 °C respectively, because some of the daytime cooling is offset by nighttime warming.
The asymmetric diurnal cycle of LST results from different energy balance processes (18–20). LST during the daytime is controlled by incoming solar radiation, surface properties (such as albedo and emissivity), partitioning of latent and sensible heat fluxes, and mixing in the near-surface atmospheric boundary layer (16). Incoming solar radiation can be assumed to be similar between adjacent PF and GR or CR pixels. Hence, surface albedo determines the amount of absorbed solar radiation. The expenditure of this energy as latent and sensible heat fluxes is controlled by vegetation activity and soil moisture status (21). Our null hypothesis is a lower albedo and higher ET in PF relative to GR or CR (Fig. 3). The albedo of PF is indeed lower than that of short vegetation in 95% (PF vs. GR) and 99% (PF vs. CR) of the grid cells, and ET is higher in 70% (PF vs. GR) and 94% (PF vs. CR) of the grid cells, re-spectively (SI Appendix, Figs. S4 and S5). This clearly indi-cates that PF across China absorbs more incoming radiation and dissipates more energy as latent heat (8, 9, 11, 22). Thus, afforestation on average induces cooling during the daytime (10, 11, 22, 23).
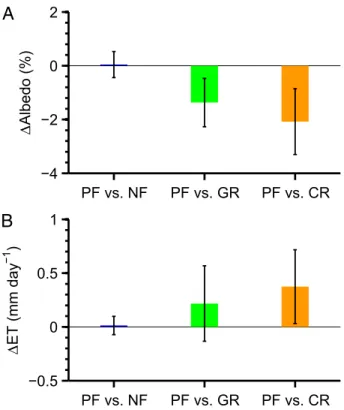
The surface incoming solar radiation under all sky conditions ranges between 3,960 and 6,410 MJ per year in China (Methods). The average annual difference in albedo is −1.37 ± 0.90% be-tween PF and GR and−2.08 ± 1.22% between PF and CR (Fig. 3). Hence, the extra solar energy absorbed by PF is on average about 54–88 MJ per year compared with that of the adjacent GR vegetation (82–133 MJ per year in the case of CR vegetation).
Planted forests transpired 0.22± 0.35 mm day−1more than the adjacent GR vegetation, which equates to extra energy dissipa-tion through latent heat of about 200± 310 MJ per year (0.37 ± 0.34 mm day−1, or about 331± 300 MJ per year, in the case of CR). This enhanced energy loss through ET cools the surface because it exceeds the extra energy that is absorbed (Fig. 2;P < 0.001 from variance analysis;SI Appendix, Figs. S6 and S7). The ΔET explains 46% of the variation in daytime ΔLST between PF and GR in the 58 grid cells whereΔAlbedo is −1% or higher, but in grid cells whereΔAlbedo is lower than −1%, it explains less than 5% of the variation in daytimeΔLST (SI Appendix, Fig. S8). Similar results are obtained for PF and CR vegetation types (SI Appendix, Fig. S8). This analysis suggests that if the albedo warming effect is weak, the ET cooling effect controls daytime ΔLST. Otherwise, the ET cooling effect could be masked by the stronger albedo warming effect on daytimeΔLST.
In general, land surfaces absorb and store energy from the atmosphere during the day and release energy during the night. At night, ET is negligible, and thus LST must be closely related to energy stored during the daytime and to the near-surface at-mospheric boundary layer (9, 16). When afforesting GR or CR,
Fig. 1. Spatial distribution of planted forest in China and an example of a 40× 40 km sample area. (A) Spatial distribution map of PF with mean annual precipitation background. (B) Land cover types; (C) daytime LST; and (D) nighttime LST for the example sample area.
~10:30am ~13:30pm ~22:30pm ~01:30am -2 -1 0 1 LS T ( °C ) PF vs. NF PF vs. GR PF vs. CR
Fig. 2. Differences (mean± SD) in annual LST between PF and the ad-jacent NF, GR, and CR during the daytime (∼10:30 AM and ∼13:30 PM) and nighttime (∼23:30 PM and ∼01:30 AM) in China during the period 2003–2010.
it is likely that the increase in surface heat capacity (e.g., as a result of an increase in soil moisture) may result in more daytime heat storage, and thus more nighttime heating, and that the increase in air humidity (e.g., as a result of enhanced daytime evapotranspiration) near the surface and the enhancement of boundary layer cloud formation may result in more downward longwave radiation received from the atmosphere and reduce the outgoing longwave radiation from the planted forests. This longwave radiative imbalance has a stronger effect during night-time, when the boundary layer is thinner and more stable, than during daytime (18–20). In addition, the nighttime warming ef-fect could be magnified as a result of reduced atmospheric tur-bulence from a more stable stratification over trees (9). This reduces heat dissipation from PF cover types compared with open lands of GR or CR. We found that the nighttimeΔLST between PF and short vegetation is significantly and negatively correlated withΔET and ΔAlbedo (SI Appendix, Figs. S6 and S7). This suggests that a largerΔET relative to the excess solar energy absorption by PF during the day results in a smaller warming effect during the nighttime, which confirms the hy-pothesis that nighttime warming largely reflects the release of daytime heat storage.
More daytime heat storage could result in a larger nighttime warming effect in areas where there is not enough soil moisture for transpiration by planted forests to compensate for the excess absorbed solar radiation. Indeed, the nighttimeΔLST is signifi-cantly and negatively correlated to mean annual precipitation (MAP) [R, −0.34 (P < 0.001) for PF vs. GR; R, −0.46 (P < 0.001) for PF vs. CR]. The nighttime warming effect almost cancels the daytime cooling effect from afforestation of grasslands in areas with MAP between 400 and 600 mm y−1(average daily mean ΔLST, ∼−0.1 ± 0.6 °C;SI Appendix, Fig. S9). In the case of af-forestation of CR, the average daily meanΔLST is ∼−0.1 ± 0.3 °C in regions with MAP between 600 and 800 mm y−1 (SI Ap-pendix, Fig. S10). The nighttimeΔLST between PF and GR or
CR is close to zero, but the daytime cooling effect is∼1.3 ± 0.5 °C in wetter regions (i.e., MAP> 800 mm y−1for PF vs. GR and MAP> 1,000 mm y−1for PF vs. CR;SI Appendix, Figs. S9 and S10). This is consistent with previous findings of afforestation effects in wet temperate areas (9). Furthermore, the fraction of sample grid cells with positive daily meanΔLST between PF and GR decreases from 43% in areas with MAP between 400 and 600 mm y−1to 0% in regions with MAP higher than 800 mm y−1 (SI Appendix, Fig. S11). Similar results are obtained for the case of contrasted analysis between PF and CR (SI Appendix, Fig. S11). These results suggest that afforestation will likely lead to warming, rather than cooling, in relatively dry regions.
The cooling effect of afforestation decreases with increasing latitude and even switches to a local warming effect in high-lat-itude regions (SI Appendix, Figs. S12 and S13). For example, the daytime cooling effect of afforestation is completely offset by the nighttime warming effect in areas north of 45°N (daily mean ΔLST, 0.4 ± 0.4 °C; SI Appendix, Fig. S12). In contrast, affor-estation of lands south of 35°N still have a clear cooling effect (ΔLST, −0.6 ± 0.3 °C; SI Appendix, Figs. S12 and S13). Both ΔET and ΔAlbedo between PF and GR or CR significantly decrease with latitude (SI Appendix, Figs. S12 and S13). Thus, going from south to north, PF absorbs more incoming radiation and produces less ET compared with adjacent short vegetation. This surface energy imbalance leads to a larger daytime cooling relative to nighttime warming in the south compared with the north (SI Appendix, Figs. S12 and S13). North of 35°N, the extra ET by PF is smaller than the extra absorbed solar radiation (SI Appendix, Figs. S14 and S15), but daytime ΔLST still shows a cooling effect (SI Appendix, Figs. S12 and S13). This suggests that increased sensible heat flux from PF may increase the effi-ciency of convective heat transport, which results in daytime cooling and also reduces the explanatory power of ΔET on daytime ΔLST when ΔAlbedo is lower than −1% between PF and GR andΔAlbedo is lower than −2% between PF and CR (SI Appendix, Fig. S8). The lack of high-resolution gridded data sets of sensible heat transport precludes a detailed investigation of the respective cooling effects of ET and convective heat transfer. In addition, it is difficult to delineate the exact bio-climatic boundary separating the warming versus cooling effects of afforestation because the area of forest plantations north of 45°N is much smaller in China (SI Appendix, Fig. S1).
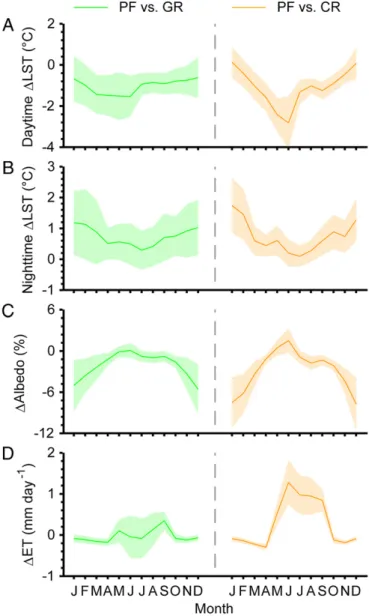
The warming effect of afforestation at higher latitudes is augmented in winter because of the differences in albedo of tall versus short vegetation, as the latter can be covered by snow (8). In line with this argument, the nighttimeΔLST between PF and short vegetation is larger in winter than in summer in areas north of 35°N (Fig. 4). Here, afforestation of CR has a net warming effect during both daytime (0.0± 0.6 °C) and nighttime (1.5 ± 0.8 °C) in winter. This is becauseΔAlbedo is quite large (−7.1 ± 3.3%) andΔET is negligible (SI Appendix, Figs. S16 and S17). In summer, however, afforestation enhancesΔET by about 1.0 ± 0.4 mm day−1, butΔAlbedo is almost negligible (SI Appendix, Fig. S18). The strong warming effect during winter emphasizes the existence of a significant positive snow–albedo feedback (Fig. 4). The same is not seen in southern parts, as expected (SI Ap-pendix, Fig. S18).
Conclusions
China plans to increase afforested area by about 40 million hectares from 2005 to 2020 to mitigate climate change (2). The challenge is to identify locations where afforestation will create the largest climatic benefits and sustain other ecological services (11). Here we present previously unidentified observational ev-idence for the effect of large-scale afforestation on temperature in China, using MODIS data products. The cooling/warming effects resulting from sensible heat transport and longwave ra-diation emission of afforested lands are still poorly understood
PF vs. NF
PF vs. GR
PF vs. CR
−0.5
0
0.5
1
ET (mm day
− 1)
B
PF vs. NF
PF vs. GR
PF vs. CR
−4
−2
0
2
Albedo (%)
A
Fig. 3. Differences (mean± SD) in annual (A) albedo (ΔAlbedo, %) and (B) evapotranspiration (ΔET, mm day−1) between PF and the adjacent NF, GR, and CR in China during the period 2003–2010.
because of a lack of requisite data. The radiative temperature considered in this study is subject to a larger change than the more commonly reported 2-m air temperature. Future studies should assess the full range of climatic effects of afforestation by combining energy fluxes from eddy flux towers, satellite obser-vations, and land surface models coupled with climate models. Methods
MODIS Data. We use MODIS collection-5 products of LST, land cover map, ET, and surface shortwave albedo at 1 km resolution. These products have been used extensively in a variety of areas and are proven to be of high quality (15,
16). MODIS Terra and Aqua instruments are sun-synchronous and image the entire Earth every 1–2 d. For LST, we use the 8-d average LST from EOS-Aqua-MODIS (MYD11A2) and EOS-Terra-MODIS (MOD11A2) products dur-ing the period from 2003 to 2010. The LST data include daytime (local solar time∼10:30 AM from Terra and ∼13:30 PM from Aqua) and nighttime (∼22:30 PM from Terra and ∼01:30 AM from Aqua) temperature observa-tions. The retrieval of LST was further improved by correcting noise resulting from cloud contamination, topographic differences, and zenith angle changes; the absolute bias of LST is generally less than 1 K (15). We use the MODIS ET data (MOD16) at 8-d intervals from 2003 to 2010, which was generated using land cover, leaf area index, air temperature, air pressure, air humidity, and net radiation as input data (21) independent of the MODIS LST product. The mean absolute bias of MODIS ET is about 0.3 mm day−1 compared with ET observations from eddy flux towers (21). The MODIS al-bedo (MCD43B3) products used in this study include black sky alal-bedo and white sky albedo over shortwave broadband (0.3–5.0 μm), with 1-km spatial resolution and an 8-d interval from 2003 to 2010 (24). We use white sky albedo in this study, and the bias of MODIS albedo is mostly less than 5% (25). Yearly MODIS land use and land cover map (MCD12Q1) in 2004 was used to distinguish forest, GR, and CR pixels (26).
Planted Forests Map and Climate Data. The spatial distribution of PF map at 1-km resolution was obtained from the report of the Seventh National Forest Resource Inventory (2004–2008), released by China’s State Forestry Admin-istration (2). The mean annual precipitation data during the period of 1980– 2009 used in this study are the Climate Research Unit time-series 3.1 climate data set obtained from the University of East Anglia (27). Data on the sur-face incoming solar radiation under all sky conditions, with 1° resolution, during the period of 2003–2010 were obtained from the Clouds and Earth’s Radiant Energy System (http://ceres.larc.nasa.gov/).
Analyses. First, we randomly sampled 1,000 grid cells, 40 × 40 km in size, that have at least 10% fractional cover of planted forests (see detailed algorithm inSI Appendix). We also applied the same analysis with grid cells with at least 5% fractional cover of planted forest, and the results are similar. Within each 40× 40 km grid cell, the differences in LST (ΔLST) between PF and NF, GR, and CR are supposed to account for the changes in LST resulting from reforestation or afforestation of NF, GR, and CR. To minimize the ef-fect of elevation onΔLST, we only selected grid cells in which elevation difference was in the range of−100∼100 m between PF and NF, GR, and CR for further analysis. This resulted in 787, 163, and 155 sample grid cells for comparison between PF and NF, GR, and CR, respectively (Fig. 1;SI Appendix, Fig. S1). As the LST has four measurement times, the Terra and Aqua data are also combined to produce daytime (averages of∼10:30 AM and ∼1:30 PM) and nighttime (averages of∼10:30 PM and ∼1:30 AM) LSTs. For each sample area, we averaged 8-d intervalΔLST into monthly means during the period of 2003–2010 to show the seasonal cycle. Similar to ΔLST, we calcu-lated the differences in ET (ΔET) and albedo (ΔAlbedo) between PF and adjacent NF, GR, and CR to gain insights of diurnal cycle, seasonal cycle, and spatial variations ofΔLST. The fractional cover of planted forest in the 40 × 40 km sample grid cells have little effect onΔLST (R2,∼0;SI Appendix, Fig.
S19). The differences in elevation from digital elevation model between PF and GR or CR also have limited effect onΔLST (R2∼0–0.08;SI Appendix, Fig.
S20). We found similar results using bigger sample grid cells (50× 50 km or 100× 100 km) (SI Appendix, Figs. S21 and S22). In addition, we also found similar results using a regular grid sample method (i.e., we sampled grid cells every 40 km from 55°N to 15°N and every 40 km from 70°E to 140°E;
SI Appendix, Figs. S23 and S24).
ACKNOWLEDGMENTS. This study was supported by the National Natural Science Foundation of China (41125004), National Basic Research Program of China (2013CB956303), National Youth Top-notch Talent Support Program in China, and Chinese Ministry of Environmental Protection Grant (201209031). R.B.M. acknowledges support from NASA Earth Science Division. L.Z. acknowledges support from the National Science Foundation (NSF AGS-1247137).
1. Food and Agriculture Organization of the United Nations (2010) Global Forest Resources Assessment 2010. Food and Agriculture Organization of the United Nations. Available at: http://www.fao.org/forestry/fra/fra2010/en/. Accessed February 7, 2012.
2. State Forestry Administration of the People’s Republic of China (2009) Seventh Na-tional Forest Resource Inventory Report (2004-2008) (State Forestry Administration of the People’s Republic of China, Beijing).
3. Fang JY, Chen AP, Peng CH, Zhao SQ, Ci L (2001) Changes in forest biomass carbon storage in China between 1949 and 1998. Science 292(5525):2320–2322.
4. Piao SL, et al. (2009) The carbon balance of terrestrial ecosystems in China. Nature 458(7241):1009–1013.
5. Bala G, et al. (2007) Combined climate and carbon-cycle effects of large-scale de-forestation. Proc Natl Acad Sci USA 104(16):6550–6555.
6. Betts R (2007) Implications of land ecosystem-atmosphere interactions for strate-gies for climate change adaptation and mitigation. Tellus B Chem Phys Meterol 59(3):602–615.
7. Rotenberg E, Yakir D (2010) Contribution of semi-arid forests to the climate system. Science 327(5964):451–454.
Fig. 4. Mean seasonal cycle of differences in (A) daytime and (B) nighttime LST, (C)ΔAlbedo (%), and (D) ΔET (mm day−1) between PF and the adjacent GR and CR in northern China (north of 35°N) during the period 2003–2010. The colorful lines and lighted shaded areas represent the mean and SD of all sample grid cells north of 35°N, respectively.
8. Arora VK, Montenegro A (2011) Small temperature benefits provided by realistic afforestation efforts. Nat Geosci 4(8):514–518.
9. Lee X, et al. (2011) Observed increase in local cooling effect of deforestation at higher latitudes. Nature 479(7373):384–387.
10. Bonan GB (2008) Forests and climate change: Forcings, feedbacks, and the climate benefits of forests. Science 320(5882):1444–1449.
11. Jackson RB, et al. (2008) Protecting climate with forests. Environ Res Lett 3(4):044006, 10.1088/1748-9326/3/4/044006.
12. Georgescu M, Lobell DB, Field CB (2011) Direct climate effects of perennial bioenergy crops in the United States. Proc Natl Acad Sci USA 108(11):4307–4312.
13. Loarie SR, Lobell DB, Asner GP, Mu QZ, Field CB (2011) Direct impacts on local climate of sugar-cane expansion in Brazil. Nature Clim Change 1(2):105–109.
14. Pitman AJ, et al. (2011) Importance of background climate in determining impact of land-cover change on regional climate. Nature Clim Change 1(9):472–475. 15. Wan Z (2008) New refinements and validation of the MODIS Land-Surface
Temper-ature/Emissivity products. Remote Sens Environ 112(1):59–74.
16. Zhou L, et al. (2012) Impacts of wind farms on land surface temperature. Nature Clim Change 2(7):539–543.
17. Jin M, Dickinson RE (2010) Land surface skin temperature climatology: Benefitting from the strengths of satellite observations. Environ Res Lett 5(4):044004. 18. Dai A, Trenberth KE, Karl TR (1999) Effects of clouds, soil moisture, precipitation, and
water vapor on diurnal temperature range. J Clim 12(8):2451–2473.
19. Zhou L, Dickinson RE, Tian Y, Vose RS, Dai Y (2007) Impact of vegetation removal and soil aridation on diurnal temperature range in a semiarid region: Application to the Sahel. Proc Natl Acad Sci USA 104(46):17937–17942.
20. Zhou LM, et al. (2009) Spatial dependence of diurnal temperature range trends on precipitation from 1950 to 2004. Clim Dyn 32(2-3):429–440.
21. Mu QZ, Zhao MS, Running SW (2011) Improvements to a MODIS global terrestrial evapotranspiration algorithm. Remote Sens Environ 115(8):1781–1800.
22. Davin EL, de Noblet-Ducoudre N (2010) Climatic impact of global-scale deforestation: Radiative versus nonradiative processes. J Clim 23(1):97–112.
23. Chapin FS, Randerson JT, McGuire AD, Foley JA, Field CB (2008) Changing feedbacks in the climate-biosphere system. Front Ecol Environ 6(6):313–320.
24. Schaaf CB, et al. (2002) First operational BRDF, albedo nadir reflectance products from MODIS. Remote Sens Environ 83(1-2):135–148.
25. Liu J, et al. (2009) Validation of Moderate Resolution Imaging Spectroradiometer (MODIS) albedo retrieval algorithm: Dependence of albedo on solar zenith angle. J Geophys Res Atmos 114:D01106, 10.1029/2008jd009969.
26. Friedl MA, et al. (2010) MODIS Collection 5 global land cover: Algorithm refinements and characterization of new datasets. Remote Sens Environ 114:168–182. 27. Mitchell TD, Jones PD (2005) An improved method of constructing a database of
monthly climate observations and associated high-resolution grids. Int J Climatol 25(6):693–712.
![A SHARP view of H0LiCOW: H[SUB]0[/SUB] from three time-delay gravitational lens systems with adaptive optics imaging](data:image/gif;base64,R0lGODlhAQABAIAAAP///wAAACH5BAEAAAAALAAAAAABAAEAAAICRAEAOw==)