HAL Id: halshs-00586217
https://halshs.archives-ouvertes.fr/halshs-00586217
Preprint submitted on 15 Apr 2011
HAL is a multi-disciplinary open access archive for the deposit and dissemination of sci-entific research documents, whether they are pub-lished or not. The documents may come from
L’archive ouverte pluridisciplinaire HAL, est destinée au dépôt et à la diffusion de documents scientifiques de niveau recherche, publiés ou non, émanant des établissements d’enseignement et de
Trade in services: Cross-border trade vs commercial
presence. Evidence of complementarity
Carolina Lennon
To cite this version:
Carolina Lennon. Trade in services: Cross-border trade vs commercial presence. Evidence of comple-mentarity. 2008. �halshs-00586217�
WORKING PAPER N° 2008 - 53
Trade in services:
cross-border trade vs commercial presence
Evidence of complementarity
Carolina Lennon
JEL Codes: F10, F14, F23, L80
Keywords: International trade in services, FDI, mode of
supply
P
ARIS-
JOURDANS
CIENCESE
CONOMIQUESL
ABORATOIRE D’E
CONOMIEA
PPLIQUÉE-
INRA 48,BD JOURDAN –E.N.S.–75014PARISTÉL. :33(0)143136300 – FAX :33(0)143136310
www.pse.ens.fr
Trade in Services: Cross-Border Trade vs.
Commercial Presence. Evidence of
Complementarity
∗Carolina Lennon† September 2007
Abstract
One of the main characteristics of trade in services is that a limited number of services can be traded across the border. In fact, a larger number of services require physical contact between consumers and producers in order to allow the transaction to occur. In this respect, trade in services has been classified by four modes of supply: Mode 1, cross-border trade; Mode 2 , consumption abroad; Mode 3, commer-cial presence and Mode 4, movement of natural persons. This clas-sification has already been widely recognised by economists, and has been adopted as a framework for current multilateral negotiations un-der the GATS. However, little research has been conducted regarding the interrelations between these modes of supply.
Furthermore,it is tempting to assert that new communication tech-nologies could exempt services from the need for physical presence, and in this context, they can generate a substitution effect from services originally provided by factor movement (Mode 3 and Mode 4 ) and con-sumer movement (Mode 2 ) to trade in services supplied by Mode 1. However, new stylized facts on the United State’s commercial presence and cross border trade in services contradict this assumption. Not only is commercial presence the main mode of supply of US service exports, but it has also been growing at a faster rate than Mode 1. The purpose
∗
I thank Carsten Fink, Marion Jansen, Juan Marchetti, Joscelyn Magdeleine, Philippe Martin and Martin Roy and participants at the European Trade Study Group Conference, September 2007, Athens. and to participants of the Ph.D. Support Programme, WTO, Geneva, September 2007.
†
Centre d’Economie de la Sorbonne (TEAM), Universit´e de Paris 1 and
Paris-Jourdan Sciences Economiques (PSE), 48 bd Jourdan, 75014, Paris, France.
of this paper is to investigate this puzzle by analyzing the relationship between Mode 1 and Mode 3. We postulate that these two modes of supply facilitate each other, and that, in contrast to the manufacturing sector, this complementarity might occur even at the level of horizontal investment. For the empirical analysis we make use of bilateral data on US majority-owned foreign affiliate operations (MOFAs) for both the services and goods sectors. After using two different estimating techniques results confirm this intuition, not only Mode 1 and Mode 3 are complements but also the complementarity relationship is stronger than that found in the case of goods. Moreover, the complementarity between this two modes of supply is also found at the level of horizontal FDI.
Keywords: International Trade in Services, Modes of Supply, FDI. JEL classification: F10, F14, F23, L80
First Version: September 2007
Preliminary Version. Please do not cite or quote without permission. Comments are very welcome.
1
Introduction
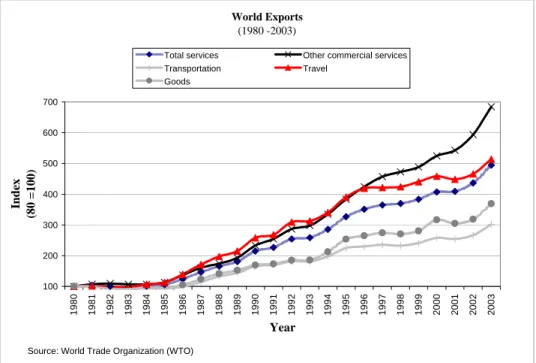
One of the most important phenomenons of the process of globalization is the well-known growth of trade in services. Measured by the balance of payments (BOP), over the past two decades, growth of trade in services has surpassed growth of trade in goods. Trade in goods has multiplied by 3,5 while Total services has multiplied by around 5. Of particular interest is the trend in Other Commercial Services (OCS) which represents mostly cross-border trade in services 1 (Mode 1 ) , this sub-sector having experienced a seven-fold increase in its export value over the same period (see Figure1).
World Exports (1980 -2003) 100 200 300 400 500 600 700 1980 1981 1982 1983 1984 1985 1986 1987 1988 1989 1990 1991 1992 1993 1994 1995 1996 1997 1998 1999 2000 2001 2002 2003 Year Inde x (80 = 100)
Total services Other commercial services Transportation Travel
Goods
Source: World Trade Organization (WTO)
Figure 1: World Totals of Cross border exports of services and goods There exists a consensus in the services field that one of the driving forces behind this trend might be advances in information and communi-cation technologies2. These technological breakthroughs are increasingly
1As indicated in the Trading module of Measuring Trade in Services (WTO(2006)),
not all services comprised in OCS can be considered cross-border trade in services. For instance, a part of construction services included in BOP statistics should instead be considered as Mode 3. In any event construction services in 2003 represented only 4 % of total world exports of OCS.
frag-permitting cross-border “disembodied” trade in services3.
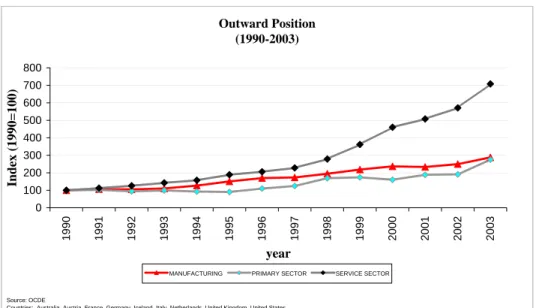
Additionally, base on the Heckscher-Ohlin trade theory we know that the freeing up of international factor movement (labor and/or capital) and the resulting increase of international factor flows can act as a substitute for trade in final goods. Similarly, the firms theory indicates that Multi-national Corporations (MNCs) recurrently face the choice of whether to supply a foreign market by exporting into that market (cross-border trade) or by investing in it (factor movement). Accordingly, facing the new trends in cross-border trade in services and considering the theoretical models de-scribed above, it is tempting to assume that new communication technolo-gies could exempt services from the need for physical presence, generating a substitution effect from services originally provided by factor movement (Mode 3 and Mode 4) and consumer movement (Mode 2) to trade in ser-vices supplied by Mode 1. Given the recent impressive pace of cross-border trade in services we should expect that growth in factor movement has been decreasing or at least stagnating at the same time. However, the data on the Foreign Direct Investment (FDI) outward position of OECD countries by industry indicate that just in the last thirteen years, investment in the services sector has multiplied by 7, largely surpassing investment growth in the manufacturing and in the primary sectors (see Figure2).
The purpose of this paper is to investigate this puzzle by empirically analyzing the relationship between Mode 1 and Mode 3. We use bilateral data on US Majority-Owned Foreign Affiliate operations (MOFAs) both for the services and goods sectors as well as for cross-border trade in services and trade in goods4. We analyze this relationship using two estimation techniques, the first is intended to clear the relationship from common fac-tors affecting both flows at the same time, and the second to control for endogenous variables.
mentation of production and the consequent increase of offshore services, somehow related
to new communication technologies, see for instanceAmiti and Wei(2005) andMarkusen
(1989).
3Among empirical analysis in this line are those ofFreund and Weinhold(2002) and
Lennon (2006). Freund and Weinhold demonstrated that internet penetration has
in-creased exports of services to the United States, and Lennon, making use of data on bilateral trade in services and trade in goods for OECD countries, found that variables describing “communication technologies” have more impact on services trade than on trade in goods.
4
We concentrate our analysis on US transactions since it is the only country compiling commercial presence and cross-border trade in services by partner country (and with interesting further classifications) data , but conclusions must be considered with caution, the case of the United States can hardly be consided as representative.
Outward Position (1990-2003) 0 100 200 300 400 500 600 700 800 1990 1991 1992 1993 1994 1995 1996 1997 1998 1999 2000 2001 2002 2003 year Index (1990=100)
MANUFACTURING PRIMARY SECTOR SERVICE SECTOR
Source: OCDE
Countries: Australia, Austria, France, Germany, Iceland, Italy, Netherlands, United Kingdom, United States.
Figure 2: FDI outward position
There is some anecdotal evidence in the services sector supporting the idea that different modes of supply facilitate each other. In the work of Chanda (2006) the author considers case studies of services sector firms with overseas operations and concludes that there are strong facilitating relationships across modes. One example described is that of the multi-national company Ernst and Young. Through subsidiaries and offices in locations such as Boston, Paris and Munich, Ernst and Young has a very strong physical overseas presences (Mode 3). The execution of the projects of its clients usually requires staffing with certified accountants, which often involves deployment of employees across the company’s worldwide offices (Mode 4). Finally, Ernst and Young also provides on-line services such as provision of customized news and information and access to on-line cus-tomized data bases (Mode 1).
The reason for studying the relationship between cross-border trade and commercial presence is not only to have a better understanding of the deter-minants and pattern of trade in services but also to be aware of the effects of commercial policies. This is of particular importance because the proposal of liberalization by member countries under GATS and by regional agree-ments are categorized by services sector and mode of supply. Accordingly, where different modes of supply complement or substitute each other, trade
policy measures taken in one mode may affect the supply of services traded in another mode. However, little research has been conducted on the inter-relations between these modes of supply. The only attempt to empirically assess these interrelations is that of Gr¨unfeld and Moxnes (2003). In their work they analyze the relationship between Mode 1 and Mode 3 for the OECD countries finding evidence of complementarity. One caveat of their work is due to the lack of bilateral data on Mode 3, hence they conducted the analysis relying on estimations of bilateral FDI stocks in services.
This paper is organized as follows: in Section2 we review the literature on the relationship between trade and foreign investment. Given the lack of services research we review the manufacturing literature on this topic; in Section 3 we present some stylized facts on the US data and we present the data on Mode 3 and Mode 1; Section4 dicusses our results and finally, Section5 concludes.
2
Literature review
2.1 Theoretical relationship between trade and Foreign
Di-rect Investment (FDI)
Once the theory of the firm allows for different stages of production to be geographically dispersed5 two distinctive types of foreign investment arise; horizontal and vertical FDI. In a horizontal FDI the firm duplicates just a subset of its activities setting up a same (horizontal) stage of the production process. One example of that is when a firm develops a new production plant in a foreign (host) country intended to locally serve that market. When a firm decides to put all of its production of a particular component part in a separate foreign plant, this type of split is called a vertical division and refers to the breaking of the value-added chain (i.e. Vertical FDI).
For each type of FDI there is a distinct reason for a firm to invest abroad. In the case of horizontal FDI, it may want to avoid costs associated with cross-border trade by supplying a market directly through an affiliate (the horizontal investment then is mainly driven by final product market size and transport cost of final products)6. Second, it may want to exploit differences in factor prices among different countries by splitting its production process geographically through vertical investment (the investment is mainly driven
5
See for instance the theoretical works ofBrainard(1993) andGrossman et al.(2006).
6Another factor commonly cited as determinant of horizontal FDI are firms scales
by factor and input market considerations)7.
Moreover, theory expects for each type of investment to have a different effect on trade. From the perspective of the horizontal investment, FDI can be seen as a substitute of trade, as exports are replaced by local sales on foreign markets. In the case of vertical investment, FDI and trade can be seen as complements since investing abroad leads to greater trade in intermediate goods (inputs) to the affiliate.
As indicated by Navaretti and Venables (2004), at least until recent years, there has been a consensus that the overwhelming proportion of FDI has been horizontal rather than vertical, since FDI originates and goes pre-dominantly to developed countries (it appears that FDI flows seek market access instead of differentials on factor costs, a behavior rather associated to horizontal Investment). Hence one should expect from the empirical evi-dence to find a substitution relationship between FDI and trade8.
2.2 Empirical relationship between trade and FDI
However, empirical studies usually find a complementarity relationship9. Foreign markets are served through both exports and FDI, countries receiv-ing high levels of exports also host large amounts of foreign direct invest-ment10. Exceptions to these findings exist when more disaggregated data or product-level data are used instead, which allows to separately identify each type of investment, and then to analyze the complementarity and substi-tutability relationship where the firms theory applies. Accordingly, Bloni-gen(2001) found that Japanese affiliate employment in US plants producing specific auto parts was negatively related to Japanese exports of those same products (exports vs. horizontal FDI). Conversely, he also found a comple-mentary relationship when analyzing the location of Japanese automobile parts production in the United States and Japanese exports of automobile parts to the United States (exports vs. vertical FDI).
Similarly,Head and Ries(2001), using firm-level data on Japanese man-ufacturers from 1965 to 1989, found that FDI substitutes the exports of 19
7
Another factor commonly cited as determinant of vertical FDI are the plant scales economies.
8
Similarly inBrainard(1997) the author also finds that multinational activity is more
likely the more similar are the home and foreign markets.
9
Some articles finding a complementarity relationship are those ofLipsey and Weiss
(1981) andClausing K. A.(2000).
10For a complete review of the empirical literature on FDI and Trade seeHead and Ries
large Japanese electronic and automobile assemblers, which are not verti-cally integrated and, therefore, typiverti-cally do not supply overseas affiliates.
3
Stylized Facts and data on cross-border trade
(Mode 1) and sales by affiliates (Mode 3)
3.1 Sales by affiliates dataIn order to describe the commercial presence for both goods and services, we make use of the US Foreign Affiliates Trade Statistics (FATS). These data are published by the US Bureau of Economic Analysis (BEA) and they are drawn from benchmark and annual sample surveys of US direct investment abroad. The survey collects operating and financial data of US companies and their foreign affiliates, such as balance sheets, income statements, em-ployment and compensation of employees, trade in goods, and sales of goods and services.
Specifically, we gather the information on sales by US majority-owned foreign affiliates (exports of Mode 3 in the case of services). The advantage of using the US data is that sales by affiliates have been classified according to their destination (to local market, export to the United States and export to third countries), to the type of products being sold (goods or services), to the country of residence of the affiliate as well as to whether the sale is being carried inside the firm’s boundaries (affiliated or unaffiliated sale).
3.2 Data on cross-border trade in services
Bilateral US trade in services have been drawn form US Balance of Pay-ment accounts published by BEA with the advantage that data have been classified by type of affiliation and by services sectors.
3.3 US stylize facts
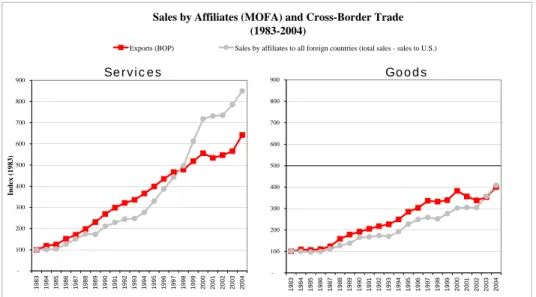
As mentioned in the abstract, not only is commercial presence the main mode of supply of US service exports, but it has also been growing at a faster rate than Mode 1. Estimations of US Trade in services by modes of supply prepared by Benassy-Quere et al. (2006) indicate that in 2000 83 percent of the international trade in services was supplied by Mode 3 and that only 10 percent was supplied by Mode 1 . From Figure 3, which compares US’s trends on exports (Mode 1) and sales by affiliates (Mode 3) for both services and goods, two very interesting facts can be gleaned, first,
the surprising growth of trade in services in Mode 1 has not been followed by a decrease in services trade in Mode 3. Even more, the last mode has been growing at a faster pace. Second, both modes of service supply have been increasing faster than exports and sales by affiliated in the case of goods.
Sales by Affiliates (MOFA) and Cross-Border Trade (1983-2004) -100 200 300 400 500 600 700 800 900 1983 1984 1985 1986 1987 1988 1989 1990 1991 1992 1993 1994 1995 1996 1997 1998 1999 2000 2001 2002 2003 2004 Inde x ( 1983)
Exports (BOP) Sales by affiliates to all foreign countries (total sales - sales to U.S.)
Source : BEA, benchmark and annual sample surveys of U.S. Parent firms and their affiliates abroad and balance of payments Services Goods -100 200 300 400 500 600 700 800 900 1983 1984 1985 1986 1987 1988 1989 1990 1991 1992 1993 1994 1995 1996 1997 1998 1999 2000 2001 2002 2003 2004
Figure 3: BOP Exports v/s Sales by Affiliates
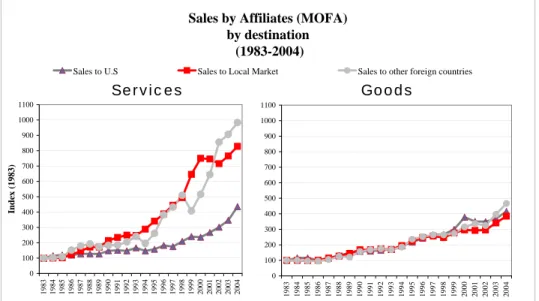
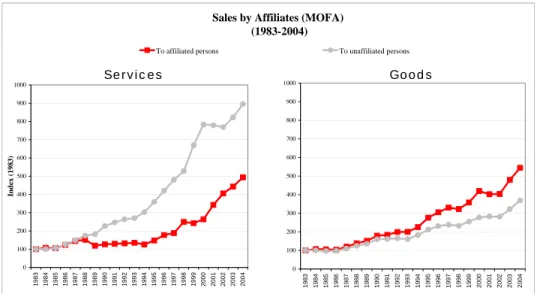
Figure 4and Figure5 are interesting since they give us some indication about the reasons why a US multinational would want to invest abroad. Fig-ure 4 describes separately the trends of sales by US affiliates abroad back to the United States (home), to the local (host) market as well as to third countries (different from host and home countries). In the case of goods, the three types of destinations have been growing at similar pace. In the case of services, on the other hand, sales to local and to third countries have increased much faster than those going back to the US. Figure5 describes growth of sales by affiliates with destination to affiliated and unaffiliated per-sons. The value of services sales to unaffiliated persons have been increasing at a faster rate than that to affiliated persons, and the inverse situation happened in the case of sales of goods where sales to affiliated persons have increased much faster than those to unaffiliated persons.
With respect to these two figures, it can reasonably be assumed that plants with large exports back to the US and to affiliated persons constitute vertical FDI. Similarly, we can reasonably assume that sales to the local
country and to unaffiliated persons are associated to horizontal FDI11.
Sales by Affiliates (MOFA) by destination (1983-2004) 0 100 200 300 400 500 600 700 800 900 1000 1100 1983 1984 1985 1986 1987 1988 1989 1990 1991 1992 1993 1994 1995 1996 1997 1998 1999 2000 2001 2002 2003 2004 Index (1983)
Sales to U.S Sales to Local Market Sales to other foreign countries
Source : BEA, benchmark and annual sample surveys of U.S. Parent firms and their affiliates abroad
Services Goods 0 100 200 300 400 500 600 700 800 900 1000 1100 1983 1984 1985 1986 1987 1988 1989 1990 1991 1992 1993 1994 1995 1996 1997 1998 1999 2000 2001 2002 2003 2004
Figure 4: Sales by affiliates by destination
Considering the three figures together, cross-border trade and the com-mercial presence have been following the same growing pattern for both services and goods (which can be considered, in both cases, as a signal of complementarity between trade and FDI). In the case of goods, these trends have been followed by an important increase in sales to affiliated persons (vertical FDI) which is in line with the firms theory. By contrast, in the services case, these trends have been followed by a high increase in sales serving unaffiliated persons and those serving the host market (horizontal FDI). This fact implies that the source of complementarity could be different for services and for goods. Moreover, it seems that the global phenomenon of fragmentation of production is rather associated to the goods sectors than to the services sectors.
11Although exports to third countries could either be traded within vertical production
Sales by Affiliates (MOFA) (1983-2004) 0 100 200 300 400 500 600 700 800 900 1000 1983 1984 1985 1986 1987 1988 1989 1990 1991 1992 1993 1994 1995 1996 1997 1998 1999 2000 2001 2002 2003 2004 Index (1983)
To affiliated persons To unaffiliated persons
Source : BEA, benchmark and annual sample surveys of U.S. Parent firms and their affiliates abroad and balance of payments Services Goods 0 100 200 300 400 500 600 700 800 900 1000 1983 1984 1985 1986 1987 1988 1989 1990 1991 1992 1993 1994 1995 1996 1997 1998 1999 2000 2001 2002 2003 2004
Figure 5: Affiliated vs. Unaffiliated Sales
4
Empirical implementation
For the empirical analysis we use a set of gravity equations to explain both bilateral trade and sales by affiliates. The gravity equation is a log-linear specification, relating bilateral flows from country’ i to country j as being proportional to countrys masses (Y) and inversely related to their bilateral distance. Its logarithmic form takes the following specification:
ln(F lowij) = β0+ β1ln(Yi) + β2ln(Yj) + β3ln(Distij) + βzZ + µij
The empirical success of the gravity model for explaining bilateral trade patterns is well documented and has a rich history beginning withTinbergen (1962). Furthermore, The model is firmly grounded by economic theory (See Baier and Bergstrand(2001) for more details).
Even though, the empirical implementation of the gravity model for explaining cross-border foreign investment is more recent, the findings indi-cate that just as trade volumes are deterred by geographical distance and
boosted by market size, so are volumes of FDI12. Indeed, this model explains around 70-80 percent of cross-country variation in FDI and multinational activities13.
Our empirical analysis is divided into two sections. The first section consists of a set of regression where trade is explained by affiliates’ sales. In order to shed some light on the differences between trade in goods and trade in services, the same exercise is conducted for both types of products, we will name this set of regressions, for the reasons that we will explain hereafter, the naive regressions. In the second section we use a cross-price elasticity approach, which is deemed to overcome some caveats of the first set of regressions.
All regressions are estimated using Ordinary Least Square (OLS) and in-ferences are based on robust standard errors14. Additionally, all estimations include the same set of gravity explanatory variables namely: we include the GDP of partner country (as indicator of market size) and a set of variables depicting bilateral transaction costs between the US and their partners. The variables included in this set are: the bilateral distance between Washington and each partner’s capital cities, a dummy variable indicating if a language is spoken by at least 9 percent of the population in both countries, another indicating if the partner share a border with the US (Mexico and Canada), and finally a dummy variable to indicate if the partner does not have a see share (landlocked). Additionally, all regressions include dummy year variables.
4.1 Naive regressions
As indicated this set of regressions explain cross border exports of services (exports of Mode 1) by sales of services by affiliates (export of Mode 3). We also conduct the same exercise for the case of goods, that is, we explain exports of goods by sales of goods by affiliates15.
Using this estimation approach gives rise to two statistical concerns.
12
Even though, from the firms theory, trade costs (proxied by distance) should affect the decision to undertake investment abroad, there are no theoretical foundations why distance should negatively matter for the volume of sales by affiliates.
13
See for instance the work ofBrainard(1997),Shatz and Venables(2000) andClausing
K. A.(2000).
14
The presence of heteroskedasticity has been largely recognized in the works estimating
gravity equations ( seeSilva and Tenreyro(2005)).
15
Some authors have already carried this type of analysis for the case of the manufac-turing sector. Lipsey-Weiss-1981 and Clausing-2000 found a positive relationship using local production and sales by US affiliates.
Firstly, the positive relationship could be spurious, which means that it could be due to other factors not included in the regressions which simultaneously affect trade and sales in a similar direction. The second statistical concern is related to the use of endogenous explanatory variables. From the firms theory, a firm decides whether to serve a foreign market by exporting goods or by locating a plant guided by a third factor, this trade-off means that exports and FDI are simultaneously determined, in this respect both exports and FDI are endogenous variables. Additionally, the model could suffer from inverse causality. For instance, it would be reasonable to think that firms locate in markets that firms already know through exporting.
The use of the gravity variables in our regressions intends to solve the first statistical problem. It has been proven that these variables explain more than 70 percent of the variance in FDI and in Trade, hence their inclusion in our estimations would serve to control for factors affecting both flows at the same time. With respect to the endogeneity problem, we address it in the second part of the empirical analysis using a cross-price elasticity approach. For the reasons indicated above the results presented in this first part must be considered with caution, they are not evidence of causality but (rather) they depict the relationship 16 between trade and FDI after con-trolling for common factors affecting these two flows. Nonetheless, we es-timate that the comparative exercise between the case of goods and that of services is worth carrying, since a priory17 there are no reasons to think that endogeneity concerns are acting differently in each case, accordingly, the comparison might not lose its validity.
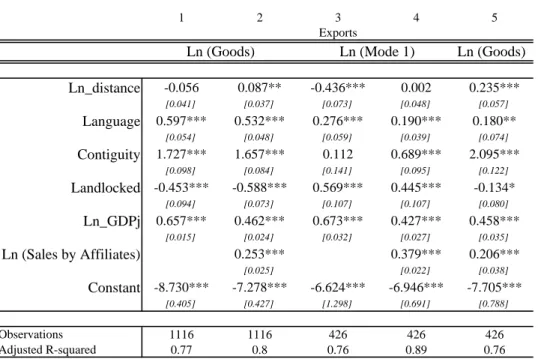
Figure 6 presents the results when total sales by affiliates is used as an explanatory variable. The dependent variable in columns 1, 2 and 5 are exports of goods18 and in columns 3 and 4 are services exports of Mode 119. Following the indications of WTO (2006) on the allocation of services sta-tistics from the balance of payments to modes of supply, we construct Mode 1 by subtracting travel and construction services from services exports20.
16
Better than simply estimating their correlations.
17There is no different firm theory for the services sector nor research analyses looking
for differences between these two sectors with respect to the relationship between exports and FDI.
18
Data on trade in goods are drawn from Comtrade.
19
Variables in natural logarithm are prefixed by Ln.
20Travel services should be allocated as Mode 2 (i.e. consumption abroad). Even if
BOP construction statistics include some components that should be allocated as Mode 1, they also count for components that should be allocated as Mode 3. Unfortunately the level of aggregation of our data does not allow us to extract those components, hence their inclusion in our estimations should generate a positive bias in the coefficients of interest.
10/09/2007 C:\Documents and Settings\Carolina Lennon\Mes documents\Tesis\3
Paper\Regressions\Regressions\Regressions to include in final document\MOFAS_1_interaction FINAL petit.xls 1 2 3 4 5 Ln (Goods) -0.056 0.087** -0.436*** 0.002 0.235*** [0.041] [0.037] [0.073] [0.048] [0.057] 0.597*** 0.532*** 0.276*** 0.190*** 0.180** [0.054] [0.048] [0.059] [0.039] [0.074] 1.727*** 1.657*** 0.112 0.689*** 2.095*** [0.098] [0.084] [0.141] [0.095] [0.122] -0.453*** -0.588*** 0.569*** 0.445*** -0.134* [0.094] [0.073] [0.107] [0.107] [0.080] 0.657*** 0.462*** 0.673*** 0.427*** 0.458*** [0.015] [0.024] [0.032] [0.027] [0.035] 0.253*** 0.379*** 0.206*** [0.025] [0.022] [0.038] -8.730*** -7.278*** -6.624*** -6.946*** -7.705*** [0.405] [0.427] [1.298] [0.691] [0.788] Observations 1116 1116 426 426 426 Adjusted R-squared 0.77 0.8 0.76 0.89 0.76
All estimations regressed using dummy year. Robust standard errors in brackets
* significant at 10%; ** significant at 5%; *** significant at 1%
Landlocked Ln_GDPj Ln (Sales by Affiliates) Constant Exports Ln_distance Language Contiguity Ln (Goods) Ln (Mode 1) MOFAS_1_interaction (2)
Figure 6: Naive regressions 1
Regressions 1 to 4 are estimated using the full set of available observa-tions for each type of product (services and goods), in regression 5 the goods sample is restricted to the countries and the years for which data on services are available21. For both unrestricted and restricted samples as well as for both type of products the coefficients on total sales by affiliates are positive and highly significant. However, in the case of services this coefficient is of a larger magnitude. Taking columns 4 and 6, we test using interaction terms if this difference in coefficients is statistically significant; the result indicates that, with 1 percent confidence, the impact of sales in services on Mode 1 is 0.173 higher than the impact of affiliates sales of goods on exports of goods
22.
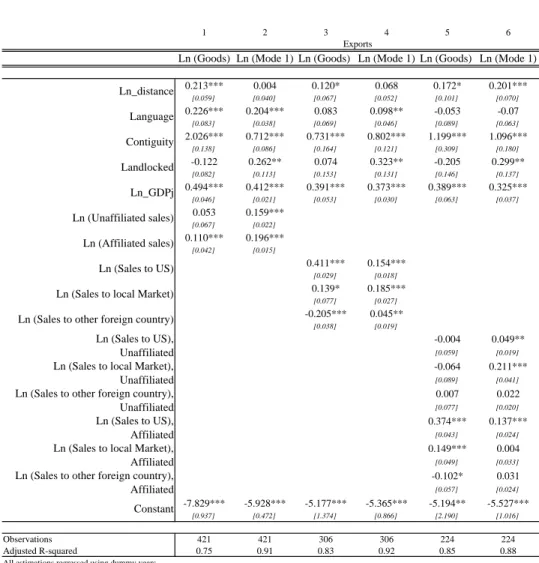
In the next set of regressions presented in Figure 7 we take advantage of the further classification of the data on sales. In the first two columns
21Data on services include 32 US partner countries and covers the period from 1986 to
2004.
22This interaction term analysis has been carried for this and the following comparisons,
10/09/2007C:\Documents and Settings\Carolina Lennon\Mes documents\Tesis\3 Paper\Regressions\Regressions\Regressions to include in final document\MOFAS_1_interaction FINAL petit.xls
1 2 3 4 5 6
Ln (Goods) Ln (Mode 1) Ln (Goods) Ln (Mode 1) Ln (Goods) Ln (Mode 1)
0.213*** 0.004 0.120* 0.068 0.172* 0.201*** [0.059] [0.040] [0.067] [0.052] [0.101] [0.070] 0.226*** 0.204*** 0.083 0.098** -0.053 -0.07 [0.083] [0.038] [0.069] [0.046] [0.089] [0.063] 2.026*** 0.712*** 0.731*** 0.802*** 1.199*** 1.096*** [0.138] [0.086] [0.164] [0.121] [0.309] [0.180] -0.122 0.262** 0.074 0.323** -0.205 0.299** [0.082] [0.113] [0.153] [0.131] [0.146] [0.137] 0.494*** 0.412*** 0.391*** 0.373*** 0.389*** 0.325*** [0.046] [0.021] [0.053] [0.030] [0.063] [0.037] 0.053 0.159*** [0.067] [0.022] 0.110*** 0.196*** [0.042] [0.015] 0.411*** 0.154*** [0.029] [0.018] 0.139* 0.185*** [0.077] [0.027] -0.205*** 0.045** [0.038] [0.019] -0.004 0.049** [0.059] [0.019] -0.064 0.211*** [0.089] [0.041] 0.007 0.022 [0.077] [0.020] 0.374*** 0.137*** [0.043] [0.024] 0.149*** 0.004 [0.049] [0.033] -0.102* 0.031 [0.057] [0.024] -7.829*** -5.928*** -5.177*** -5.365*** -5.194** -5.527*** [0.937] [0.472] [1.374] [0.866] [2.190] [1.016] Observations 421 421 306 306 224 224 Adjusted R-squared 0.75 0.91 0.83 0.92 0.85 0.88
All estimations regressed using dummy years. Robust standard errors in brackets
* significant at 10%; ** significant at 5%; *** significant at 1%
Landlocked Ln_GDPj Ln (Unaffiliated sales) Ln (Affiliated sales) Exports Ln_distance Language Contiguity Ln (Sales to US) Ln (Sales to local Market) Ln (Sales to other foreign country) Ln (Sales to US),
Unaffiliated
Ln (Sales to other foreign country), Affiliated Constant Ln (Sales to local Market), Unaffiliated Ln (Sales to other foreign country), Unaffiliated Ln (Sales to US), Affiliated Ln (Sales to local Market), Affiliated
MOFAS_1_interaction (3)
Figure 7: Naive regressions 2
sales are classified by the type of affiliation (sales to affiliated persons or to unaffiliated persons), in columns 3 and 4 by destination of the sale (going back to the US, serving the local market or serving another foreign country), and in the last two columns by both classifications (by type of affiliation and by destination). The results indicate that, in the case of services, the relationship between commercial presence and trade is always positive and that in 8 out of 11 of the cases this relationship seems to be higher than that found in the case of goods.
Additionally, the positive relationship between commercial presence in services and Mode 1 continues to be significant even in the case of unaffiliated sales (columms 2 and 6). Differently, in the case of goods, this positive relation is only significant for affiliated sales and it is negative (although, non significant) for half of the cases depicting sales of goods to unaffiliated persons (columns 1 and 5). Moreover, regarding the destination of sales, the highest positive relationship in services is observed in the case of sales intended to serve the local market (columns 4 and 6), and for the case of goods, it is observed in the sales going back to the US (columns 3 and 5).
These results are in line with our original intuition presented in the styl-ized facts section. They tell us that the source of this positive relationship might differ in each case. For the goods case, the positive relationship only shows up in the cases of affiliated sales and mainly in the sales going back to the US. Then this positive relationship must result from the breaking of the value-added chain (i.e. vertical FDI) as predicted by firms theory. By contrast, in the case of services this relationship is always positive but even more, it seems to be mainly associated to the services sales intended to serve the local market (i.e. horizontal FDI) and this last finding challenges the firms theory.
4.2 Cross-price elasticity
However, as indicated above, the positive relationship might be just due to the inclusion of endogenous explanatory variables in the model. In order to solve this problem, this section analyzes the relationship between commercial presence and trade using the cross-price elasticity approach. This approach has been already carried in the works of Amiti and Wakelin (2003) and Clausing K. A.(2000) for the manufacturing sector. The procedure analyzes trade and commercial presences as being respectively explained by the cost of investing abroad and by the cost of exporting. The substitutive relationships is found when a rise in the cost of FDI raises exports or when an increase in the cost of exporting induces more FDI.
We use restriction measures in order to describe the cost of carrying each type of flows (i.e. exports and investment) as well as for each types of prod-ucts (i.e. services and goods). Since the measures on services restrictions as well as those related to FDI restrictions are based on frequency indexes to facilitate the comparison, we thus report beta standardized coefficients.
In Figure8we describe the cost of exporting and investing in the services sector by using the indicator elaborated by Langhamme (2005) on the EU offers (proposals) under the GATS negotiations. The assessment has been
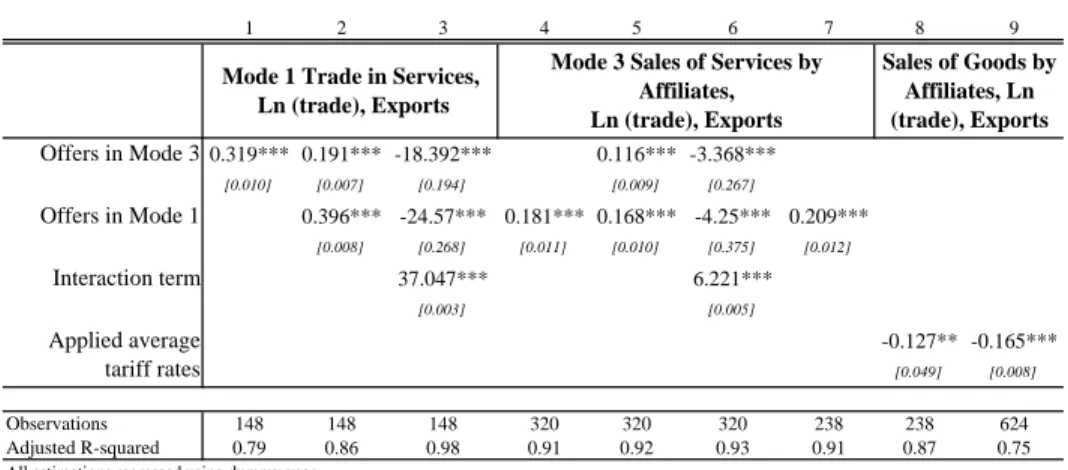
carried by country and by mode of supply 23 and the index score values range from 0 to 100. A score of 100 for a given mode of supply and a given country implies that there is full commitment to liberalization (none in GATS terminology) in all sectors. A score of 0 means that there is no commitment in any sector at all (unbound). Columns 1 to 3 report the results from regressing exports of Mode 1: on the offers under GATS in Mode 3 (col. 1), on the offers in Mode 3 and those in Mode 1 (col. 2), finally on the offers in Mode 3, the offers in Mode 1 and their interaction term (col. 3). We include the last variable as another way to account for the interdependence between modes of supply; if the different modes of supply are in some way interdependent then, the impact of liberalizing one mode of supply must be subordinated to the stage of liberalization in the other mode. For instance, if both modes are complements, the potential benefit of trade liberalization in one mode must be lower than expected when the other mode of supply remains highly restricted, in such a case we expect a positive coefficient on the interaction term (negative if substitutes, and 0 if there are no statistically significant relationship). The analysis implemented in columns 1 to 3 is reversed in columns 4 to 6 in order to explain exports of Mode 3. Finally, columns 7 to 9 are added in order to compare the case of services with that of goods, specifically they compare the impact of the offers in Mode 1 on exports of Mode 3 (col. 7) with that of the applied tariff rates on sales of goods (col. 8 and 9)24.
Results confirm the complementarity relationship between modes of sup-ply. The coefficients on the offers in Mode 3 have always a positive and highly significant impact on cross-border trade in services (col. 1 and 2). Similarly, the coefficients on the offers in Mode 1 have a high and significant impact on exports of Mode 3 (col. 4 and 5). Moreover, the interaction terms in both cases are positive and highly significant (col. 3 and 6)25. Finally, even if in the case of goods there exists evidence of complementarity between trade
23Which allows us to evaluate the relationship in both directions, trade explained by
cost of investing and commercial presence explained by cost of exporting.
24Data on tariff for the manufacturing sector and mining products are drawn from
UNCTAD Handbook of Statistics.
As we are working with a comparable sample of observations for both types of products in the regressions reported in columns 7 and 8, only the European countries have been included in their estimations. However, given that those countries belong to a same custom union then the variance in external tariff among European countries must be low, this in turn might be lowering the significance of the coefficient on tariff (col. 8). Therefore, in order to increase the variance in this variable we include column 9 which reports the results using the unrestricted sample (i.e. all available observations relating to the goods sector).
25
02/09/2007
C:\Documents and Settings\Carolina Lennon\Mes documents\Tesis\3 Paper\Regressions\Regressions\Regressions to include in final document\OMC Offers.xls
1 2 3 4 5 6 7 8 9 0.319*** 0.191*** -18.392*** 0.116*** -3.368*** [0.010] [0.007] [0.194] [0.009] [0.267] 0.396*** -24.57*** 0.181*** 0.168*** -4.25*** 0.209*** [0.008] [0.268] [0.011] [0.010] [0.375] [0.012] 37.047*** 6.221*** [0.003] [0.005] -0.127** -0.165*** [0.049] [0.008] Observations 148 148 148 320 320 320 238 238 624 Adjusted R-squared 0.79 0.86 0.98 0.91 0.92 0.93 0.91 0.87 0.75
All estimations regressed using dummy year. Constant an gravity variables estimated but not reported Robust normalized beta coefficients
Robust standard errors in brackets
* significant at 10%; ** significant at 5%; *** significant at 1%
Offers in Mode 1 Interaction term Applied average tariff rates Sales of Goods by Affiliates, Ln (trade), Exports Mode 1 Trade in Services,
Ln (trade), Exports
Mode 3 Sales of Services by Affiliates, Ln (trade), Exports
Offers in Mode 3
WTO Commitments (4)
Figure 8: Cross price elasticity analysis
and FDI, it seems to be lower than that found in the case of services (col. 7 against col. 8 and col. 9)26.
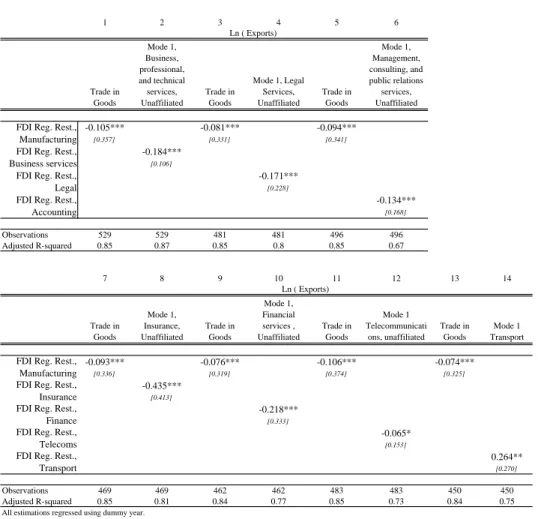
In the paragraphs to follow we analyze if the complementarity relation-ship previously found is also present at the services sectoral level. We regress unaffiliated cross-border trade in services (by sectors) on restrictions on FDI (by sectors)27. For the restrictions on FDI we use the FDI regulatory re-strictiveness index prepared byKoyama and Golub(2006). This assessment accounts for 42 countries (of which 29 are OECD countries), 8 services sec-tors and the manufacturing sector. The index aims primarily to measure deviations from national treatment (i.e. discrimination against foreign in-vestment rather than the institutional environment). Specifically it accounts for: limitations on foreign ownership, special screening procedures which
offers in Mode 3 takes the value of 18.655.
26
We should keep in mind that the “offers” index must be underestimating the real state of countries’ liberalization (e.g. one country could set a sector and a mode as being “unbounded” while the actual policy practice in that sector and that mode could be quite liberal), therefore the coefficient on our “offer” variable might underestimate the impact of services sector liberalization on services trade, by that it can be underestimating the effect of exporting and investing. In contrast, in the case of goods, we account for a measure that must be closer to the actual policy than that used in the case of services, as we are using the applied tariff rates.
27For each regression we conduct the comparative analysis, that is, using the comparable
set of observations we regress trade in goods on the FDI regulatory restrictiveness index in manufacturing.
02/09/2007C:\Documents and Settings\Carolina Lennon\Mes documents\Tesis\3 Paper\Regressions\Regressions\Regressions to include in final document\FDI restrictions.xls 1 2 3 4 5 6 Trade in Goods Mode 1, Business, professional, and technical services, Unaffiliated Trade in Goods Mode 1, Legal Services, Unaffiliated Trade in Goods Mode 1, Management, consulting, and public relations services, Unaffiliated -0.105*** -0.081*** -0.094*** [0.357] [0.331] [0.341] -0.184*** [0.106] -0.171*** [0.228] -0.134*** [0.168] Observations 529 529 481 481 496 496 Adjusted R-squared 0.85 0.87 0.85 0.8 0.85 0.67 7 8 9 10 11 12 13 14 Trade in Goods Mode 1, Insurance, Unaffiliated Trade in Goods Mode 1, Financial services , Unaffiliated Trade in Goods Mode 1 Telecommunicati ons, unaffiliated Trade in Goods Mode 1 Transport -0.093*** -0.076*** -0.106*** -0.074*** [0.336] [0.319] [0.374] [0.325] -0.435*** [0.413] -0.218*** [0.333] -0.065* [0.153] 0.264** [0.270] Observations 469 469 462 462 483 483 450 450 Adjusted R-squared 0.85 0.81 0.84 0.77 0.85 0.73 0.84 0.75
All estimations regressed using dummy year. Constant an gravity variables estimated but not reported Robust normalized beta coefficients
Robust standard errors in brackets
* significant at 10%; ** significant at 5%; *** significant at 1%
Ln ( Exports) Ln ( Exports)
FDI Reg. Rest., Insurance FDI Reg. Rest., Finance FDI Reg. Rest., Telecoms FDI Reg. Rest., Transport FDI Reg. Rest., Manufacturing FDI Reg. Rest., Manufacturing FDI Reg. Rest., Business services FDI Reg. Rest., Legal FDI Reg. Rest., Accounting
Figure 9: Cross price elasticity analysis
only apply to foreign investors, as well as post-entry management and other operational restrictions. Restrictiveness is measured on a 0-to-1 scale, with 0 representing full openness28.
Results presented in Figure 9 indicate that the magnitude of this com-plementarity differs among services sectors. The comcom-plementarity between trade and FDI is found in 6 out of 7 services sectors29. It is worth noting
28
The negative coefficients on this variable indicate presence of complementarity
29The only sector presenting a substitutive relationship is the transport sector. This
sector is generally characterized as been highly concentrated and highly monopolized.
that all services sectors presenting this complementarity belong to “other commercial services”, and the last, as indicated in the introduction, has been the most dynamic services sector in cross-border trade in services over the past two decades. Additionally, in 5 out of 7 services sectors this com-plementarity relationship seems to be higher than that found in the case of goods. Finally, as we are only regressing unaffiliated exports of Mode 1 as dependent variable, this results reinforce the previous findings from the naive regressions section, the complementarity in services sectors is also found at the level of horizontal FDI.
5
Conclusion
Using US bilateral data this article analyzes the relationship between com-mercial presence and trade in the services sector. As a matter of comparison the same analysis is conducted for the case of goods. After controlling for endogeneity using the cross-price elasticity approach we found evidence of complementarity between trade and commercial presences. This positive re-lationship persists even when we include in the regression unaffiliated data on both sales by affiliates and cross-border trade (i.e. horizontal FDI). More-over this relation seems to be larger in the case of services than that found in the case of goods. Finally when the analysis is carried at services sec-toral level, we found differences in the magnitude of this relationship across services sectors, however this complementarity relationship is found in all the ”other commercial services” which has been the most dynamic services sector in cross-border trade in services over the past two decades.
The results have implications for both policy and theory. Regarding the policy implications, this complementarity in services sectors must imply that the potential benefit of trade liberalization in one mode must be lower than expected when the other mode of supply remains highly restricted. Accordingly, policymakers had to consider this interrelationship in order to obtain the desired effects from trade liberalization negotiations. With reference to the firms theory, the results seem to indicate that the source of complementarity could be different for services and for goods. For the goods case, this positive relationship must result from the breaking of the value-added chain (i.e. vertical FDI) as predicted by firms theory. In contrast, in the case of services this relationship seems to be mainly associated to the sales by affiliates intended to serve the local market (i.e. horizontal FDI) which challenges the firms theory.
References
Amiti, M. and K. Wakelin (2003, October). Investment liberalization and international trade. Journal of International Economics 61 (1), 101–126. Amiti, M. and S.-J. Wei (2005). Fear of service outsourcing: is it justified?
Economic Policy 20 (42), 308–347.
Baier, S. L. and J. H. Bergstrand (2001, February). The growth of world trade: tariffs, transport costs, and income similarity. Journal of Interna-tional Economics 53 (1), 1–27.
Benassy-Quere, A., C. Schwellnus, and D. Unal-Kesenci (2006). Echanges internationaux : services compris. La Lettre du CEPII .
Blonigen, B. A. (2001). In search of substitution between foreign production and exports. Journal of International Economics 53 (1), 81–104.
Brainard, S. L. (1993, Feb). A Simple Theory of Multinational Corpora-tions and Trade with a Trade-Off Between Proximity and Concentration. NBER Working Papers 4269, National Bureau of Economic Research, Inc. available at http://ideas.repec.org/p/nbr/nberwo/4269.html.
Brainard, S. L. (1997, sep). An Empirical Assessment of the Proximity-Concentration Trade-off Between Multinational Sales and Trade. The American Economic Review 87 (4), 520–544.
Chanda, R. (2006, January). Inter-modal Linkages in Services Trade. OECD Trade Policy Working Papers 30, OECD Trade Directorate. available at http://ideas.repec.org/p/oec/traaab/30-en.html.
Clausing K. A. (April 2000). Does multinational activity displace trade? Economic Inquiry 38, 190–205(16).
Freund, C. and D. Weinhold (2002, May). The Internet and International Trade in Services. American Economic Review 92 (2), 236–240.
Grossman, G. M., E. Helpman, and A. Szeidl (2006, September). Optimal integration strategies for the multinational firm. Journal of International Economics 70 (1), 216–238.
Gr¨unfeld, L. A. and A. Moxnes (2003). The Intangible Globalization: Ex-plaining the Patterns of International Trade in Services. Norwegian In-stitute of International Affairs, Working Papers (657).
Head, K. and J. Ries (2004). Exporting and FDI as Alternative Strategies. Oxford Rev Econ Policy 20 (3), 409–423.
Head, K. and J. Ries (February 2001). Overseas Investment and Firm Ex-ports. Review of International Economics 9, 108–122(15).
Koyama, T. and S. S. Golub (2006, December). OECD’s FDI Regulatory Restrictiveness Index: Revision and Extension to more Economies. OECD Economics Department Working Papers 525, OECD Economics Depart-ment. available at http://ideas.repec.org/p/oec/ecoaaa/525-en.html. Langhamme, R. J. (2005). The EU Offer of Service Trade Liberalization in
the Doha Round: Evidence of a Not-Yet-Perfect Customs Union. JCMS: Journal of Common Market Studies 43 (2), 311–325.
Lennon, C. (2006). Trade in Services and Trade in Goods: Differences and Complementarities.
Lipsey, R. E. and M. Y. Weiss (1981, November). Foreign Production and Exports in Manufacturing Industries. The Review of Economics and Sta-tistics 63 (4), 488–94.
Markusen, J. R. (1989, mar). Trade in Producer Services and in Other Specialized Intermediate Inputs. The American Economic Review 79 (1), 85–95.
Navaretti, G. B. and A. J. Venables (2004). Multinational Firms in the World Economy, pp. 336 pages. Princeton University Press.
Shatz, H. J. and A. J. Venables (2000, May). The Geography of International Investment.
Silva, J. S. and S. Tenreyro (2005, July). The Log of Gravity. CEP Discus-sion Papers dp0701, Centre for Economic Performance, LSE. available at http://ideas.repec.org/p/cep/cepdps/dp0701.html.
Tinbergen, J. (1962). Shaping the World Economy: Suggestions for an International Economy Policy .
WTO (2006, March). Measuring Trade in Services. WTO, World Trade Organization.