HAL Id: hal-00964775
https://hal.archives-ouvertes.fr/hal-00964775v2
Submitted on 22 Oct 2015
HAL is a multi-disciplinary open access
archive for the deposit and dissemination of
sci-entific research documents, whether they are
pub-lished or not. The documents may come from
teaching and research institutions in France or
abroad, or from public or private research centers.
L’archive ouverte pluridisciplinaire HAL, est
destinée au dépôt et à la diffusion de documents
scientifiques de niveau recherche, publiés ou non,
émanant des établissements d’enseignement et de
recherche français ou étrangers, des laboratoires
publics ou privés.
Short term effects of latex tapping on micro-changes of
trunk girth in [i]Hevea Brasiliensis[/i]
Junya Junjittakarn, Viriya Limpinuntana, Krirk Pannengpetch, Supat
Isarangkool Na Ayutthaya, Alain Rocheteau, Hervé Cochard, Frédéric Do
To cite this version:
Junya Junjittakarn, Viriya Limpinuntana, Krirk Pannengpetch, Supat Isarangkool Na Ayutthaya,
Alain Rocheteau, et al.. Short term effects of latex tapping on micro-changes of trunk girth in [i]Hevea
Brasiliensis[/i]. Australian Journal of Crop Science, 2012, 6 (1), pp.65-72. �hal-00964775v2�
65
AJCS 6(1):65-72 (2012) ISSN:1835-2707
Short term effects of latex tapping on micro-changes of trunk girth in Hevea Brasiliensis
Junya Junjittakarn
1, Viriya Limpinuntana
1*, Krirk Pannengpetch
1, Supat Isarangkool Na Ayutthaya
1,
Alain Rocheteau
2, Herve Cochard
3and Frederic C. Do
41
Department of Plant Science and Agricultural Resources, Faculty of Agriculture, Khon Kaen University, Khon
Kaen, 40002, Thailand
2
IRD, CEFE-CNRS, Montpellier F34060, France
3
INRA, UMR PIAF, BP10448, Clermont-Ferrand F-63000, France
4
IRD, UMR Eco&Sols, SupAgro-INRA, Montpellier F-34060, France
*
Corresponding author: viriya.kku@gmail.com
Abstract
Latex tapping has a well-known negative effect on the long term radial growth of rubber trees (Hevea Brasiliensis). The additional carbon sink induced by latex yield is considered as the main cause. However the potential contribution of a tapping induced w ater stress has received little attention. In Northeast Thailand, we applied an exploring approach comparing the diel cycle of girth change between days of rest and days with tapping in conditions of relatively stable evaporative demand and soil water availability. Trees were tapped at dark in the early morning for two consecutive days and rested for one day. Five standard trees were equipped with high accuracy girth bands above the tapping panel. The sampling included one tree with additional measurements, one below the tapping cut and the other at the trunk bottom. Data were recorded at 30 min interval over 14 days at the onset of the dry season in November. Results demonstrated a significant short-term shrinkage within two hours after tapping. However, the nighttime expansion maximum diurnal shrinkage and midnight recovery were not significantly influenced by the tapping cycle. As a result the daily growth was not negatively impacted on tapping days. Finally, in conditions of low average growth, our results refute th e hypothesis of a negative impact of tapping on radial growth at a daily scale through a simple dehydration. A substantial loss of tu rgor was confirmed but trees seem to quickly react and smooth the consequences on nighttime recovery and diurnal shrinkage.
Keywords: daily radial growth, latex tapping, nighttime expansion, rubber tree, trunk shrinkage.
Abbreviations: asl-above soil level; d0- one day of rest; d1-a first day of tapping; d2-a second day of tapping; L1-180 cm above soil
level; L2-70 cm above soil level; L3: 45 cm above soil level; 1/2S D2/3 -1/2 spiral cut, two consecutive tapping days and one rest day; V-voltage; VPD-vapour pressure deficit.
Introduction
Rubber tree (Hevea Brasiliensis) is one of the major economic crops in the tropics. It is grown for producing natural rubber by a deep tapping of the bark (Webster and Paardekooper, 1989). The latex yield is also positively related to the size of trees. Moreover rubber tree wood has become an important by-product. However, latex tapping has a well known negative impact on tree growth (Gooding 1952, Pardekooper 1989, Gohet 1996, Silpi et al., 2006). Radial growth of tapped trees is generally reduced by 50% compared to untapped trees. Hence maintaining the balance between tree growth and latex exploitation is an important challenge to insure long term latex yield and the highest wood production at the exploitation end. The challenge of growth maintenance is enhanced by the current extension of rubber growing in sub-optimal areas in term of water balance and temperature (Chandrashekar et al., 1996; Chandrashekar, 1997; Silpi et al., 2006, Isarangkool Na Ayutthaya et al., 2011). The “carbon sink hypothesis”, i.e. the derivation of carbohydrates to regenerate the latex exported by tapping, is considered as the main reason of the negative correlation between latex production and trunk radial growth (Silpi et al., 2006, 2007; Chantuma et al., 2009). The “water sink”
hypothesis is neglected particularly because the latex flow involves a minimum quantity of water which approximately represents less than 0.1 % of the daily transpiration as measured by xylem sap flow (Isarangkool Na Ayutthaya et al., 2010, 2011). However pioneer studies have shown that latex tapping induced a shrink of trunk girth corresponding to a substantial drop in turgor of bark tissues below the cut (Pykes, 1941; Gooding, 1952; Lustinec, 1969; Ninane, 1970). Moreover turgor is considered as the primary factor of cell enlargement and tissue potential growth (Lockhart, 1965; Calcagno et al., 2011). Hence following a “water sink hypothesis”, a local water stress induced by tapping could also contribute to the growth inhibition observed in tapped trees. Trunk girth or diameter changes as followed by micro-dendrometers express a natural daily cycle of shrinkage and expansion due to tissue water withdrawal for transpiration during day-time and tissue rehydration during night-time (Kozlowski, 1971; Daudet et al., 2004). The magnitude of the diurnal shrinkage depends of evaporative demand, soil water supply and tree regulation (Fernández and Cuevas, 2010). Silpi et al., (2006) show at the seasonal scale a significant relationship of change in radial growth as a function of
66
reference evapotranspiration and rainfall. And this relationship was disturbed for tapped trees, suggesting interaction between water stress and tapping. However, up to now, we are not aware of studies investigating the relationships between latex tapping and radial growth at the daily scale where water relations are mainly concerned. In the present study, we applied an exploring approach comparing the diel cycle of girth change between days with tapping and days of rest in conditions of relatively stable evaporative demand and soil water availability. The study was carried out in a mature stand, representative of rubber tree plantations in Northeast Thailand. As in the majority of Thailand, trees were tapped at night in the early morning for two days consecutively and then rest for one day. Five representative trees were equipped with high accuracy girth band above the tapping panel, including one tree with additional girth bands, one just below the tapping cut and one at the trunk bottom. The girth changes were recorded over 14 days at the onset of the dry season before growth cessation. For the experimental trees, the tapping occurred at 3:00 a.m. The diel cycle of girth change was divided in three main phases: the nighttime expansion between midnight and 6:30 a.m.; the maximum diurnal shrinkage, down to 14:00 a.m.; and the recovery, up to midnight. Then the daily growth corresponded to the 24 hours- change between respective midnight. Hence the general objective of the study was to test the hypothesis that, tapping negatively impacts growth at a daily scale through induced dehydration. The study had three steps. The first was to confirm the shrinkage after tapping and to assess the effect on nighttime expansion. We hypothesized first a large effect below the cut, and a much lower effect above the tapping panel, and second a negative impact on the nighttime expansion. The second step was to investigate the maximum diurnal shrinkage. We assumed that tapping mimics a drought effect by increasing the maximum diurnal shrinkage in the day-time following tapping. The third step was to analyze the consequence on the daily growth. We assumed a decrease of the daily growth on the days with tapping by comparison with the days of rest.
Results
Overall dynamics of trunk girths
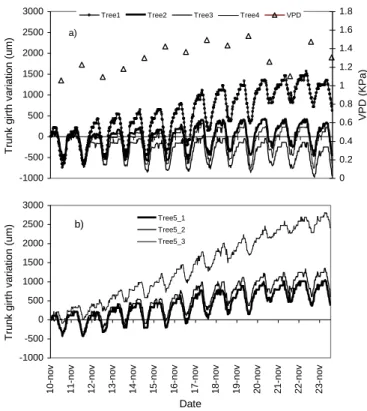
The experiment period was free from rainfall. Average VPD values changed within a relatively short range between 1.1 to 1.6 kPa, progressively increasing with a marked two-day decrease on November 20 and 21 (Fig. 1a). Relative soil extractable water decreased progressively but stayed above 50%, indicating no significant soil water constraint during this period (data not shown). The half-hourly variation in trunk girths showed similar patterns of marked diurnal contractions (Fig. 1a). The days of rest are quoted in the caption of Fig. 1. Maximum diurnal shrinkage ranged between 500 and 1,000 µm (1 and 2 ‰ of trunk girth). Globally, maximum diurnal shrinkage appeared to change between days following more or less VPD magnitude which is the climatic driver of transpiration (R² = 0.46, P<0.001). An ANOVA confirmed that the days of the tapping cycle were not related to any difference of VPD (P = 0.858, mean = 1.3 kPa, SD = 0.16). Maximum diurnal shrinkage appeared similar between trees at the same level of measurement of the trunk (Fig. 1a). By contrast, the daily growth showed large heterogeneity between trees. For example, tree 1 expressed an average growth of 100 µm d-1 while Tree 3 expressed a slight decrease (-20 µm d-1). In measurements on tree 5 at different trunk level (Fig. 1b), girth changes measured above
the tapping panel and below the tapping cut showed similar tendencies than in other trees of Fig. 1a. By contrast, girth changes measured at the trunk bottom expressed lower diurnal contraction and much higher daily growth (200 µm d
-1
).
Nighttime tapping and fine scale dynamic of trunk girth
For the experimented trees, nighttime tapping occurred at 3 am as indicated by the downward arrow in Fig. 2. A short term shrinkage was particularly noticeable below the tapping cut, e.g. minus 200 µm on November 12 (Fig. 2). The initial girth recovered after approximately two hours. On this day, short term shrinkages were also noticeable above the tapping panel and at the trunk bottom. These post-tapping changes were less noticeable on the second day of tapping (November 13) in Fig. 2. On November 14, a day of rest, no shrinkage was noticeable at the time of tapping.
Girth changes above tapping panel according to tapping days (five trees)
The post tapping changes were significantly related to the days of the tapping cycle (see Anova in Table 1 and Fig. 3a). By comparison with the days of rest, the girth changes were significantly different on the first day of tapping, indicating a shrinkage of 30 µm which was not observed on the second days of tapping. The nighttime expansions averaged 117 µm and were not significantly related to the tapping cycle (Table 1 and Fig. 3b). Maximum diurnal shrinkage averaged -697 µm and its magnitude was not significantly related to the tapping cycle (Table 1 and Fig. 3c). However, there was a tendency (P = 0.073), in which, compared to the days of rest, were expressed less shrinkage on the first day of tapping and more shrinkage on the second day of tapping. The recovery phase averaged 612 µm and its magnitude was not related to the tapping cycle. Finally, the daily total growth averaged 30 µm and was not significantly related to the tapping cycle (Table 1 and Fig. 3e). Coefficients of variation and so on confidence intervals of means were very large.
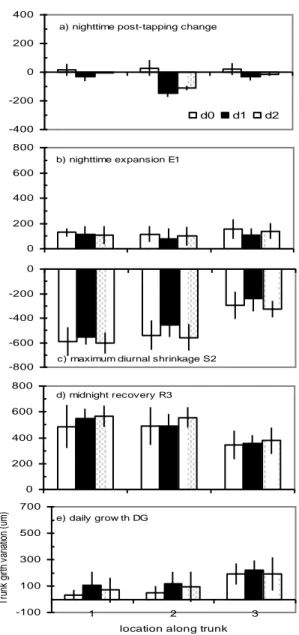
Girth change along the trunk according to tapping days (1 tree)
The post tapping change in the night was significantly related to both the days of the tapping cycle and the locations along the trunk (Table 1 and Fig. 4a). At location 1, above the tapping panel, the pattern observed on tree 5 was similar to the average seen before on the five trees. At location 2, below the tapping cut, the shrinkage was particularly marked in both the first and second day of tapping. At location 3, at the trunk bottom, the pattern was similar to location 1. The nighttime expansion was not significantly related to both the tapping cycle and the location along the trunk (Table1 and Fig. 4b). The diurnal shrinkage was significantly influenced by the location along the trunk (Table 1 and Fig. 4c). There was two times less shrinkage at the tree bottom than at other heights. The influence of tapping sequence was not significant, however there was a tendency (P = 0.09), in which girth shrunk less on the first day of tapping at all locations. The recovery was significantly influenced by the locations along the trunk (Table 1 and Fig. 4d). As mirrored by shrinkage, the recovery was lower at the trunk bottom. The influence of tapping cycle was not significant on the recovery phase. Finally, the daily growth was significantly influenced by locations (Fig. 4e). The girth grew two times more at the
67
Table 1. Anova summary of the influences of tapping cycle and location along the trunk on characteristic phases of diel girth
variation of the trunk: N represents the number of observations. P is the probability of the null hypothesis (no effect). The significant effects are outlined. The a,b classification indicates the results of multiple mean comparison with Tuckey test according to days of the tapping cycle: day of rest (d0), first day of tapping (d1), second day of tapping (d2); or locations along the trunk: above the tapping panel (L1), below the tapping cut (L2), at the trunk bottom (L3).
trunk bottom. By contrast, the tapping cycle had no significant influence on the daily growth.
Relationships between phases of girth change and daily growth
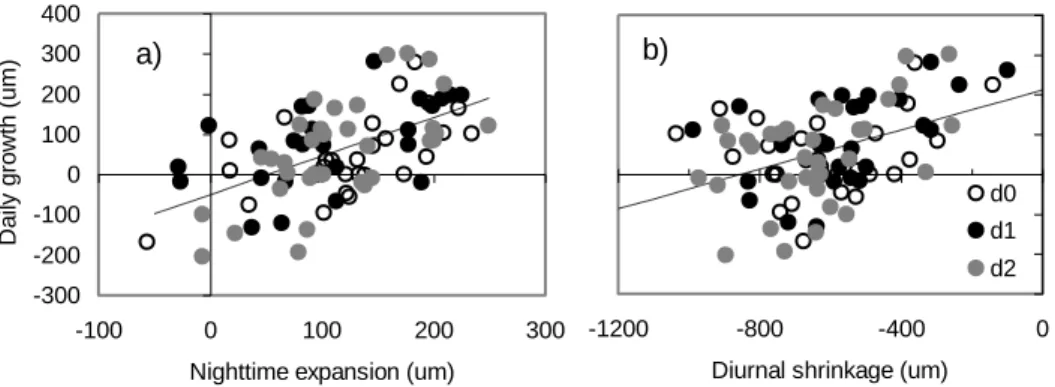
When all tree individuals and location data were pooled, the nighttime expansion showed a weak but significant relationship with the post-tapping change (R² = 0.136, P <0.001, n = 98, Fig. 5a). It is noticeable that positive values of post-tapping change mainly concerned rest days. Globally turgor losses induced by tapping tended to decrease nighttime expansions. The daily growth also showed weak but significant relationships with both the nighttime expansion (R² = 0.32, P<0.0001, Fig. 6a) and the diurnal shrinkage (R² = 0.18, P<0.001, Fig. 6b). There was no relationship with the recovery phase R3. Then high daily growths corresponded to both high nighttime expansion and low diurnal shrinkage. Fig. 4 indicates that the higher growth at the trunk bottom compared to other heights was mainly related to a lower diurnal shrinkage. As suggest by Figure 1a, the tree factor was significant (P<0.05) in all cases of the ANOVA of girth changes above the tapping panel (data not presented in Table 1). Fig. 7 illustrates the relationship of the daily growth in the first and second day of tapping versus the reference growth in the day of rest. Tree 1 with the higher daily growth (128 µm d-1) was the only tree showing a tendency of a negative impact of tapping days (on average 34% lower than the 1:1 line).
Discussion
Post-tapping change
Results demonstrated short term shrinkage soon after the nighttime tapping. The below the cut was maximum
magnitude, equal to 30 % of maximum diurnal shrinkage due to transpiration. Shrinkage of much lower magnitude was noticeable on the second day of tapping at the trunk bottom and above the tapping panel. These results confirm the old results of Pykes (1941), Gooding (1952), Lustinec (1969) and Ninane (1970). It had been also shown that these girth changes after tapping corresponded to a brutal drop of turgor pressure inside the phloem (Buttery and Boatman, 1967). In our results, a tendency of a negative impact of the post-tapping shrinkage on the nighttime expansion was suggested by an overall relationship. However the relationship was weak and the effect was not demonstrated regarding anova and mean comparison.
Diurnal shrinkage
The results do not confirm the hypothesis of an increased diurnal shrinkage, after tapping in the night, on the two successive days of tapping. The diurnal shrinkages were not significantly different according to the tapping cycle. Even, compared to rest day, shrinkage tended to decrease on the first day of tapping and increase on the second day of tapping. This tendency was particularly marked below the tapping cut. The results on the first day of tapping may suggest a reaction that counteracts the risk of local trunk dehydration at transpiration peak.
Daily growth
The results do not confirm the third hypothesis of growth reduction over the two days of tapping by comparison with the day of rest. The commonly-observed large heterogeneity of growth rate between trees did not facilitate such analysis. However the results on nighttime expansion and diurnal dehydration are in accordance with this last conclusion. Our results refute at different steps the simple hypothesis that post-tapping nighttime diurnal midnight daily
Variables change expansion shrinkage recovery growth
E1 S2 R3 DG
Above tapping panel
(5 trees) n 70 70 65 65 65 values (µm) average 3 117 -697 612 30 min -83 -56 -1034 244 -203 max 110 249 -418 1033 285 tapping day P <0.001*** 0.471 0.073 0.313 0.275 effect d0 a a d1 b a d2 a a
Location along trunk
(1 tree) n 42 42 39 39 39 P <0.001*** 0.359 0.090 0.300 0.280 tapping day d0 a a effect d1 b a d2 b a P <0.001*** 0.329 <0.001*** <0.001*** 0.001*** location L1 a a a a effect L2 b a a a L3 a b b b
68
Fig 1. Overall dynamic of trunk girth of mature rubber trees
in Northeast Thailand at the onset of dry season in 2006. A) mean of daily vapour pressure deficit (VPD) and individual micro-variations of trunk girth above the tapping panel (180 cm above soil level) for four trees (girth = 51.4 cm , SD = 5.4 cm). B) micro-variation of girth at three locations along the trunk for one tree: 1) above the tapping panel (180 cm asl), 2) below the tapping cut (80 cm asl) and 3) at the trunk bottom (45 cm asl). Trees were tapped for latex in the night for two consecutive days and rested one day. The days of rest (square frame) were November 11, 14, 17, 20 and 23 and the first and second days of tapping logically followed.
tapping negatively impacts growth at the daily scale through a passive mechanism of dehydration. But this conclusion does not exclude a tapping water effect on radial growth at a medium term of several days. Silpi et al. (2006) report a decrease of daily growth several days after tapping onset. Moreover, our experiment concerns conditions of low average growth. It is possible to imagine a different result in conditions of higher growth rates, possibly more sensitive to any turgor loss as suggested by the response of the tree with the highest reference growth. The tapping at night could also minimize the dehydration effect associated to tapping. Ninane (1970) observed that the over-contraction induced by tapping interfered more durably with the physiological phenomena of rehydration when tapping was performed at midday than at 6 a.m.
Hypothesis of tree water response to latex tapping
Our results support the hypothesis of a complex tree water response which quickly counteracts the dehydration induced by tapping and its consequence on radial growth at the daily scale. This reaction was particularly noticeable below the
tapping cut where the daily growth did not decrease despite a large shrinkage after tapping. As shown by Fig. 6, maintenance of daily growth relies on maintenance of nighttime expansion and control of diurnal shrinkage. Several regulation processes may contribute to these controls of dehydration such as local adjustments in the trunk tissues through osmoticum loading and/or aquaporin expression, or leaf stomatal control of transpiration at the whole-tree scale. The over-storage of non structural carbon shown in tapped trees (Silpi et al., 2007, Chantuma et al., 2009) could play a role in the osmoticum availability inside trunk tissues. In other hand, Tungngoen et al. (2009) have shown that aquaporin expressions are involved in the magnitude of water exchange inside phloem that determines the quantity of latex flow after tapping. These putative regulation processes at different scales are not exclusive; they can be combined. It is noticeable that a stronger stomatal control of water losses could induce a reduced CO2 assimilation and contribute to a
decrease of carbon gain. Isarangkool Na Ayutthaya et al. (2011) assessed for the same clone (RRIM 600) an isohydric tendency under drought which may enhance conservative reaction against tapping water stress and negative consequences on carbon gain. However the differential responses according to trunk locations support the prominence of local adjustments. But similarly, active processes at the tissue level should have energetic cost that may impact the carbon balance and the allocation toward radial growth. Our exploring approach has provided a clear insight and new hypothesis on the topic of short term response to latex tapping. However for the next step, the comparison with also fully untapped trees appears necessary to study the effects of tapping at medium term and to control the changes due to environmental conditions and tree history. Moreover, the analysis of these hypotheses requires experiments combining measurements at different levels in the tree: trunk tissue hydration, leaf water status, stomatal conductance, whole-tree transpiration. And it is likely that the tree water reaction and the consequences on growth will change depending the magnitude of radial growth, the tapping time (night, morning time), the tapping system (number of tapping day versus day of rest), the environmental conditions (evaporative demand, soil water availability) and the clonal behaviour.
Materials and methods
Experimental site and latex tapping
The experiment was conducted in a monoclonal plot of RRIM 600, planted at 2.5 m x 7.0 m spacing. The plantation is located at Baan Sila (N15° 16' 23.6" E103° 04' 51.3"), Khu-Muang village, Burirum province in the Northeast of Thailand. The rainy season lasts approximately six months (May to October) and annual rainfall averages 1,176 mm for the last decade. Trees are tapped for latex from May to December. Tapping involves periodically a deep cutting of the trunk bark which severs the latex vessels located in the inner phloem. Cuts are made downward from the left to the right following a spiral at a 30°angle from the horizontal line to recruit the maximum of latex vessels. The same cut is regularly reopened by excising at each tapping a new thin shaving of the bark. Latex flows immediately along the cut and eventually stops after one to three hours. This downward cutting spiral was applied to the trunk divided in two
-1000 -500 0 500 1000 1500 2000 2500 3000 T ru n k g irt h va ri a ti o n (u m) 0 0.2 0.4 0.6 0.8 1 1.2 1.4 1.6 1.8 VPD (KPa )
Tree1 Tree2 Tree3 Tree4 VPD
a) -1000 -500 0 500 1000 1500 2000 2500 3000 1 0 -n o v 1 1 -n o v 1 2 -n o v 1 3 -n o v 1 4 -n o v 1 5 -n o v 1 6 -n o v 1 7 -n o v 1 8 -n o v 1 9 -n o v 2 0 -n o v 2 1 -n o v 2 2 -n o v 2 3 -n o v Date T ru n k g irt h va ri a ti o n (u m) Tree5_1 Tree5_2 Tree5_3 b)
69
Fig 2. Fine scale dynamics of trunk girth on two consecutive
tapping days (November 12 and 13). Vertical downward arrows indicate tapping time in the early morning. The diel cycle of girth change was schematically divided in three main phases: the nighttime expansion (E1) between midnight and 6:30 am; the maximum diurnal shrinkage (S2), down to 14:00 hrs; and the midnight recovery (R3), up to midnight. The daily growth (DG, upward arrow) corresponded to the 24h- increment between respective midnights.
successive vertical panels, following the so-called 1/2S D2/3 system. The tapping panels started at 150 cm above soil. Trees were tapped for four years and the trunk girth averaged 52 cm at 150 cm above soil over 3,000 trees. The three-days tapping cycle included one day of rest (d0), a first day of tapping (d1) and a second day of tapping (d2).
Meteorological measurement
An automatic weather station (Minimet station, Skype Instrument Ltd, Landrindod Wells, UK) was installed in an open field 50 m away from the plantation. Air relative humidity, air temperature and rainfall were recorded at 30 min intervals. Atmospheric vapour pressure deficit (VPD) was then calculated according to the formula proposed by Allen et al. (1998).
Measurement of trunk girth variation
Trunk girth micro-variations were measured with high accuracy girth bands (D6 model, UMS Gmbh, Salzburg, Germany). The ends of a circumferential cable are connected to a clip sensor. Variations of the gap between cable ends change the bending of the clip. The sensor, a 4-wire full-bridge strain gauge fully compensated for temperature, measures the metal tension on the top of the clip. The measuring cable and clip sensor are set on a Teflon band surrounding the trunk. With a stabilized supply of 5 V, the sensor measured relative variation of girth according to the coefficient of -600 µV / µm. The measuring cable is specially made of INVAR steel which has a minimal thermal expansion. The measurement accuracy of circumference change is 5 µm. Five representative trees were equipped with high accuracy girth bands above the tapping panel (L1: 180 cm above soil level), including one tree with additional measurements: one 10 cm below the end of the tapping cut (L2: 70 cm asl), and one at the trunk bottom (L3: 45 cm asl). The five trees were selected within the main class of girth. The girth average was 51.4 cm with a standard
Fig 3. Average magnitude of characteristic phases of diel
girth variation (a,b,c,d,e) above the tapping panel according to the day of the tapping cycle for five rubber trees. The days of the tapping cycle in the X axis corresponded to the day of rest (d0), the first day of tapping (d1) and a second day of tapping (d2). The nighttime post-tapping change was calculated as the difference between the period following tapping time (3:00-4:00) and the period preceding tapping time (1:30-2:30). Other details are given in Fig. 2. The bars indicate the confidence intervals the means with 95% of probability. The number of observation corresponded to 20 or 25 (4 or 5 days x 5 trees). Corresponding Anova is provided in Table 1.
deviation of 5.4 cm. The seven probes were connected to a data logger (CR10X, Campbell Scientific, Leicester, UK). The data were recorded half-hourly at synchronous times with weather data for 14 days from November 10th to November 23th 2006 at the onset of the dry season. For other purposes a larger set of girth bands was used, up to 14 probes. These probes proved to be very accurate for those -400 -200 0 200 400 600 800 1000 1200 00: 06: 12: 18: 00: 06: 12: 18: 00: 06: Hours T ru n k g ir th va ri a ti o n s (u m ) Tree5_1 Tree5_2 Tree5_3 tapping E1 S2 R3 DG tapping
a) nighttime post-tapping change
22 -28 9 -400 -200 0 200 400
c) maximum diurnal shrinkage S2
-694 -655 -734 -800 -600 -400 -200 0 d) midnight recovery R3 584 602 641 0 200 400 600 800 e) daily grow th DG 17 58 18 -100 100 300 500 700 0 1 2 tapping days T ru nk g irt h va ria tio n (u m ) b) nighttime expansion E1 129 111 111 0 200 400 600 800
70
Fig 4. Average magnitude of characteristic phases of diel
girth variation according to location along the trunk and day of the tapping cycle for one rubber tree. The locations along the trunk (X axis) are: L1, above the tapping panel (180 cm asl); L2, below the tapping cut (70 cm asl) and L3) at the trunk bottom (45 cm asl). „d0, d1 and d2 represent respectively the day of rest, the first day of tapping and the second day of tapping. The bars indicate the standard deviation. The number of observation per average was 4 or 5. Corresponding Anova is provided in Table 1.
running normally. However after few months, 50 % of the probes provided abnormal signals and we were not able to use them further. The diel cycle of girth change was schematically divided into three main phases according to hours windows: midnight to 6:30 pm (nighttime expansion), 6:30 to 14:00 am (maximum diurnal shrinkage) and 14:00 am to midnight (midnight recovery). For each hour threshold, an average was calculated from three values: e.g., the average at 6:30 was calculated from values at 6:00, 6:30 and 7:00.
Fig 5. Nighttime expansion versus post-tapping change. A)
Overall relationship pooling all individual data (above the tapping panel for tree1 to tree5, plus locations 2 and 3 for tree5). The days of the tapping cycle are distinguished: rest day (d0), first day of tapping (d1) and second day of tapping (d2). B) average path of the tapping cycle below the tapping cut (tree5, location 2), the location with the strongest response to the tapping cycle. The dotted lines indicate the trend of the linear regression pooling all individual data (R² = 0.136, n = 98, P<0.001, Y = 0.438 X + 121.4).
Moreover, a short term change after the nighttime tapping at 3 am was calculated as the difference between the period following tapping time (3:00-4:00) and the period preceding tapping time (1:30-2:30).
Statistical analysis
The influence of the days of the tapping cycle, or of the locations along the trunk, on the different phase of girth changes were analyzed with a two-way analysis of variance (XLSTAT, Addinsoft, Paris, France). For analysis of changes above the tapping panel, the model factors were: trees (repeated measurement on five trees) and days of the tapping cycle (d0, d1, d2). For analysis of change at different locations along the trunk, the model factors were the locations (L1, L2, L3) and days of the tapping cycle (d0, d1, d2). The P provided as a result of the analyses of variance (ANOVA) corresponded to the probability of the null hypothesis (no effect). Tuckey test was then used for multiple comparisons of means. Finally the experiment included five days of rest (d0), four “first day of tapping” (d1) and five “second day of tapping” (d2). The fourteenth day of the a) nighttime post-tapping change
-400 -200 0 200 400 d0 d1 d2 b) nighttime expansion E1 0 200 400 600 800
c) maximum diurnal shrinkage S2
-800 -600 -400 -200 0 d) midnight recovery R3 0 200 400 600 800 e) daily grow th DG -100 100 300 500 700 1 2 3
location along trunk
T ru nk g irt h va ria tio n (u m ) -100 0 100 200 300 d0 d1 d2 -100 0 100 200 300 -300 -200 -100 0 100 200
Post-tapping change (um)
N ig h tt im e e x p a n s io n (u m ) a) b)
71
Fig 6. Daily growth versus nighttime expansion (a) and maximum diurnal shrinkage (b) pooling all individual data. The days of the
tapping cycle are distinguished between rest day (d0), first day of tapping (d1) and second day of tapping (d2). The dotted lines indicate the trend of the linear regressions: versus nighttime expansion (R² = 0.323, n = 90, P < 0.0001, Y = 0.958 X–49.5); versus maximum diurnal shrinkage (R² = 0.184, n = 90, P < 0.001, Y = 0.248 X–211.2).
Fig 7. Average daily growth on tapping days versus reference growth on rest day, measured above the tapping panel, for five
individual trees. The dotted line indicates the 1:1 line. The days of the tapping cycle are referred as “d0”, the day of rest, “d1”, the first day of tapping and “d2”, the second day of tapping
.
experiment (last d0) was uncomplete, it ended at 12:00 o‟clock. Hence it was not possible to calculate maximum diurnal shrinkage, midnight recovery and daily growth for this day. The previous detail explains why the number of observations was slightly reduced for these particular phases (Table 1).
Conclusion
Finally, in conditions of low average growth, our results refute the hypothesis of negative impact of tapping on radial growth at a daily scale through a simple increase of dehydration. The substantial loss of turgor was confirmed but trees seem to quickly react and smooth the consequences on nighttime recovery and diurnal shrinkage. However these results do not exclude and neither consider a tapping water effect on radial growth at a medium term of several days.
Acknowledgments
This Thai-French research was funded by Khon Kaen University, the French Research Institute for Development (IRD), the French Institute for Rubber (IFC) and Michelin/Socfinco/SIPH Plantations Companies. The PhD program of Mrs. Junya Junjittakarn was funded by the Royal Golden Jubilee program of the Thai Research Fund (Grant
No. PHD/0107/2547). Thanks are extended to French and Thai counterparts and technical assistants from IRD and Khon Kaen University. Finally we deeply thank the plantation holder (Mr. Chaipat Sirichaiboonwat) who welcomed us so kindly in his rubber tree plantation.
References
Allen RG, Pereira LS, Raes D, Smith M (1998) Crop evapotranspiration: Guidelines for computing crop water requirements. Irrigation and Drainage, 56. UN-FAO, Rome, Italy
Buttery BR, Boatman SG (1967). Effects of tapping, wounding and growth regulators on turgor pressure in
Hevea brasiliensis. J Exp Bot 18:644–659
Calcagno AM, Rivas M, Castrillo M (2011) Structural, physiological and metabolic integrated responses of two tomato (Solanum lycopersicum L.) cultivars during leaf hydration. Aust J Crop Sci 5(6):695–701
Chandrashekar TR, Marattukalam JG, Nazeer MA (1996) Growth reduction of Hevea brasiliensis to heat and drought stress under dry sub humid climatics conditions. Indian J Nat Rubber Res 9:1–5
Chandrashekar TR (1997) Stomatal response of Hevea to atmospheric and soil moisture stress under dry sub humid climatic condition. J Plantation Crops 25:146–151
-300 -200 -100 0 100 200 300 400 -100 0 100 200 300
Nighttime expansion (um)
D a ily g ro w th (u m )
a)
-1200 -800 -400 0Diurnal shrinkage (um) d0 d1 d2
b)
-100 -50 0 50 100 150 200 -100 -50 0 50 100 150 200Daily growth d0 (um)
D a ily g ro w th ( u m ) d1 d2
1
2
3
4
5
Trees
1:172
Chantuma P, Lacointe A, Kasemsap P, Thanisawanyangkura S, Gohet E, Clement A, Guilliot A, Améglio T, Thaler P (2009) Carbohydrate storage in wood and bark of rubber trees submitted to difference level of C demand induced by latex tapping. Tree Physiol 43:1–11
Daudet FA, Améglio T, Cochard H, Archilla O, Lacointe A (2004) Experimental analysis of the role of water and carbon tree stem diameter variations. J Exp Bot 56:135– 144
Fernandez JE, Cuevas MV (2010) Irrigation scheduling from stem diameter variation: a review. Agr Forest Meteorol 150:135–151
Gohet E (1996) The production of latex by Hevea
Brasiliensis: relation with growth. Influence of different
factors: clonal origin, hormonal stimulation, carbohydrate reserves. Ph.D. Thesis, University Montpellier II, France Gooding EGB (1952) Studies in the Physiology of Latex II:
Latex Flow on Tapping Hevea Brasiliensis associated Changes in Trunk Diameter and Latex Concentration. New Phytol 51:11–29
Isarangkool Na Ayutthaya S, Do FC, Pannengpetch K, Junjittakarn J, Maeght JL, Rocheteau A, Cochard H (2010) Transient thermal dissipation method of xylem sap flow measurement: multi-species calibration and field evaluation. Tree Physiol 30:139–148
Isarangkool Na Ayutthaya S, Do FC, Pannengpetch K, Junjittakarn J, Maeght JL, Rocheteau A, Cochard H (2011) Water loss regulation in mature Hevea brasiliensis: effects of intermittent drought in the rainy season and hydraulic regulation. Tree Physiol 31:751–762
Kozlowski TT (1971) Growth and Development of Tree, Vol 2. Academic Press, New York
Lockhart JA (1965) An Analysis of Irreversible plant cell elongation. J Theor Biol 8:264–275
Lustinec J, Simmer J, Resing WL (1969) Trunk contraction of Hevea brasiliensis due to tapping. Biol Plantarum 11:236–244
Ninane F (1970) Les Aspects Ecophysiologiques de la productivité chez Hevea brasiliensis Muell. Arg., au Cambodge. Thèse de Doctorat, Université Catholique de Louvain, p 309
Pardekooper EC (1989) Chapter 9: exploitation of the rubber tree. In: Webster CC and Baulkwill WL (ed) Rubber. Longman Scientific & Technical, Singapore, p 349–414 Pyke EE (1941) Trunk Diameter of Trees of Hevea
Brasiliensis Experiment with a New Dendrometer. Nature
148:51–52
Silpi U, Thaler P, Kasemsap P, Lacointe A, Chantuma A, Adam B, Gohet E, Thanisawanyangkura S, Ameglio T (2006) Effect of Tapping on the Dynamics of Radial Growth of Hevea Brasiliensis Trees. Tree Physiol 26:1579– 1587
Silpi U, Lacointe A, Kasemsap P, Thanisawanyangkura S, Chantuma A, Gohet E, Musigamart N, Clément A, Ameglio T, Thaler P (2007) Carbohydrate reserves as a competing sink: evidence from tapping rubber trees. Tree Physiol 27:881–889
Tungngoen K, Kongsawadworakul P, Viboonjun U, Katsuhara M, Brunel N, Sakr S, Narangajavana J, Herve C (2009) Involvement of HbPIP2;1 and HbTIP1; 1 aquaporins in ethylene stimulation of latex yield through regulation of water exchanges between inner liber and latex cells in Hevea brasiliensis. Plant Physiol 151:843–856 Webster GA, Paardekooper EC (1989) The botany of the
rubber tree. In: Webster CC and Baulkwill WJ (ed) Rubber. Longman Scientific & Technical, New York, p 57–84