HAL Id: hal-02862845
https://hal.archives-ouvertes.fr/hal-02862845
Submitted on 9 Jun 2020
HAL is a multi-disciplinary open access
archive for the deposit and dissemination of
sci-entific research documents, whether they are
pub-lished or not. The documents may come from
teaching and research institutions in France or
abroad, or from public or private research centers.
L’archive ouverte pluridisciplinaire HAL, est
destinée au dépôt et à la diffusion de documents
scientifiques de niveau recherche, publiés ou non,
émanant des établissements d’enseignement et de
recherche français ou étrangers, des laboratoires
publics ou privés.
Distributed under a Creative Commons Attribution| 4.0 International License
Cris Beauchemin, Marie-Laurence Flahaux, Bruno Schoumaker
To cite this version:
Cris Beauchemin, Marie-Laurence Flahaux, Bruno Schoumaker. Three sub-Saharan migration systems
in times of policy restriction. Comparative Migration Studies, SpringerOpen, 2020, 8, pp.Article
number: 19. �10.1186/s40878-020-0174-y�. �hal-02862845�
1Institut national d’études
démographiques (INED), F-93300 Aubervilliers, France
Full list of author information is available at the end of the article
This paper reviews new evidence on the trends and patterns of migration between Africa and Europe since the mid-1970s, and discusses their congruency with the changing context of migration policy. Using data from the Determinants of
International Migration (DEMIG) and the Migration between Africa and Europe (MAFE) projects, we compare flows and policies of three African and six European
destination countries (Democratic Republic of Congo, Ghana, and Senegal, on the one hand; and Belgium, France, Italy, Spain, the Netherlands, and the UK, on the other). The paper focuses on topics that quantitative studies usually overlook due to the lack of data, namely the propensity to out-migrate, legal status at entry, routes of migration, and propensity to return. We show that times of restrictions in Europe do not correspond to less African out-migration, but rather to more unauthorized migration and fewer returns. We further show that trends in African migration differ greatly between historical and new destination countries in Europe.
Keywords: Africa, Europe, Migration policies, Migration trends, Out-migration, Return, Legal status, Migration routes, Migration systems, Quantitative approach
Introduction
Tragic events in the Mediterranean Sea since the 1990s, with the drowning of several thousands of African migrants who attempt to reach Europe, have fostered the view that there would be a global Afro-European migration system. On one hand, the lack of data and knowledge on African migration tends to encourage an undifferentiated view of the diversity of African flows. On the other hand, the existence of a common European border and the will to manage African migration at the European level (Kab-banji2013) tends to overshadow the diversity of the reception contexts in Europe. This paper challenges this overly uniform view by studying the evolution of three distinct sub-Saharan migration sub-systems centred on DR Congo, Ghana, and Senegal (Table 1). In each of these sub-systems, results show how patterns of migration differ between historical and new destinations in Europe, and also by origin. The paper in-tends thus to take into account both origin and destination contexts to explain chan-ging migration patterns (Bakewell2013). In a strictly comparative approach, the paper provides unique statistical evidence on trends related to largely unmeasured but highly debated aspects of migration between Africa and Europe, such as migration attempts, migration routes, legal status, and return. Following the seminal work by Kritz and her colleagues on international migration systems (Kritz et al. 1992), we question the
© The Author(s). 2020 Open Access This article is distributed under the terms of the Creative Commons Attribution 4.0 International License (http://creativecommons.org/licenses/by/4.0/), which permits unrestricted use, distribution, and reproduction in any medium, provided you give appropriate credit to the original author(s) and the source, provide a link to the Creative Commons license, and indicate if changes were made.
ability of migration policies to influence the transformation of migration systems. We do not aim to assess strictly the effectiveness of migration policies. Rather, without claiming causality, we compare old and new destination countries in Europe, following them over time, in order to discuss the congruency of migration trends and policy changes. The analyses rely on quantitative data from the DEMIG (Determinants of International Migration) and MAFE (Migration between Africa and Europe) projects; the former allowing to describe policy changes, while the latter informs us on migration behaviours.1After this introduction, the article is divided into three sections. The first briefly presents a history of migration policies in Europe based on the analysis of the DEMIG database. It discusses the notion that European policies have become uniformly restrictive since the 1960s, by providing an overview of the contrasting policy oppor-tunities that non-European migrants have had to adapt to over time and across coun-tries. The second section turns to migration trends and examines migrants’ behaviours. It reviews the evolution and patterns of sub-Saharan migration between 1975 and 2008, focusing on measures that are expected to be affected by policy changes. To conclude,
Table 1 Three Sub-Saharan migration systems
Quantitative data on sub-Saharan migration is scarce. Rather than covering the whole continent, this paper focuses on the study of three Afro-European migration systems on which detailed data could be collected both in origin and destination countries.
The three African countries (DR Congo, Ghana, Senegal) were chosen for two reasons. First, their migrants constitute three major“African diasporas” (Koser2003): according to OECD data, they represented three of the four largest sub-Saharan populations in Europe when the MAFE project started (2008). Second, they offer contrasted contexts that allow interesting comparisons. They have different histories, with distinct colonial backgrounds, which implies different official languages and initial migration regimes. They experienced different political histories since decolonization, with a very stable country, such as Senegal, contrasting with the political and military unrest in DR Congo since the early 1990s. The three countries also differ in their ecological conditions, Senegal being subject to severe droughts since the mid-1970s, while DR Congo is an equatorial country, and Ghana being in an intermediary geographical position. Finally, the three countries experienced contrasted economic trajectories, especially since the early 1980s. At that time, the Congolese and Ghanaian GDP per capita that were so far equivalent (around 350 USD in 1985) drastically diverged, with a steep decrease of the former (down to 150 USD in 2010) and a steady increase of the later (up to 600 USD in 2010). Over the same period, the Senegalese GDP per capita fluctuated from 700 USD in 1985 down to 635 in 1994 and up to 800 USD in 2010 (source: The World Bank, World Development Indicators extracted from the MAFE contextual database).
In our design, each migration system is divided into two sub-systems linking an origin country with specific destinations in Europe. One sub-system relates to the historical corridor, which links a specific African country to its traditional destination in Europe, ie. its former colonial metropolis (France for Senegal, the UK for Ghana, Belgium for Congo). In these cases, African migration flows to Europe started before decolonization and continued afterwards, thanks to established migrants networks, cultural links rooted in colonization (same official language, similar education system), and bilateral agreements pertaining to economic exchanges and migration (Garson1992). The other sub-systems relate to new corridors that link each origin country in Africa to one or two new destinations in Europe (the UK for Congo, the Netherlands for Ghana, Spain and Italy for Senegal). These destinations were chosen because they attract a significant number of migrants and because they display features distinct from the historical destination, especially in matters of migration policies, economic context, and sociocultural conditions (especially language and education system).
1All MAFE (Migration between Africa and Europe) data are available free of charge. For more details, see:
http://mafeproject.site.ined.fr/en/. The MAFE project was coordinated by INED (C. Beauchemin); other participants include the Université catholique de Louvain (B. Schoumaker), Maastricht University (V. Mazzucato), Cheikh Anta Diop University (P. Sakho), the University of Kinshasa (J. Mangalu), the University of Ghana (P. Quartey), Pompeu Fabra University (P. Baizan), the Spanish National Research Council (A. González-Ferrer), the Forum Internazionale ed. Europeo di Ricerche sull’Immigrazione (E. Castagnone), and the University of Sussex (R. Black). The MAFE project received funding from the European Community’s Seventh Framework Programme under grant agreement 217,206. The MAFE-Senegal survey was conducted with the financial support of INED, the Agence Nationale de la Recherche (France), the Région Ile-de-France, and the FSP programme‘International Migrations, territorial reorganizations and development of the countries of the South’.
of migration policies, by differentiating several legal channels of entry (unauthorized mi-grants; high-skilled workers; low-skilled workers; asylum seekers, refugees, international stu-dents; and family members) and different policy areas (such as entry regulations, integration measures, and return policies). In line with other recent projects on migration policies, the DEMIG project provides quantitative indicators to measure the restrictiveness of migration policies. Its comparative advantage lies in the breadth of its coverage in terms of countries, period, and indicators on major changes in migration policies. Two databases are used in this paper. One of them, the DEMIG VISA database, is a global panel of bilateral travel-visa requirements covering the years 1973–2013 (Czaika and de Haas2017), and provides in-sights on the evolution of visa requirements in Europe. The other, the DEMIG POLICY database, tracks changes in migration policies, by following a rights-based approach: codes indicate whether each policy change increased or decreased migrants’ rights according to their legal status (de Haas et al.2015). Importantly, for this paper, we recoded the informa-tion available in the database to correspond to our populainforma-tion of interest2: the results pre-sented in this paper only relate to non-European migrants, whose circulation rights are obviously different from European citizens who benefit from a right of free circulation.
Table4in Appendix illustrates how policy changes were coded. Indicators consist of or-dinal variables assessing the relative change in restrictiveness in specific policy fields. Mea-sures to restrict rights of a migrant group regarding entry and integration are coded + 1 (creating a more restrictive situation than before), while measures intending to increase the rights of a migrant group are coded − 1 (creating a less restrictive situation than be-fore). Measures aiming to encourage or force migrants to return are coded + 1, while those limiting their return are coded− 1. The indicators thus provide a view of the timing and pace of policy changes towards more or less restriction, without taking into account the extent of the changes. Neither do they provide an assessment of the absolute level of restrictiveness of a specific policy. As a result, DEMIG POLICY does not allow a compari-son of the levels of restrictiveness of migration policies for each category of migrants be-tween countries, but it does highlight the evolution of policy changes, drawing attention to when migration policies become more restrictive or more liberal. These changes may play a role of signal to potential migrants who may respond by adapting their behaviours
2Measures provided here do not take into account bilateral agreements, as we wanted to capture the changes
that applied only to all non-European migrants, and not to those who have a specific citizenship. Conse-quently, we did not take into consideration the policies targeting European migrants or citizens. Also, our re-codification allows a clear distinction between the three exclusive areas of policies regulating entry, stay (referring to integration), and return. We also unmerged the category of‘migrant workers’ in the categories of‘low-’ and ‘high-skilled workers’, and excluded specific categories, such as foreign criminals and terrorist suspects.
(renouncing to migration, changing routes…). Yet it is unclear whether migrants have in-formation about their effective rights or about the changes implemented that affect their rights. Another limitation is related to the implementation gap in migration policies (Czaika and de Haas2013). The database takes into account the measures‘on paper’, but there is often a gap between the policies‘on paper’ and the actual outcomes, which are still more difficult to measure. Still, DEMIG POLICY gives a unique view on policy changes over time and makes it possible to examine whether these changes coincide with transformations of migrants’ behaviour and profiles.
A global view on policy changes in Europe
Since the mid-1970s, migration has become an increasingly politicized topic in Europe. Policymakers repeatedly claim that it is necessary to restrict the entry and stay of immi-grants from non-European countries (Geddes 2003) and to encourage or even force them to return (Cassarino 2008). Indeed, the oil crisis of 1973–1974 abruptly put an
end to the recruitment policies of foreign labour that were put in place after World War II in western Europe (Castles2006). Measures have been taken ever since both to limit migrants’ entries and length of stay, and to promote their return.
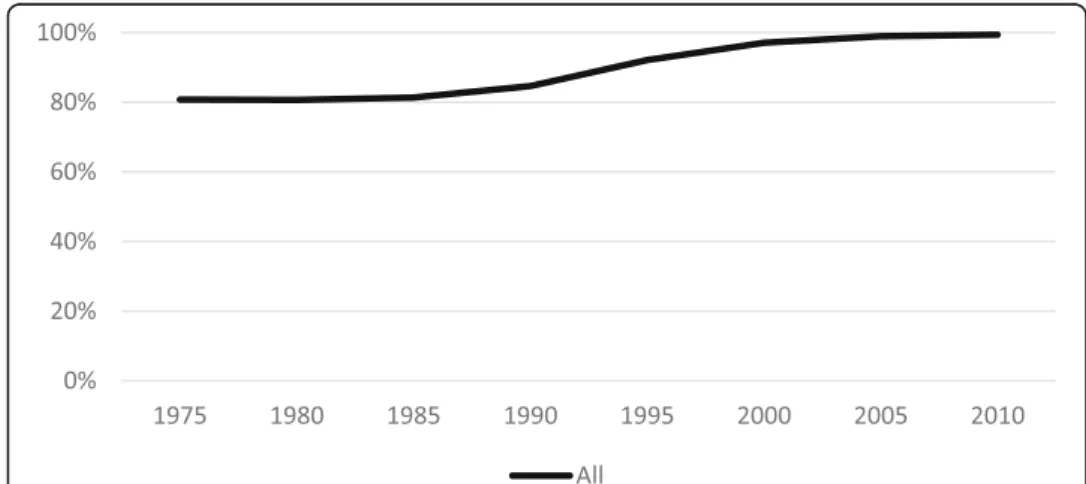
Indeed, getting a visa to migrate from Africa to Europe has become difficult (Finotelli and Sciortino 2013). Between 2005 and 2009 (Lucas 2014), while sub-Saharan citizens applied proportionally twice less often than citizens from non-African third countries for which visas were required (0.4% vs. 0.8% of the whole population), they were sub-mitted to a much higher refusal rate (16% vs. 6%). Figure 1 confirms that European countries have become consistently more restrictive over the last decades. While a visa was needed to travel from Africa to Europe in 80% of the cases until the mid-1980s, the proportion rose to 100% in 2010. This European trend reflects national preferences for more control, but it also results from the creation of a free-circulation zone within Europe (i.e., the Schengen Area, the EU countries of which signed the 1997 Treaty of
Fig. 1 Evolution of visa restrictiveness in European countries for nationals from African countries* (1973–2010). Source: DEMIG VISA database. Computation method: a yearly index is calculated by computing the percentage of African countries that need a travel visa to enter a destination country in Europe. The average value for all destination and origin countries within the region of interest for every year was subsequently calculated. * List of countries: Europe: Austria, Belgium, Czech Republic, Czechoslovakia, Denmark, Estonia, Finland, France, Germany, German Democratic Republic, Federal Republic of Germany, Greece, Hungary, Ireland, Italy, Luxembourg, the Netherlands, Norway, Poland, Portugal, Slovak Republic, Slovenia, Spain, Sweden, Switzerland, and the United Kingdom. Africa: countries from the African continent and Madagascar (not from other islands)
ous types of migrants (see Table 4 in Appendix for examples regarding the content of the indicator). Graphs in this table show averages computed for Belgium, the UK, France, Italy, Spain, and the Netherlands. They thus provide an overall view of the evo-lution of migration policies in Europe, without taking into account the intercountry heterogeneity of these policies (details by destination country are given in the following section). They somehow offer an indication of the general ambience regarding openness to migration in Europe, as it can generally be perceived by potential migrants and others.
Overall, our six countries of interest have increasingly restricted entry of non-European migrants over time, although to varying degrees for different categories of migrants (Fig. 2a). Migrant workers (whatever their skill level) were the first to be sub-ject to entry restrictions, when European countries put an end to the recruitment of foreign labour in the aftermath of the oil crisis. Changes in the rights of low-skilled and
Fig. 2 Migration policy changes regarding entry, integration, and return of non-European migrants in Belgium, UK, France, Italy, Spain, and the Netherlands, 1960–2010 – average index. Note: Positive values on vertical axis = more restrictive. Negative values on vertical axis = less restrictive. Source: DEMIG POLICY database recoded by the authors
high-skilled migrants diverged in the late 1990s, when some countries – especially the UK – initiated policies to favour immigration of high-skilled migrants. This selective policy was so consensual among EU members that it became an European policy in 2009, when an EU Council Directive introduced the Blue Card to allow non-European high-skilled migrants to work in Schengen member countries (Lucas 2014). For all other migrants, entering Europe has become more difficult, especially since the 1990s, be it for family or educational reasons, or to request asylum (Gnisci2008; Rea2007).
It is also in the early 1990s, when visa requirements were extended, that European countries started to multiply measures to prevent the entry of unauthorized migrants (Fig. 2a). Before, measures targeting unauthorized migrants policies were less con-cerned by border control; they rather intended to make their stay harder (Fig. 2b) and to encourage their return (Fig. 2c). Even though many countries implemented regularization programmes (Kraler2009), the‘fight against irregular migration’ became an explicit objective and a priority field of action at the European level in the 2000s (Guiraudon2000).
Although previous research also based on quantitative approaches of migration pol-icies has concluded that polpol-icies have become more liberal over time, whatever mi-grants’ origin, (Helbling and Kalkum 2018; de Haas et al. 2019), our focus on policies towards non-European citizens leads to a contrasted conclusion. Across the board, it appears that policies in our six European countries of interest became more and more restrictive towards sub-Saharan migrants. “In times of restriction” is undoubtedly a right label to describe the policy context under observation in this paper. Policy expec-tations behind these general trends towards more restrictions are clear: on the one hand, to dissuade migrants from coming to Europe and, on the other hand, to encour-age them to return to their home country or head to other destinations. However, the effects of such policies are debated. Previous research, especially in the US context, has shown that the same kind of measures did not produce the expected results. Restric-tions on entry may result in less return because they prevent migrants from circulating; and they can also lead to more unauthorized migration when the motivations to out-migrate remain high (Massey and Pren2012). Such migration trends are not unlikely in the context of African migration to Europe. However, the variety of migration policies within the EU may also bring about specific patterns of migration behaviour.
National specificities in European migration policies
Although European countries (more specifically those of the Schengen Area) share the same external border, the EU is not a homogeneous territory in terms of migration pol-icies (Guiraudon 2000): some countries are today more open than others, and their relative positions in terms of policy restrictions changed over time. Their openness var-ies in particular according to categorvar-ies of migrants, some of them being considered de-sirable by governments, while others are unwanted (eg. high-skilled vs. family migrants). By summarizing policy trends that were analysed with many details in previ-ous comparative works (Brochmann and Hammar1999; Zincone et al.2011), Figs.3,4
and 5help us to grab at once changes in a diverse set of countries and for many types of migrants, and thus help us to assess their potential effect on migration patterns. They especially allow us to hypothesize possible deflection effects of migrants from old
to new destinations. In short, they give some insights on the possible impacts of migra-tion policies on the evolumigra-tion of migramigra-tion systems.
Figures 3 and 4 indeed show that policies vary greatly according to migrant cat-egories and from one country to another. France and the Netherlands, for instance, represent two cases of very consistent changes towards more restrictions of entry rights of all sorts of migrants (Fig. 3). In contrast, Spain appears as a unique case, in which the government constantly maintained or promoted entry rights and migrants’ conditions of stay, except entry for irregular migrants. Policies regarding return (Fig. 5) illustrate that changes may also evolve at very different paces, even though they go in the same direction in all countries. In the 1970s, France was the first country to adopt measures to promote return, either through expulsion or through assisted voluntary-return programmes (Fig. 5). Other European countries gradually followed to the extent that the return of unauthorized migrants to their country of origin has become a priority in Europe, particularly since 2000 (Cassarino 2008).
All these differences in the nature and timing of policy changes are expected to be re-lated to differences in migration trends, such as migrants’ destination choices, the
Fig. 3 Entry of non-European migrants: migration policy changes in Belgium, UK, France, Italy, Spain, and the Netherlands, 1960–2010. Note: Positive values on vertical axis = more restrictive. Negative values on vertical axis = less restrictive. Source: DEMIG POLICY database recoded by the authors
geographical and legal routes they follow to enter Europe, and even their intention to return. Let us then have a more specific look at the differences observed between old and new destination countries for each of the African flows of interest in this paper, in order to speculate on the way they may be associated with the migration trends de-scribed in the next section.
At present, France, Italy, and Spain are the main receiving countries of Senegalese migrants in Europe. As new destination countries, Spain and Italy started to regulate entries and conditions of stays later than France (Figs. 3and4). Country differences lie not only in the timing of the changes, but also in the nature of the policy measures. Re-garding entry and integration policies, France and Spain present opposite models (Italy represents an intermediate position). While France continuously adopted restrictive measures for all sorts of migrants, including low and high-skilled workers, Spain grad-ually relaxed its policies for all sorts of migrants. These opposite trends actgrad-ually reflect different economic contexts and strategies regarding labour migration. While France officially stopped its recruitment of foreign labour in the mid-1970s, Spain indeed adopted many measures raising the quotas of workers between the late 1990s and 2005, and providing temporary formal labour in sectors such as agriculture,
Fig. 4 Integration of non-European migrants: migration policy changes in Belgium, UK, France, Italy, Spain, and The Netherlands, 1960–2010. Note: Positive values on vertical axis = more restrictive. Negative values on vertical axis = less restrictive. Source: DEMIG POLICY database recoded by the authors
construction, and domestic work. Also, French and Spanish strategies differ especially in the policies they adopted to manage unauthorized migration. Although unauthorized migrants in France were not targeted more than other migrants in the growing restric-tions regarding entries (Fig. 3), their rights after entry declined very steadily since the 1980s, more than in any other country (Fig. 4). As a point of entry to Europe, Spain regularly adopted restrictive measures since the early 1990s to discourage unauthorized entries (Fig. 3) but did not significantly reduce rights of unauthorized migrants once they were in Spain and offered opportunities for regularisation (Fig.4). Although public debates in Europe convey the idea that Mediterranean countries are merely portals through which African migrants enter before going to northern countries, these oppos-ite policy trends suggest there might be a more complex pattern of migration. On the one hand, Spain and Italy are certainly entry points for migrants crossing borders with-out visas, especially those arriving by boat. On the other, most of them may prefer to stay in these countries, considering the legal conditions for migrants’ integration and the economic context. For the same reasons, Senegalese migrants who entered Europe through France – the historical destination where they potentially have family
Fig. 5 Return of non-European migrants: migration policy changes in Belgium, UK, France, Italy, Pain and the Netherlands, 1960–2010. Note: Positive values on vertical axis = more restrictive. Negative values on vertical axis = less restrictive. Source: DEMIG POLICY database recoded by the authors
connections who may help them to obtain visas – may decide to move to Mediterra-nean countries where conditions of stay seem to be more favourable.
Although the UK, Belgium, and the Netherlands have all been historical destination countries in Europe (as opposed to the new immigration countries of the Mediterranean), they reveal quite different patterns in policy changes. Regarding entry policies, the UK dis-plays a unique profile with a very clear divergence in the rights provided to highly skilled workers, whose entry possibilities were extended, while other types of migrants steadily ex-perienced restrictions since the late 1980s. Compared to Belgium and the Netherlands, the UK also seems unique in terms of its integration policies, with measures steadily tending to restrict migrants’ conditions of stay since the 1990s (Fig.4). However, regarding specifically unauthorized migrants, the UK is in an intermediate position. The UK appears more open than Belgium, which started to adopt restrictive measures 20 years earlier than the UK con-cerning both the integration and return of unauthorized migrants (Fig.4).3This policy con-trast could have contributed to a shift of unauthorized Congolese migrants’ from Belgium, the historical destination of Congolese migrants, to the UK. A similar shift could have also occurred for Ghanaian unauthorized migrants, from the Netherlands to the UK, as the latter appears to have become more restrictive than the former, which has not really changed its policy regarding unauthorized migrants for the five last decades. We explore in the next sec-tions whether there was indeed such country deflecsec-tions of unauthorized migrants and dis-cuss other possible explanations for such shifts.
Migration trends between Africa and Europe (1975–2008)
The MAFE data
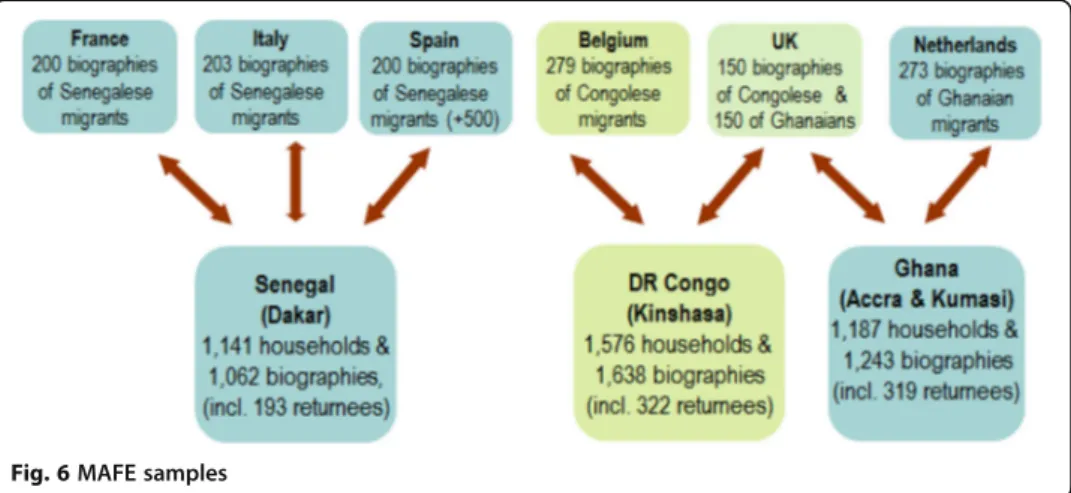
Although migration acquired a high position in the policy agenda of both European and Af-rican countries, the lack of data on AfAf-rican migration was a widely recognized fact in the early 2000s (Lucas2006; Hatton2004). The multisite MAFE project, inspired by the Mexi-can Migration Project, has produced new data on AfriMexi-can migration (Beauchemin 2015). The primary objectives of the MAFE project were to measure trends and patterns of migra-tion, to study factors of departures and returns, and to analyze the consequences of inter-national migration on economic and family outcomes. Both household and individual data were collected in 20,082,009 on three migration systems, each including a country of origin in Africa (Ghana, Senegal, and DR Congo), the former colonial metropolis (respectively the UK, France, and Belgium), and one or two new destination countries in Europe (Fig.6). The same questionnaires were used in all settings, making data comparable across countries.4
Household surveys were conducted in sending countries among representative sam-ples of households of selected cities (Accra and Kumasi, Ghana; Dakar in Senegal; Kinshasa in DR Congo).5 The samples were limited to these cities because of budget and time constraints. Dakar represents around a quarter of the total population of Senegal, Kinshasa around 12% of the population of DR Congo, and Accra and Kumasi about 17% of Ghana’s population (Schoumaker and Beauchemin 2015). In the
3It is important to keep in mind that important regulations related to unauthorized migrants are not
included in the DEMIG codification. For instance, on-going regularizations (as opposed to one off
regularization programmes) that were implemented in Belgium on the grounds of administrative instructions are not coded. Similarly, the fact that unauthorized migrants are not subject to policy controls in their daily life in the UK is not either codified.
4The questionnaires are available in English, French, Italian, and Spanish at:http://mafeproject.site.ined.fr/.
household questionnaire, data were collected on all the regular members of the hold, as well as on a series of people related to the household but who were not house-hold members at the time of the survey. Questions on first departure (year, destination) and return (year) among these people are used to compute trends in rates of departure and return. The methodology is fully described in Schoumaker and Beauchemin (2015). Individual retrospective data collected both in Africa and in Europe among people aged 25 and over are also used in this paper. Non-migrants and returnees in Africa were ran-domly selected in the surveyed households. In Europe, a quota approach was used to sample migrants in five of the six countries.6Along with employment and family histories, detailed migration histories were collected, including questions on the motives to migrate and the reasons for destination choices. A full module was also dedicated to the routes followed by migrants when they left their country of origin (e.g., transit countries, means of transporta-tion, people they travelled with). Legal status trajectories were also collected, indicating whether migrants had the right to stay and/or work at any time. In addition, questions were asked about migration intentions, both to register the steps that interviewees (who actually migrated or not) had taken to prepare an international migration, and to measure the intended duration of stays abroad among those who actually migrated.
Although the MAFE data offer rich information on migration patterns, they suffer from a number of limitations. First, the migration systems are not fully covered. In par-ticular, transit countries in Africa (especially in the Maghreb) were not included in the destination countries. Second, samples are not fully representative at the national level, and sample sizes are limited (Fig. 6). Despite these limitations, the MAFE data make it possible to generate results on phenomena that are overshadowed in conventional data sources. While most existing data are based on immigration in destination countries, the MAFE data allow measures of actual and intended out-migration and return to be com-puted. And whereas official data provide few clues about undocumented migration, the MAFE data offers a wealth of information on migrants’ geographical and legal trajectories,
Fig. 6 MAFE samples
5
Two-stage stratified random samples of households were selected in each city. Stratification was used in order to increase the number of migrants in the sample (Schoumaker and Mezger Kveder2013). Sampling weights are used in all the analyses to take oversampling into account.
6Quotas were based on age, gender, and socioeconomic status. In Spain, a probabilistic sample was drawn.
which makes it possible to know the trends (in departure and return) and patterns (choice of destinations, undocumented migration) of migration between Africa and Europe.
Trends in out-migration to Europe
Analyses of migration policy changes regarding entry of non-European migrants have shown in the previous section that, with few exceptions, policies in Europe generally followed a continuous trend towards more restriction. Does this trend therefore corres-pond to a decrease in departures over time from Ghana, Senegal, and DR Congo? MAFE results concerning the probabilities of departure show a large heterogeneity by country of origin (Fig. 7). While out-migration to Europe from Senegal7 as a whole stalled, it temporarily increased from Ghana in the 1970s and 1980s, and decreased from DR Congo after 2000. Context at origin may explain these differences. Compared to the more stable contexts of Senegal and Ghana, DR Congo had experienced a deep political and economic crisis in the 1990s. The reduction of the propensity to out-migrate to Europe in the last period corresponds to the return to a more peaceful con-text after 2000 (Schoumaker et al. 2010) and to the development of new opportunities for Congolese migrants in alternative neighbouring destinations, such South Africa and Angola. In any case, it seems clear that the propensity to migrate from Africa to Europe did not decrease in times of policy restriction, except among Congolese migrants.
Analyzing migration intentions complements the picture. A module of the MAFE bio-graphical questionnaire was dedicated to migration ‘attempts’. Rather than recording at-tempts to physically cross borders, the module recorded the practical steps that would-be migrants had undertaken with the intention of moving out of Africa. Such steps include saving money, asking for or obtaining the necessary travel documents such as passports, visas, accommodation certificates, registration at a university, etc., as well as transit migra-tion without succeeding in reaching the target country (see Table5in Appendix for more details). These data help to identify candidates for migration,“adding some objectivity to the measure of migration intention” (Mezger Kveder2012, p. 70).
Trends in the lifetime probability of taking steps towards migration showed in Fig.8 re-veal a clear surge in the attempts to move to Europe at the turn of the twenty-first cen-tury. Attempts peaked in Senegal in the 2000s, with one in three Senegalese people trying to fulfil the conditions to leave, while the proportion was about 10% in the previous de-cades.8The low probabilities of ‘attempts’ in the first period of observation are due, at least to some extent, to the fact that obtaining a visa was not required until the mid-1980s. Afterwards, it became compulsory, and restrictions in granting visas tend to en-courage would-be migrants to multiply administrative steps. Policy restrictions may also explain the rising gap between steps to migration and actual migration in the last period (Figs.3and49). This gap might be interpreted as an indicator of the rising costs of migra-tion from Africa to Europe. It also suggests that, at least to some extent, European policies
7
Other nationally representative sources in Senegal indicate that the propensity to out-migrate remained stable between 1992 and 2002, with approximately seven Senegalese migrants living abroad for less than 5 years per 1000 habitants within the country (Lessault and Flahaux2014).
8
This could be partly due to a methodological bias: as the question is retrospective, the proportions may be underestimated in the first periods (compared to the more recent one), especially for attempts that did not get far. However, there is no reason to believe that this potential bias would differently affect the three origin countries. In particular, this potential bias is certainly not sufficient to explain the surge in Senegalese attempts to move to Europe in the 2000s.
have been successful in restraining out-migration. In short, migration did not decrease, but it is possible that–without European policies– they would have increased.
Choice of destination
Beyond general trends of out-migration to Europe as a global destination, the MAFE project explicitly questioned the migrants about the reasons that guided their choice of destination in Europe. Questions were open-ended, and answers were recoded afterwards. Despite the divergences of some policy indexes observed in the previous section (Fig.7and Fig.8), it is striking to observe that migrants own declarations tends to dismiss the influence of migra-tion policies on their destinamigra-tion choice. A series of answers were recoded under the‘facility and papers’ label. Whatever the origin of the migrants, the proportion declaring such a
7Other nationally representative sources in Senegal indicate that the propensity to out-migrate remained
stable between 1992 and 2002, with approximately seven Senegalese migrants living abroad for less than 5 years per 1000 habitants within the country (Lessault and Flahaux2014).
8This could be partly due to a methodological bias: as the question is retrospective, the proportions may be
underestimated in the first periods (compared to the more recent one), especially for attempts that did not get far. However, there is no reason to believe that this potential bias would differently affect the three origin countries. In particular, this potential bias is certainly not sufficient to explain the surge in Senegalese attempts to move to Europe in the 2000s.
9Although results were computed to be as comparable as possible, the comparison between these figures
requires some caution. Figure8(steps to migration) is based on the biographical data collected among all individuals in Dakar. Figure7(actual migration) is based on a subsample of the household data (children of household heads in Dakar). All individuals included in the biographical survey in African countries were also included in the household surveys. Both statistics refer to the same periods, the same places, the same destinations, and the same age groups.
Fig. 7 Lifetime probability of migration to Europe by origin country (1975–2008). Source: MAFE Household surveys, in Senegal, DR Congo, and Ghana, 2008-2009. Weighted figures (90% confidence intervals). Population: All household heads’ children (between age 18 and 40), whatever the age of departure, including deceased children. Definition: Migration for a period of at least one year. Interpretation: Each bar represents those who left DR Congo, Ghana, or Senegal as a proportion of those who were living there during the period in question (age is controlled for). For more technical details on the computation methodology, see Schoumaker and Beauchemin (2015)
reason is around 10% (Fig.9). Results show no significant differences between historical and new destinations, or according to the degree of immigration openness (Fig. 9). In other words, according to migrants’ declarations, entry regulations would not make a difference. ‘Family’ is a much more frequent answer to justify destination choices. Even though not identified as such as a“paper” motivation by the migrants, this family motivation relates to migration policy, since family reunification is a guaranteed right in all European countries. Interestingly, there are almost no differences between new and old destinations regarding the family motivation, Italy being an exception where friends have a higher attractive power than family members (Fig.9). The most discriminating motive relates to labour: there are proportionally many more migrants in new destinations, especially Spain and Italy, to de-clare they choose their country of residence for work. Migrants’ answers actually echo the fact that Spain and Italy were characterized at the turn of the twenty-first century by a high demand for low-skilled labour in agriculture, industry (especially in northern Italy), and in services (tourism and medical care) (Arango and Baldwin-Edwards 2014; King et al.2000). On the other hand, historical destination countries are still attractive for sociocultural rea-sons. Beyond language proximity, institutional factors are of importance because education systems in former colonies are structured on the model of the former metropolis, which fa-cilitates degree recognition. For instance, in Senegal, formal education is provided in French, and the education system has the same structure as the French system. As a result, it is eas-ier for Senegalese students to have their degrees recognized in France than in other countries. Conversely, degrees obtained in France are better recognized in Senegal than those from Spain or Italy. The same analysis applies for the comparison of Ghanaians in UK vs. the Netherlands, or to Congolese migrants in Belgium vs. UK:
Fig. 8 Lifetime probability of taking steps towards migration to Europe by origin country (1975–2008). Source: MAFE Biographical Surveys in Senegal, DR Congo, and Ghana, 2008-2009. Weighted figures (90% confidence intervals). Population: Samples include persons aged 18 to 40 and living in the three African countries at the time of the survey. Interpretation: Lifetime probability indicates the likelihood of taking at least one step towards emigration in one’s lifetime, if the rate of steps taken by same age group for the period remains constant
the former colonial metropolis always remains the first choice for students. Overall, our results suggest that the reorientation of migration flows toward new destin-ation countries is less commanded by policy changes than by work opportunities, especially among Senegalese migrants. However, both aspects are related: countries in need of labour, such as Italy or Spain, are also more open to immigration in general and are more lenient regarding unauthorized migration.
Migration routes
EU national governments have often expressed a long-standing concern that countries with rather open policies, especially those of Southern Europe, are mere gates to the Schengen Area. The assumption is that migrants would massively enter these countries before moving to other destinations, thanks to European free-circulation agreements. The MAFE project col-lected information on migrants’ routes, i.e. the list of countries they traversed (for a short or long stay) before arriving in the countries where they were surveyed. The results show that African migrants’ movements within Europe are far from reducible to a South-North channel (Table2). Rather, they show that historical destinations are more common points of entry be-fore settlement in new destinations. For instance, transiting through France to go to Italy is much more frequent (the second route of Senegalese migrants in Italy) than the reverse (Italy
Table 2 TOP-3 routes to Europe of African migrants (1975–2008), by origin and country of residence
Country of Origin
Country of residence
1st route 2nd route 3rd route N
DR Congo Belgium DRC-Belgium (70%) DRC-Angola-Belgium (4%)
DRC-France-Belgium (4%)
278 UK DRC-UK (55%) DRC-Belgium-UK (8%) DRC-France-UK (7%) 149 Ghana UK Ghana-UK (76%) Ghana-Nigeria-UK
(4%) Ghana-Germany-UK (3%) 149 Netherlands Ghana-Netherlands (65%) Ghana-Germany-Netherlands (6%) Ghana-Italy-Netherlands (5%) 273
Senegal France Senegal-France (79%) Senegal-Spain-France (4%) Senegal-Morocco-France (3%) 200 Italy Senegal-Italy (69%) Senegal-France-Italy (15%) Senegal-Spain-Italy (4%) 203 Spain Senegal-Spain (64%) Senegal-Morocco-Spain (9%) Senegal-Italy-Spain (4%) 200
Source: MAFE biographical surveys in Europe. Weighted percentages
Population: Migrants aged 18 and over, living in Europe at the time of the survey
Routes indicate the series of countries through which migrants travelled (in that order) and the percentage of migrants having used the route. Only countries in which migrants spent at least one night are included
(See figure on previous page.)
Fig. 9 Motives of choice of destination in Europe (1975–2007), by origin and country of residence. Source: MAFE Biographical Surveys in Europe (2008-2009). Weighted results with 90% confidence intervals. Population: migrants living in Europe at the time of the survey. Measure: Percentage of migrants declaring each type of motive for the choice of their first destination in Europe (first stay of at least one year after age 18). The exact question was,‘And for what reasons did you choose to go to [country of stay] rather than to another country? (Note precisely and verbatim the entire response)’. Answers were coded; a unique answer may have received several codes. All motives cited by respondents are shown in the figure
Increasing and shifting unauthorized migration
In this section, we measure the extent to which unauthorized migration from sub-Saharan Africa has developed over the last decades. We define unauthorized migrants as migrants who mentioned they did not have a residence permit at some point during their first year in their destination country. As shown by Vickstrom (2019), there are‘multiple paths into irregularity’: migrants may enter with a visa and remain in the destination country after it has expired, thus becoming‘overstayers’; others may experience ‘befallen irregularity’ when their residence permit is not renewed. Overstaying is a common path to irregularity. Vickstrom’s multivariate analysis of the factors associated with the different pathways into irregularity has even shown that entering Italy or Spain with a visa is actu-ally a strong predictor of an unauthorized stay.
Figure10provides clear evidence of the increasing proportion of African migrants staying in Europe without a residence permit, regardless of their status upon entering Europe (with or without a visa). The increase is much sharper for Congolese and Senegalese migrants than for Ghanaian migrants. Levels of unauthorized stay the year of arrival differ signifi-cantly across origins in the last period (30–35% of unauthorized migrants for the former, while less than 10% for the latter in the 2000s). The increasing proportion of unauthorized stays actually reflects the fact that unauthorized migration is much more frequent in new rather than in historical destinations (Fig.10). This distinction between destinations also ap-plies to unauthorized entry: migrants who travelled at some point with a smuggler are
Fig. 10 Percentage of migrants experiencing unauthorized stay during the first year in Europe (1975–2008), by origin, country of residence (at the time of the survey), and period of arrival. Source: MAFE Biographical Surveys in Europe. Measure: Percentage of migrants who declared that, during the first year in the country of residence, they did not have a residence permit at some point. This is not synonymous with illegal entry: a person may have entered legally, with a visa that expired. Weighted results, 90% confidence intervals
significantly more numerous among Congolese migrants in the UK, Ghanaian migrants in the Netherlands, and Senegalese migrants in Spain and Italy (Fig.11). Several reasons can be mentioned to explain this distinction between historical and new destinations.
The first explanation relates to social networks. As mentioned above, migrants have potentially more connections of relatives and friends in traditional destination countries than in new destinations, where communities are smaller and less established. The weakness of social networks, and especially of family ties at destination, increases the probability of migrants of entering and staying without proper authorization, as was demonstrated in the case of Senegalese migration to Europe (Vickstrom2019).
The second explanation concerns changes in entry regulations. Before the mid-1980s, unauthorized entry was unlikely and even impossible in many contexts, as visas were not systematically required. This explains the contrast between Congolese and Ghanaian migrants in the UK. As they arrived more recently, Congolese migrants are confronted with more entry regulations and are thus more likely to have used the services of smugglers than are Ghanaians (Fig.11).
Fig. 11 Percentage of African migrants who travelled with a smuggler (1975–2008), by origin, country of residence (at the time of the survey), and period of arrival. Source: MAFE Biographical surveys in Europe. Measure: Percentage of migrants who travelled with a smuggler at some point on their journey to the MAFE countries (first arrival), among migrants currently living in these countries. Weighted results, 90% confidence intervals
Fig. 12 Percentage of African migrants who travelled by sea (1975–2008), by origin, country of residence (at the time of the survey), and period of arrival. Source: MAFE Biographical surveys in Europe. Measure: Percentage of migrants who travelled by sea at some stage in their journey to Europe. Weighted results, 90% confidence intervals
integration policies earlier than the new destinations. Early restrictions in French inte-gration policies, when compared to Spain and Italy, may explain France’s lower propor-tion of unauthorized migrants. Similarly, the deflecpropor-tion of Congolese migrants from Belgium to the UK reflects the early and very continuous tightening of integration and return policies (rather than entry policies) regarding unauthorized migrants in Belgium. When compared to Belgian policies, UK policies have indeed followed a later and less abrupt turn towards more restrictiveness. However, when compared to the Netherlands, the UK appears as more restrictive, which could explain the deflection of Ghanaian migrants from the UK to the Netherlands. The UK case interestingly illus-trates the fact that one policy context can be associated with very different levels of ir-regularity, with new origin groups being at higher risk of irregularity. The same context can lead old migrant groups towards new destinations that are less restrictive (such as the Ghanaians to the Netherlands) as well as attract new groups who are deflected from traditional destinations that have tightened their policies (such as Belgium).
Trends in returns
The literature suggests that tightened migration policies at destination not only affect im-migration but also influence return behaviour. More specifically, and contrary to policy expectations, return migration would decrease in times of restriction (Flahaux 2015and
2017, Massey et al. 2002; Massey and Pren2012). We used the MAFE data on the chil-dren of household heads to compute trends of return to countries of origin (Fig. 13).10 Despite large confidence intervals due to limited sample sizes, some results are remark-able: (1) return from Europe to DR Congo decreased drastically after 1990; (2) return to Ghana peaked in the 2000s; and (3) return to Senegal did not significantly evolve over time. Context at origin partly explains these contrasting results. The democratization of Ghana in the early 1990s, improved political stability, and economic recovery have prob-ably played a role in attracting return migrants from Europe in the 2000s (Black and Castaldo 2009). In fact, returnees to Ghana reintegrated well in the labour market (Castagnone et al. 2013). On the other hand, the economic crisis and political troubles made DR Congo obviously less attractive for potential returnees. The civil war also dras-tically changed the migrants’ profiles: before, most of them were members of the country’s elite and went to Europe to study or do professional/training missions in large companies or government agencies with the intention of returning to DR Congo after completing
10Note that other estimates where computed using an alternative method in previous publications (Flahaux
et al.2013). Although differences between return from Africa and Europe were also marked in these previous computations, the results presented here tend to show lower levels of return.
their work (Kagné and Martiniello2001). When the country entered its period of turmoil, Congolese migration became less selective. Migrants came from less privileged socioeco-nomic categories (Sumata2002; Schoumaker et al. 2010); the proportion of women mi-grating to Europe increased, partly in relation to family reunification (Vause 2012); and those who used to be circular migrants began to settle.
To complement results in trends of actual return, we also used the MAFE bio-graphical data to compute trends in intention to return. Migrants (whether living in Europe or back in Africa) were asked how long they intended to stay at
Fig. 13 Probability of returning from Europe within ten years of first departure (1975–2008), by origin and period. Source: MAFE Household surveys, 2008-2009. Population: All children of household heads (between age 18 and 40), regardless of age at departure, including deceased children. Stay abroad and return for a period of at least one year. Weighted figures (90% confidence intervals)
Fig. 14 Intention to stay less than 10 years on first arrival (1975–2008) by origin, country of residence and period of arrival. Source: MAFE-Senegal, Biographical survey in Europe and Africa, 2008-2009. Population: Sample includes first long stay in a destination country of all migrants still living in a MAFE country or back in the country of origin. All migrants left their origin country at age 18 or over in 1975 or later. Measure: Percent of migrants intending to stay less than ten years on first arrival in the MAFE countries. Weighted figures (90% confidence intervals)
destination at the time of their arrival in receiving countries. The question was both retrospective and subjective, and thus potentially subject to ex-post revision. However, it provides a complementary view of return migration with smaller sam-pling errors than for actual return thanks to larger samples (smaller confidence in-tervals, Fig. 14). The results remind us that a significant proportion of migrants consider themselves as temporary migrants. This varies by origin and period. The decreasing trend of return between 1975 and 2008 among Congolese migrants (Fig. 13) is confirmed, though with an increase of return intentions in the 1990s that may be explained by the fact that most migrants at that time were refugees or asylum seekers (Fig. 14). The U-shape of actual return to Ghana (Fig. 13) is con-firmed in intended returns (Fig. 14). Finally, intentions to return followed a down-ward trend among Senegalese migrants. Overall, a common pattern emerges for the three origin groups: intentions to return declined over time. In all cases, rates in the 2000s are lower than before 1990.
This trend paradoxically contradicts the multiplication of policy measures aimed at encouraging migrants’ return (Fig. 5). However it is in line with previous research showing that these policies have little impact (Koser and Kuschminder2015). Actually, motives for return indicate that it is much more a personal decision than the outcome of an institutional constraint or incentive: family, work, and education are the main rea-sons why people go back to their country of origin in Africa (Table 3). Thirteen per cent of Ghanaians, 15% of Senegalese and 4% of Congolese reported ‘administrative reasons’ (which actually refers to legal-status issues) to explain their return. Not all of these were expulsions or ‘assisted voluntary returns’: respondents’ detailed answers show that some undocumented migrants decided to return home on their own initia-tive (Flahaux 2013). Longitudinal and multivariate analyses on the determinants of re-turn migration from Europe to sub-Saharan Africa have shown that undocumented migrants are not more likely to return: legal status makes no difference among Senegal-ese and Ghanaian migrants, and unauthorized migrants are less likely to return among Congolese migrants (Flahaux et al.2014; González-Ferrer et al.2014).
Total 100 100 100
N 120 78 101
Source: MAFE Biographical surveys (2008–2009) Weighted results
Sample: Migrants interviewed in Europe and Africa who had stayed for at least one year in Europe and had returned to Ghana, Senegal, or Democratic Republic of Congo (DR Congo)
Interpretation: 18% of returns to Senegal and 23% of returns to DR Congo are due to completion of education in Europe a
Answers include: financial problems / low earnings; racism / xenophobia; fed up / deceived with life abroad; hard living conditions, etc.
Disconnected from return policies, the declining trend in return intentions parallels the trend towards more restrictions in entry regulations (Fig.2). Previous research on the Mexican, Congolese, and Senegalese contexts has shown that tougher conditions of entry and stay tend to deter migrants’ return (Flahaux2015; Flahaux2017; Massey et al.2002; Massey and Pren
2012). There are two possible explanations. The first is that restrictive policies tend to increase migrants’ vulnerability (e.g. they make them more likely to be undocumented), which delays the migrants’ target achievement and thus reduces the odds of return. The second concerns the prospects of migrants when they return. Since returnees may have trouble in re-adapting when they go back home, returning entails some risks. The possibility to re-migrate can thus be conceived as a sort of insurance against failure upon return. Restrictive immigration pol-icies, which impede this possibility, thus tend to discourage return. Our results on trends in re-turn migration and intentions of rere-turn show that these mechanisms related to the context at destination do not apply with the same intensity for all groups. While return intentions tend to decrease in the long term– possibly because of more restrictive entry regulations – trends in actual return seem to be very dependent on changes in the country of origin.
Results summary & conclusions
The objective of this paper was to review new evidence on trends and patterns of mi-gration in three sub-Saharan mimi-gration systems since the mid-1970s until 2008. In this period, our analysis of migration policy changes shows that the general label ‘times of restriction’ is accurate to describe the reception context of non-European migrants. Even though we do not contend to measure properly the impact of migration policies on migration patterns, we provide unique insights on the congruency (or the absence of it) between trends in European policies and trends in African migration.
To and from Europe: ambiguous policy effects
Regarding trends of departure from Africa, our results are not consistent with policy expecta-tions. In the view of policy makers, tightening entry requirements and restricting migrants’ post-entry rights are supposed to discourage migration. Our results show both an increase in the like-lihood of taking concrete steps to move out of Africa and fairly stable probabilities of actually out-migrating. Some authors suggest that the tightening of migration policies could have a‘now or never’ effect, whereby potential migrants would anticipate their departure in advance of even more restrictive stances (de Haas et al.2019). Even though this mechanism might partly explain the increasing steps to migration, this trend more probably reflects the fact that organizing a mi-gration from Africa to Europe has indeed become more complex from an administrative view-point. Today, such a move obviously requires more steps than it did when visas were not required from African migrants to travel to Europe. The simultaneous rise in attempts and stabilization of actual migration indicates that hopes to migrate have not diminished over time, but that policy restrictions have somehow succeeded in curbing actual out-migration.
Although probabilities of out-migration have not increased over time, migration con-ditions have changed. Migrants shifted their channels of entry to adapt to new regula-tions. Our results indeed confirm that a process of ‘irregularization’ accompanied the trend towards tighter migration policies in Europe. The proportion of unauthorized mi-grants (as measured during the first year of stay in Europe) grew over time, to reach significant levels – as high as around 30% of all Senegalese and Congolese migrants in the 2000s. This does not mean that migrants remain permanently with irregular status.
with the surge of actual return to Ghana during an economic boom.
Old vs. new corridors
Trends of migration do not only vary by origin. Within a same sub-system, they also differ by destination. To some extent, origin and destination variations re-flect contrasted patterns of migration between historical and new destinations. To understand destination choices, it is important to make a conceptual distinction between a new destination country as a whole, ie. a country that recently started to receive migrants –whatever their origin– (such as Mediterranean countries) and a new destination for a specific group. For instance, the UK –which is histor-ically an immigration country as a whole– is a new destination for Congolese migrants.
Comparing our three sub-Saharan sub-systems, we show consistent differences between old and new corridors, regardless of the origin. Migrants who chose new destinations (Ghanaians to the Netherlands, Congolese to the UK, Senegalese to Spain and Italy) share the following common traits: their destination choice is more frequently driven by work opportunities, they engaged much more fre-quently in an unauthorized migration and they are less incline to return to their home country. On the contrary, migrants who followed the historical corridors were more often attracted by cultural features (common language and educational system), are less likely to be unauthorized upon entry and have a higher desire to go back in their home country. Our results thus suggest that the deflection of migrants from a destination to another is a matter of change in the composition of the migrant population. To what extent is it related to policy changes?
Our results do not allow to concluding firmly that the deflection of a specific group to a new corridor is due to more liberal policies in the new destination than in the historical destination. On the one hand, the analysis of policy trends show that new destinations have, to some extent, more liberal policies than his-torical destinations. However, on the other hand, according to migrants’ declara-tions, facilities to obtain papers does not explain their choice of a new destination country. As a matter of fact, migrants are indeed more frequently unauthorized in their new destination, which is certainly due to the fact that –in new destinations, where their community has a limited size– migrants have less social resources to immigrate following legal channels. Work actually appears as
the major motivation for migrants’ choice to shift from an old to a new destination.
Interestingly, within a same sub-system, old and new corridors are connected. The Senegalese case is a good illustration to show that historical destinations can serve as ports of entry for migrants who subsequently move to other European destinations. With no surprise, our results confirm that Mediterranean countries became ports of entry for Senegalese migrants arriving by boat. But there is no evidence of such a pattern where Senegalese migrants would enter Spain or Italy to move subsequently to Northern coun-tries, such as France. Rather, migrants who arrived there tended to remain there. Actually, additional migrants came to these countries after entering Europe through northern his-torical countries of immigration. Such a North-to-South route reminds us of the signifi-cance of social networks in determining the place of arrival, from which migrants can seek new destinations with better opportunities in terms of both work and/or legal status.
Towards a better understanding of substitution effects
In many ways, our results on African migration echo those on migration between Mexico and the US (Massey and Pren 2012). More restrictive policies in the US did not result in fewer departures from Mexico, but in less return; and increasing border control changed the amount and conditions of irregular migration, raising the number of border crossing attempts despite rising economic and human costs (Cornelius 2001; Massey et al. 2002; Massey and Pren 2012). To conceptualize these various types of unintended effects under one heading, de Haas et al. (2019) have proposed the notion of ‘substitution effects’. Most of the MAFE results support these substitution effects that stem from the migrants’ ability to adapt to changing rules in migration-management policies. However, by paying attention to differences in origin and destination contexts rather than looking at a unique corridor (Mexico-US), our results suggest that the various substitution effects are not independent from one another. For instance, the ‘categorical substitution effect’ (deflection from authorized to unauthorized migration) interacts with the ‘spatial substitution effect’ (deflection from a country to another). Indeed, unauthorized migration did not just increase in historical destinations. It is actually also higher in all new destination countries in this study. Thus, unauthorized migration is not a mere substitute for regular migration in countries that tighten their migration policies. Rather, it is an aspect of the transformation of the migration systems. Our comparative analysis also suggests that the effects of policies at destination also depend on the context in countries of origin. This observation especially applies to the ‘reverse flow substitu-tion effect’ (return delaying in contexts of entry restrictions) that may be very strong for highly unstable countries (as in DR Congo) but limited where the situation is better (as in Ghana).
A major limitation of our work is that it does not properly assess the effects of migra-tion policies on migramigra-tion behaviours. However, we hope that our tentative conclusions on the influence of the contexts –both at origin and destination– on the effectiveness of migration policies will open the floor for more systematic analyses on the unin-tended consequences of migration policies.
Table 5 Steps taken for emigration by would-be migrants in Dakar, by destination (1975–2007). % of the population living in Dakar
Africa Europe Other
Documents (asked for and/or obtained) (14) 29 47
Green card lottery (0) 1 22
University registration / scholarship (asked for and/or obtained)) (0) 5 14
Guarantee of care and provision (asked for and/or obtained) (8) 25 19
Saved money (49) 34 18
Other (4) 15 24
N 11 128 42
Source: MAFE-Senegal, biographical survey in Senegal
Population: Sample includes people currently living in Senegal (regardless of their migration status), who were born in Senegal (attempts from 1975 onward)
Note: Weighted percentages, Unweighted numbers. Percentages computed for numbers lower than 30 are in brackets. The sum of percentages may be greater or less than 100%. Several steps can be mentioned or no steps may be mentioned in some cases Statistical significance: Differences in percentages across regions were tested for each category (F-test). University registration (p < 0.10), guarantee (p > 0.10), documents (p < 0.10), saved money (p > 0.10), Green card (p < 0.01), Other (p > 0.10) = + 1 for irregular migrants
Work permit
Ex: Reduction of catalogue of occupations in short supply and of recruitment at source
= + 1 for high-skilled and low-skilled workers
Quota/target
Ex: Introduction of quota for non-EU workers in firms
= + 1 for low-skilled workers Entry visa
Ex: New requirements for students to be sponsored
= + 1 for students Points-based system
Ex: Creation of points based system for highly educated migrants =−1 for high-skilled workers
Ex: more control of employers and sanctions for irregular work = + 1 for irregular migrants Stay permit
Ex: simplification of asylum procedures =− 1 for asylum seekers
Work permit
Ex: Procedure to give family members access to work
=− 1 for family members Regularisation
Ex: Regularisation programme =− 1 for irregular migrants Access to permanent residency Ex: grounds for withdrawing residency permit limited
=− 1 for all migrants (excepted irregular) Language, housing, and cultural integration programmes Ex: widening of housing and funding for foreign workers beyond Algerians in France
=− 1 for all (excepted irregular) Access to citizenship
Ex: new requirements for naturalisation = + 1 for all migrants (excepted irregular) Access to social benefit and socioeconomic rights
Ex: Access to social system granted to legal and irregular migrants =− 1 for all migrants
Access to justice and political rights Ex: Right to appeal in court =− 1 for all migrants
Institutional capacities Ex: Creation of deportation centres
= + 1 for irregular migrants
+ 1: increasing right restrictions,− 1: decreasing right restrictions Table adapted from Flahaux et al. (2014)


![[PDF] Support de cours d’introduction aux bases de Microsoft Virtual PC | Cours informatique](data:image/gif;base64,R0lGODlhAQABAIAAAP///wAAACH5BAEAAAAALAAAAAABAAEAAAICRAEAOw==)