HAL Id: hal-01287550
https://hal.archives-ouvertes.fr/hal-01287550
Submitted on 13 Mar 2016HAL is a multi-disciplinary open access
archive for the deposit and dissemination of sci-entific research documents, whether they are pub-lished or not. The documents may come from teaching and research institutions in France or abroad, or from public or private research centers.
L’archive ouverte pluridisciplinaire HAL, est destinée au dépôt et à la diffusion de documents scientifiques de niveau recherche, publiés ou non, émanant des établissements d’enseignement et de recherche français ou étrangers, des laboratoires publics ou privés.
Multi-scale modeling of radiation heat transfer through
nanoporous superinsulating materials
Franck Enguehard
To cite this version:
Franck Enguehard. Multi-scale modeling of radiation heat transfer through nanoporous superinsu-lating materials. 17th European Conference on Thermophysical Properties, Sep 2005, Bratislava, Slovakia. �hal-01287550�
Multi-scale modeling of radiation heat transfer through nanoporous superinsulating materials
Franck Enguehard
CEA / Le Ripault, BP 16, 37260 Monts, France
Abstract
In this contribution, we focus on the extraordinarily high level of thermal insulation produced by nanoporous materials, which can achieve thermal conductivities down to a few
when they are evacuated down to a primary vacuum. Our objective here is to quantify the level of radiation heat transfer traveling through a nanoporous material in relation with its composition. Our model is based on the “non-gray anisotropically scattering Rosseland approximation”, which allows the definition of a “radiation thermal conductivity” expressed as a function of the optical properties (complex optical index spectra), mean sizes and volume fractions of the different populations of particles constituting the material. With the help of this simple model, one can draw interesting conclusions concerning the impacts of different parameters related to the microstructure of the nanoporous material on the amplitude of the radiation heat transfer. In the future, this model should help to orient the formulation of new nanoporous materials with optimized radiative properties.
1
mW.m .K− −1
Key Words
Multi-scale modeling of radiation heat transfer through nanoporous superinsulating materials
Franck Enguehard
CEA / Le Ripault, BP 16, 37260 Monts, France
1. Introduction
Nanoporous superinsulating materials (NSMs) are the subject of more and more interest for various applications (particularly in the aerospace and construction industries) due to their extraordinary power of thermal insulation [1-5]: whereas air (generally regarded as an excellent thermal insulator) has a thermal conductivity of at ambient temperature and pressure, this thermal conductivity falls down to a few for a NSM evacuated down to a primary vacuum.
-1 -1
25 mW.m .K
-1 -1
mW.m .K
Such a level of thermal insulation achieved by NSMs finds its explanation in the microstructure of these materials. Very porous (their porosity is of the order of 90%) and made of extremely fragmented solid matter (the main population of solid constituents is generally brought down to a nanometric scale), they force the conduction heat flux to travel through very tortuous routes made of a multitude of elementary thermal resistances located at the coalescences of neighboring nanoparticles. Furthermore, these materials include very small quantities of micrometric scale particles and fibers. Whereas it is generally accepted that the role of the fibers is essentially to provide mechanical reinforcement to the nanoporous structure, on the other hand the presence of the micrometric scale particles is to be related to the level of thermal radiation heat transfer traveling within the NSM: if adequately designed to provide opacity “at the right places in the infrared (IR) spectrum”, this microparticle
population can quite efficiently cut down the radiation heat flux in the course of its progression within the nanoporous structure.
In this contribution, we wish (i) to develop a model capable to quantify the level of radiation heat transfer traveling through a NSM in relation with the composition (sizes, volume fractions and physical natures of the different populations of constituents) of the material, and then (ii) to exploit this model for the determination of the characteristics (size, volume fraction and optical properties) of the ideal microparticle population that will produce a maximum opacity “at the right places in the IR spectrum”, i. e. a minimum radiation heat flux through the nanoporous structure. To this purpose, we will proceed as follows. First, we will describe in more detail the microstructure of a typical NSM, and we will introduce an idealized, extremely simplified version of this material for our calculations. Then, we will present our thermal radiation model based on the “non-gray anisotropically scattering Rosseland approximation”. As a third step, we will use our model for the calculation of the transparence spectral bands of a NSM without microparticles, and we will discuss the different interaction phenomena susceptible to take place between the IR wavelengths and the microparticle population. Finally, studies concerning (i) the microparticle volume fraction necessary for a sufficient opacity of the NSM and (ii) a possible optimum size for the microparticle population will be presented.
2. Description of the microstructure of a typical NSM and introduction of a simplified version of this material
As introduced previously, a NSM is typically made of (i) nanometric scale particles joined to one another to form a nanoporous matrix, the ultradominant constituent of the material in terms of volume fraction (near 100%), (ii) a small volume fraction (of the order of 1%) of
micrometric scale particles expected to provide IR opacity to the NSM, and (iii) a small volume fraction (of the order of 1%) of micrometric scale fibers for reinforcement of the nanoporous structure. In the following of this paper, we will ignore the existence of the fiber population: this population being essentially associated to a mechanical function, we will suppose that it does not dramatically impact on the radiative properties of the NSM.
The nanoparticles constituting the nanoporous matrix form the dominant population in terms of solid volume fraction (of the order of 5 to 10%), therefore they must be made of a material that is a good thermal insulator. In a large majority of cases, this material is chosen to be amorphous silicon oxyde a-SiO2 .
Figure 1 is a TEM image at a micrometric scale (the surface covered by this image is approximately 8 µm ) of a particular NSM made of a nanoporous matrix and of crystalline silicon carbide SiC microparticles: the nanoporous matrix appears as the gray phase, whereas the SiC microparticles are the dark inclusions.
1 µm
Figure 1: TEM image of a particular NSM made of a nanoporous matrix and of crystalline SiC microparticles. The nanoporous matrix appears as the gray phase, whereas the
SiC microparticles are the dark inclusions. The white zones as well as the parallel scratches apparent on this image are due to polishing imperfections.
2
a-SiO
The nanoporous matrix is extremely porous (its porosity is more than 90%), and a TEM observation focused on this matrix reveals its nanotexture, as shown in figure 2. This image being at a scale of the order of 100 nm (the surface covered by the image is approximately ), stacks of coalesced nanoparticles now appear (dark structures) as well as the 3-D nanoarchitecture that they constitute. A further TEM analysis focused on one nanoparticle stack allows an approximate evaluation of the average diameter of these
particles: between 10 and 20 nm.
500 nm 650 nm× a-SiO2
2
100 nm
Figure 2: TEM image of the nanoporous a-SiO2 matrix appearing in figure 1.
Pretending to develop a radiative heat transfer model within the NSM that respects the chaotic 3-D nanostructure of the matrix appears to be quite unrealistic. As a consequence, we will in the following greatly reduce the complexity the problem to be solved by simply ignoring the nanostructure of the matrix: we will separate the elementary bricks constituting the matrix, i. e. the nanoparticles, from one another and disperse this nanoparticle population randomly in space. In other words, the real NSM presenting a structured nanoporous matrix will from now on be replaced in our calculations by a virtual material presumed radiatively equivalent to the NSM and made of the following 2 particle populations: (i) a population of nanoparticles characterized by an average diameter of 10 nm and a
2 a-SiO 2 a-SiO 2 a-SiO
volume fraction of 10%, and (ii) a population of microparticles the characteristics of which (material, average diameter and volume fraction) are to be determined.
3. “Non-gray anisotropically scattering Rosseland approximation” based thermal radiation model
3.1. Notion of radiation thermal conductivity
The ambition of the work presented here being essentially to compare material solutions and to derive directions towards enhanced thermal insulation efficiencies of NSMs, the notion of radiation thermal conductivity, based on the Rosseland diffusion approximation, appears to be quite convenient.
The Rosseland diffusion approximation applies when (i) the sample is optically thick, and (ii) the scattering phenomenon within the material is isotropic. Under these 2 circumstances, the radiative flux ϕGR traversing the sample can be expressed under the following form [6]:
(
2 0)
R 0 d n L (T) 4 1 d 3 dT ∞ ν ν ν ⎡ π ⎤ ⎢ ϕ = − ν ∇ β ⎢ ⎥ ⎣∫
⎦ T ⎥ G G (1)in which ν is the optical frequency, β the extinction coefficient spectrum of the material, nν ν
its refraction index spectrum, T the temperature and the spectral blackbody emissive power distribution (commonly known as Planck’s law) at temperature T. The structure of relation (1), very similar to Fourier’s law of conduction, leads to the introduction of a “radiation thermal conductivity” function of temperature T and expressed as:
0
L (T)ν
R
(
2 0)
R 0 d n L (T) 4 1 k (T) d 3 dT ∞ ν ν ν π = β∫
ν (2)When the material is gray, expression (2) simplifies greatly and becomes:
2 3 R 16 n T k (T) 3 σ = β (3)
where σ is the Stefan-Boltzmann constant ( ). In the case of a non-gray material (which is the case of our NSMs), the general expression (2) of can be rewritten in the following manner:
-8 -2 -4 5.67 10 W.m .K R k (T) 6 2 2 2 0 2 3 2 2 R 6 2 2 0 2 C exp T n d C exp 1 T 16 T n n k (T) with 3 C exp T d C exp 1 T − ∞ λ λ − ∞ ⎛ ⎞ λ ⎜ ⎟ λ ⎝ ⎠ λ β ⎡ ⎛ ⎞ ⎤ − ⎢ ⎜λ ⎟ ⎥ σ ⎣ ⎝ ⎠ = = β β ⎛ ⎞ λ ⎜ ⎟ λ ⎝ ⎠ ⎦ λ ⎡ ⎛ ⎞− ⎤ ⎢ ⎜λ ⎟ ⎥ ⎝ ⎠ ⎣ ⎦
∫
∫
(4)where λ is the wavelength and the second constant of Planck’s law (14388 µm ). Comparing expressions (3) and (4) of the radiation thermal conductivity for a gray and a non-gray material, one notices that the quantity
2
C .K
2
n /β, independent of the wavelength for a gray material, is replaced by an average value of the n /2λ β spectrum, noted λ n /2 β in formula
(4), for a non-gray material, the weight function ω λT( ) on which the calculation of the average value n /2 β is based having the following expression:
6 2 T 2 2 C exp T ( ) C exp 1 T − ⎛ ⎞ λ ⎜ ⎟ λ ⎝ ⎠ ω λ = ⎡ ⎛ ⎞ ⎤ − ⎢ ⎜λ ⎟ ⎥ ⎝ ⎠ ⎣ ⎦ (5)
As mentioned previously, the Rosseland diffusion approximation applies when the scattering phenomenon within the material can be considered to be isotropic. This condition may not be fulfilled with our NSMs, the microparticles that they contain having sizes of the same order of magnitude as the IR wavelengths. To circumvent this difficulty, Chu et al [7] recommend to replace the spectrum appearing in the expression (4) of by an effective extinction coefficient spectrum λ β R k (T) e λ β defined by: e g λ λ λ β = β − σλ (6)
where and are the asymmetry factor and scattering coefficient spectra of the material. As a consequence, the evaluations that we will make throughout this paper of the radiation thermal conductivities of our NSMs will be based on the following formula:
gλ σλ R k (T) 2 T e 3 0 R T 0 n ( ) d 16 T k (T) 3 ( ) d ∞ λ λ ∞ ω λ λ β σ = ω λ λ
∫
∫
(7)3.2. Optical and radiative homogenization of a NSM
To perform a k (T)R evaluation as described above, one needs the refraction index (nλ) as
well as the effective extinction coefficient ( e λ
β ) spectra of the NSM under study. In the general case of a NSM made of several populations of randomly distributed particles superimposed in air, each population of particles brings its own optical (complex optical index spectrum of the material constituting the particles) and radiative (effective extinction coefficient spectrum of the population) characteristics to the ensemble, and the calculation of the optical and radiative characteristics of the NSM must rely on these inputs.
We perform the optical homogenization of our NSMs via Rayleigh’s extended rule of mixtures [8]. Applied to relative dielectric permittivities ε defined by λ
where and are the refraction and extinction indices, this rule yields:
(
)
2 n jk λ λ λ ε = − nλ kλ m h i h i m h i i f 2 2 λ λ λ λ λ λ λ ε − ε = ε − ε ε + ε∑
ε + εh λ (8)where (i) the superscripts m, h and i indicate quantities referring to the mixture, to the host material and to the different populations of inclusions respectively, and (ii) the are the volume fractions of the different populations of inclusions.
i
f
In the case of our NSMs, the host material is air (of dielectric permeability equal to 1), and 2 populations of particles are to be considered: on the one hand the nanoparticle population, and on the other hand the microparticle population. Under these circumstances, transforming formula (8) yields the following expression for the relative dielectric permittivity of the NSM: h λ ε 2 a-SiO λ ε
np np µp µp np µp np µp np µp 3f 3f 2 2 3f 3f 2 2 λ λ λ λ λ λ ε ε Π + + + ε + ε ε = Π + + + ε + ε λ 1 (9)
In this formula, the superscripts np and µp refer to the nanoparticle and microparticle populations respectively, and Π , and are the porosity of the NSM and the nanoparticle and microparticle volume fractions within the material (these 3 quantities verifying ). Expression (9) allows the calculation of the spectrum of the NSM, and subsequently its spectrum through the relation .
np f µp f np µp f f Π + + = ελ nλ ε =λ
(
nλ−jkλ)
2Our procedure for the radiative homogenization of our NSMs relies on the principle of addition of cross-sections. An effective extinction coefficient being regarded as an effective extinction cross-section per unit volume, this quantity is cumulative, so that the effective extinction coefficient spectrum e of a NSM can be evaluated simply by addition of the
λ
β e
λ
β spectra related to the nanoparticle and microparticle populations constituting the material:
e e - np e - µ
λ λ λ
β = β + β p
(10)
with the obvious notations introduced previously.
3.3. Determination of the optical and radiative properties of the nanoparticle and microparticle populations
The optical properties of the 2 particle populations (i. e. the complex optical index spectra of the 2 materials constituting these 2 populations) are taken from [9].
The process of evaluation of the radiative properties of the 2 particle populations (i. e. the 2 effective extinction coefficient spectra βe - npλ and related to these 2 populations) consists
in several steps. First we resort to the Mie theory, which accounts for the interaction of a monochromatic electromagnetic wave with a single solid particle. Mie formulae for a particle of spherical shape are given in [6]. The inputs of this calculation are on the one hand the size parameter defined by where d and λ are the particle diameter and the irradiation wavelength respectively, and on the other hand the complex optical index
e - µp λ
β
xλ xλ = π λd /
nλ−jkλ of the material constituting the particle at the irradiation wavelength λ. Applying the formulas of the Mie theory leads to the evaluation of several quantities: on the one hand the spectral absorption, scattering and extinction cross-sections (respectively sabsλ , and , with
obvious notations) produced by the particle (these 3 cross-sections verifying ), and on the other hand the spectral scattering phase function
sca
sλ sextλ
abs sca ext
sλ +sλ =sλ
( )
λ
Φ θ and the associated spectral asymmetry factor g . λ
As a second step, based on the characteristics of the interaction of the monochromatic electromagnetic wave with a single particle (results obtained above), we proceed to the calculation of the cross-sections, the phase function and the asymmetry factor when the interaction is no more with a single particle but with a population of particles of volume fraction f. If the particles constituting the population are of uniform size (assumption that we make throughout this paper for all the particle populations that we deal with), it is known [6] that the spectral scattering phase function Φ θ and hence the associated spectral λ( ) asymmetry factor are unchanged when referring either to a single particle or to a whole population. Concerning the spectral absorption, scattering and extinction cross-sections (respectively , and ) produced by a volume V occupied by the particle population,
gλ
abs
a very straightforward calculation based on the principle of summation of cross-sections yields:
abs sca ext
abs sca ext abs sca
3 3 3 6 f V s 6 f V s 6 f V s S , S and S S d d d λ λ λ λ = λ = λ = = π π π λ +Sλ (11)
so that the spectral absorption, scattering and extinction coefficients (respectively κλ, σ and λ
) produced by the particle population, defined as the related cumulated cross-sections per unit volume, have the following expressions:
λ
β
abs abs sca sca ext ext
3 3 3 S 6 f s S 6 f s S 6 f s , and V d V d V d λ λ λ λ λ λ λ λ λ κ = = σ = = β = = = κ + σ π π π λ λ 1 (12)
In the preceding developments the principle of summation of cross-sections is assumed to be valid, which may not be the case especially when the volume fraction f of the particle population is important. Here the phenomenon of dependent scattering has to be taken into consideration: this phenomenon leads to a decrease in the scattering efficiency [10] and a simultaneous increase in the absorption efficiency. These tendencies are integrated in our model via very simple correction terms that have been validated (either theoretically or experimentally) over the volume fraction domain f <0. [11]. Formulas (12) are replaced by:
abs 2 sca 4 3 4 3 2 6 f s (1 2 f ) 6 f s (1 f ) , and d (1 f ) d (1 2 f ) λ λ λ λ + − κ = σ = β = κ + σ π − π + λ λ λ (13)
3.4. Summary of our procedure for the evaluation of the radiation thermal conductivities of our NSMs
The NSM under study is supposed to be made (i) of a population of nanoparticles characterized by a complex optical index spectrum
2
a-SiO
np np
nλ −jkλ equal to the spectrum of , an uniform diameter and a volume fraction , and (ii) of a population of microparticles characterized by a complex optical index spectrum , an uniform diameter and a volume fraction
2 a-SiO dnp =10 nm fnp =10% µp µp nλ −jkλ µp d µp f .
The determination of the refraction index spectrum nλ of the NSM is performed in 3 steps: (i)
evaluation of the relative dielectric permittivity spectra of the 2 materials constituting the 2 populations via the formulas ε =npλ
(
nnpλ −jknpλ)
2 and(
)
2 µp µp µp
n jk
λ λ λ
ε = − , (ii) calculation of the relative dielectric permittivity spectrum ε of the NSM using formula (9), and (iii) derivation λ
of the refraction index spectrum nλ of the NSM by the resolution of the equation
.
(
)
2n jk
λ λ λ
ε = −
The determination of the effective extinction coefficient spectrum of the NSM is performed in 4 steps: (i) evaluation via the Mie theory of the elementary spectral cross-sections , , and as well as the spectral asymmetry factors
e λ β abs - np sλ sca - np sλ abs - µp sλ sca - µp sλ np gλ and
produced by the 2 populations, (ii) calculation of the absorption and scattering coefficient spectra , , and produced by the 2 populations using expressions (13), (iii) derivation of the effective extinction coefficient spectra
µp gλ np λ κ np λ σ µp λ κ µp λ σ e - np λ
β and of the 2 populations using the formulas:
e - µp λ
(
)
(
)
e - np np np np np np np e - µp µp µp µp µp µp µp
g 1 g and g 1 g
λ λ λ λ λ λ λ λ λ λ λ λ λ
β = β − σ = κ + − σ β = β − σ = κ + − σλ (14)
and (iv) evaluation of the effective extinction coefficient spectrum β of the NSM via the eλ
addition formula (10).
Once the nλ and β spectra of the NSM have been determined, the radiation thermal eλ conductivity of the material at a given temperature T is evaluated by numerical integration of expression (7).
R
k (T)
4. Determination of the characteristics of the ideal microparticle population
4.1. Extinction properties of the nanoporous a - SiO2 matrix
In this section, we consider a NSM made of exclusively the nanoparticle population (the characteristics of which are recalled here: uniform diameter and volume fraction ). 2 a-SiO np d =10 nm np f =10%
Before proceeding to the n , and evaluations as described above, we must determine the spectral interval
[
λ βeλ k (T)R
]
1; 2
λ λ that is relevant to the calculations. Clearly, the bounds of this interval result from the features of the weight function ω λT( ) appearing in the expression (7) of the radiation thermal conductivity . This function has a shape that is very similar to the one of Planck’s law , and a numerical analysis shows (i) that
1% of the total weight lies within the spectral interval
R k (T) ω λT( ) 0 L (T)λ T 0 ( ) d ∞ ω λ λ
∫
1251 µm.K 0 ; T ⎡ ⎤ ⎢ ⎥ ⎣ ⎦, and(ii) that 1% of the total weight T
0
( ) d
∞
ω λ λ
∫
lies within the spectral interval 15967 µm.K ; T ⎡ ∞ ⎢⎣ ⎣ ⎡⎢ . In other words, the spectral interval 1251 µm.K 15967 µm.K;
T T
⎡ ⎤
⎢ ⎥
⎣ ⎦
contains 98% of the total weight T
0
( ) d
∞
ω λ λ
∫
and hence can be regarded as the relevant spectral interval[
λ1(T) ;λ2(T)]
for the calculations. At room temperature , this interval[
T=300K
]
1(T) ; 2(T)
λ λ is approximately
[
4 µm ; 54 µm]
.The nanoparticles being very small compared to the IR wavelengths, the size parameters are also very small, and the interaction between the IR wavelengths and the nanoparticle population degenerates into the well-known Rayleigh scattering phenomenon [6]. Under these circumstances, the ultradominant mode of extinction is absorption ( ), so that the effective extinction spectrum
2 a-SiO np np xλ = πd /λ np np λ σ << κλ e - np λ β of the nanoparticle population is equal to its absorption spectrum κ and is in direct relation with the extinction npλ
index spectrum np of . kλ a-SiO2
The complex optical index spectrum nnpλ −jkλnp of a-SiO2 is taken from [9], and the np
kλ
component of this spectrum is reproduced in figure 3. In this figure are also plotted 2 vertical dashed lines indicating the bounds of the relevant spectral interval at room temperature.
appears to be very transparent (
2
a-SiO knpλ ≤10−4) for wavelengths between 0.16 µm and 4.1 µm: this spectral band can then be expected to contribute strongly to the radiation thermal conductivity of the nanoporous matrix. On the other hand, this spectral band overlaps very little with the relevant spectral interval at room temperature (the overlap is limited to
[
R
k (T) a-SiO2
]
R
k (T) of the nanoporous matrix at room temperature can be expected to come from a narrow spectral interval centered at .
2 a-SiO 4 µm λ = 0.1 1 4 10 100 1000 10-5 10-4 10-3 10-2 10-1 100 101 0.1 1 10 54100 1000 k λ (µm)
Figure 3: extinction index spectrum of a-SiO2 (taken from [9]).
As seen previously, the evaluation of the radiation thermal conductivity results from the integration over the whole spectrum of the quantity
R k (T) 2 T( ) n / e λ λ ω λ β e (refer to formula (7)). After calculation of the n and spectra of the nanoporous matrix through the procedure described in section 3., one obtains the
λ βeλ a-SiO2
2 T( ) n /λ λ
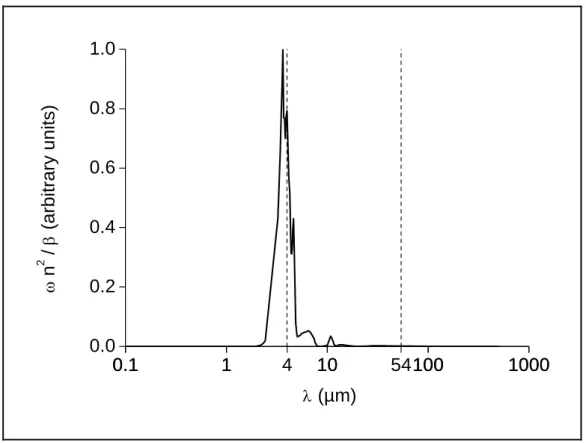
ω λ β spectrum (at room temperature) of figure 4. This plot confirms that the wavelengths contributing to the radiation thermal conductivity of the nanoporous matrix at room temperature are located essentially around 4 µm: a numerical analysis reveals that 60% of the integral
R
2 T e 0 n ( ) d ∞ λ λ ω λ λ β
∫
is provided by the spectral band[
3.4 µm ; 5.6 µm]
. From this calculation one derives an immediate consequence concerning the microparticle population that is inserted into a NSM in order to cut down its radiation thermal conductivity at room temperature: for an improved efficiency, this microparticle population should be designed to provide a strong extinction around 4 µm.R k (T) 0.1 1 10 54100 1000 0.0 0.2 0.4 0.6 0.8 1.0 0.1 1 4 10 100 1000 ω n 2 / β (arbitrary units) λ (µm)
Figure 4: calculated spectrum of the nanoporous matrix at room
temperature. 2 T( ) n /λ ω λ βe λ e λ 2 a-SiO
The spectrum of figure 4 allows the numerical evaluation (via formula (7)) of the radiation thermal conductivity of the nanoporous matrix at room temperature: . Compared to the order of magnitude of the effective thermal conductivity of a NSM related to solid heat conduction (a few under primary
2 T( ) n /λ ω λ β R k (T) a-SiO2 -1 -1 6.6 mW.m .K -1 -1 mW.m .K
vacuum), this value of for the radiation thermal conductivity is quite important and must be reduced by the proper choice of the characteristics (i. e. material, diameter and volume fraction) of the microparticle population.
-1 -1
6.6 mW.m .K
4.2. Study of the interaction phenomena between the IR wavelengths and the microparticle population and of their impacts on the radiation thermal conductivity of a NSM
As written above, for an improved efficiency of radiative insulation of a NSM, the microparticle population that it contains should be designed to provide a strong extinction around 4 µm. There are 2 ways to provide extinction: absorption and scattering. In order to decorrelate the impacts of these 2 extinction modes on the T( ) n /2
e λ λ
ω λ β spectrum of a NSM, we have selected 2 materials presenting extremely different optical extinction properties around 4 µm: (i) at one extreme, , very transparent around 4 µm ( at this wavelength), and (ii) at the other extreme, graphite, very opaque around 4 µm ( at this wavelength) (the extinction index spectrum of graphite (taken from [9]) is plotted in figure 5).
2
a-SiO kλ =6 10-5
0.1 1 4 10 100 10-1 100 101 102 k λ (µm)
Figure 5: extinction index spectrum of graphite (taken from [9]).
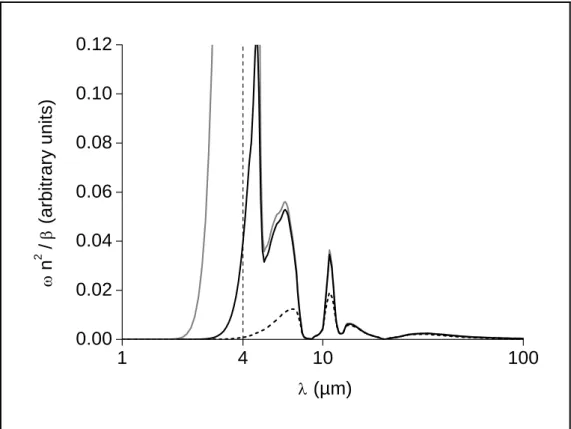
We have calculated the spectra (at room temperature) of the 2 NSMs constituted on the one hand of the same nanoparticle population (material = , uniform diameter , volume fraction ) and on the other hand of 2 microparticle populations (uniform diameter , volume fraction ) differing only by the nature of the material constituting the microparticles ( or graphite). These 2
spectra are plotted on the graphs of figures 6 and 7 (figure 7 is an enlargement of figure 6) together with the
2 T( ) n /λ ω λ βe λ % e λ e 2 a-SiO np d =10 nm fnp =10% µp d =1 µm fµp =1 2 a-SiO 2 T( ) n /λ ω λ β 2 T( ) n /λ λ
ω λ β spectrum of the nanoporous matrix (previously exhibited in figure 4).
2
1 4 10 100 0.0 0.2 0.4 0.6 0.8 1.0 ω n 2 / β (arbitrary units) λ (µm)
Figure 6: calculated ω λT( ) n /2λ β spectra (at room temperature) (i) of the NSM containing a eλ
microparticle population (solid line), and (ii) of the NSM containing a graphite microparticle population (dashed line). The grey solid line represents the
spectrum of the nanoporous matrix (previously exhibited in figure 4).
2 a-SiO 2 e T( ) n /λ λ ω λ β 2 a-SiO
1 4 10 100 0.00 0.02 0.04 0.06 0.08 0.10 0.12 ω n 2 / β (arbitrary units) λ (µm)
Figure 7: enlargement of figure 6.
Quite clearly, the addition of microparticles (whatever their nature) to the nanoporous matrix results in significantly reduced values of the 2
T( ) n / e λ λ
ω λ β spectrum and hence in a significantly lower value of the radiation thermal conductivity : whereas this parameter was for the nanoporous matrix, it falls down to when microparticles are incorporated into the matrix, and to when the microparticles are replaced by graphite microparticles. The role of the microparticle population within a NSM is therefore clearly demonstrated: whatever its nature, it contributes to cut down the radiation thermal conductivity of the NSM by providing extinction to the ensemble. R k (T) -1 -1 6.6 mW.m .K a-SiO2 1.7 mW.m .K-1 -1 2 a-SiO 0.7 mW.m .K-1 -1 2 a-SiO
In the case of the microparticle population, the constitutive material being very transparent for wavelengths under 4 µm, no absorption can be expected from this population
2
over this wavelength interval. In order to confirm this point, referring to the expression of the effective extinction coefficient e
(
)
1 g
λ λ λ λ
β = κ + − σ , we have calculated an effective albedo spectrum e for the microparticle population, this spectrum
λ
Ω a-SiO2
e λ
Ω being defined by:
(
)
(
)
(
)
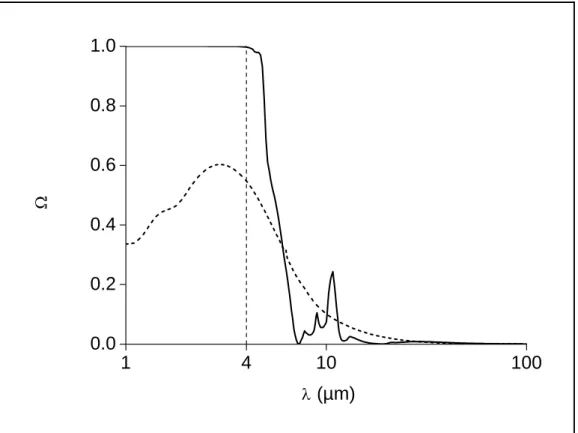
e e 1 g 1 g 1 g λ λ λ λ λ λ λ λ − σ − σ Ω = = β κ + − σλ % (15)The spectrum of the microparticle population ( and ) is plotted on the graph of figure 8. The
e λ Ω a-SiO2 µp d =1 µm µp f =1 e λ
Ω values of this population are equal to 1 for wavelengths under 4 µm, which proves that the microparticle population provides extinction to the NSM over this spectral band exclusively through the scattering phenomenon.
2
1 4 10 100 0.0 0.2 0.4 0.6 0.8 1.0 Ω λ (µm)
Figure 8: effective albedo spectra (i) of the microparticle population (
and ) (solid line), and (ii) of the graphite microparticle population (same and ) (dashed line). e λ Ω a-SiO2 dµp =1 µm % % µp f =1 µp d µp f
The case of the graphite microparticle population is different in that graphite is strongly absorbing at IR wavelengths. One can then anticipate that this population provides extinction through the superposition of the scattering and absorption phenomena. The spectrum of the graphite microparticle population ( and ), also plotted on the graph of figure 8, confirms this point: around 4 µm, the effective albedos have values around 0.5, which means that scattering and absorption participate at identical levels to the overall extinction provided by the graphite microparticle population.
e λ
Ω
µp
d =1 µm fµp=1
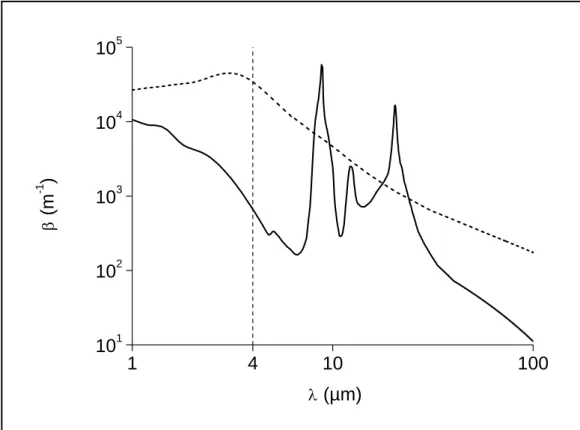
Scattering being the only source of extinction for the microparticle population, one expects the level of IR opacity provided by this population to be lower than the one provided
2
by the graphite microparticle population, for which absorption also contributes to the overall extinction. The plot of figure 9, showing the effective extinction coefficient spectra of the 2 and graphite microparticle populations, corroborates this argument: except over the phonon absorption band located between 9 µm and 21 µm, the values of the graphite population are significantly higher than the ones of the population, resulting in a lower value of the radiation thermal conductivity of the NSM when made of the graphite microparticle population. However, it is to be underlined that, although the addition of absorption to the extinction phenomenon (by the replacement of the population by a graphite population) appears to be quite efficient in cutting down the radiation thermal conductivity (this parameter passes from to when the
microparticles are replaced by graphite microparticles), the scattering phenomenon itself as a source of extinction is also very productive: the radiation thermal conductivity of the
nanoporous matrix passes from to when
microparticles are incorporated into the matrix.
e λ β 2 a-SiO 2 a-SiO βeλ 2 a-SiO R k (T) 2 a-SiO -1 -1 1.7 mW.m .K 0.7 mW.m .K-1 -1 a-SiO2 2 a-SiO 6.6 mW.m .K-1 -1 1.7 mW.m .K-1 -1 a-SiO2
1 4 10 1 101 102 103 104 105 00 β (m -1 ) λ (µm)
Figure 9: effective extinction coefficient β spectra (i) of the eλ microparticle population ( and ) (solid line), and (ii) of the graphite microparticle
population (same and ) (dashed line).
2 a-SiO µp d =1 µm µp f = %1 µp d µp f
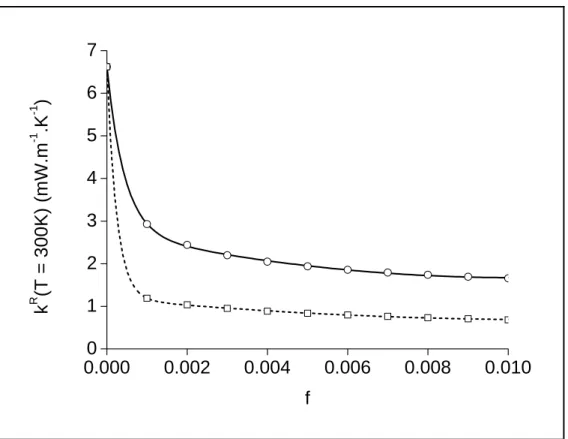
5. Order of magnitude of the volume fraction of the microparticle population
The radiation thermal conductivity model described previously can give interesting information concerning the order of magnitude of the microparticle population volume fraction that is necessary for an efficient cut down of the radiation heat flux through a NSM. In this section, we focus on 2 particular NSMs made of the same nanoparticle population ( and ) and of 2 microparticle populations of identical diameters ( ) differing only by the nature of the material constituting the microparticles: for NSM1 and graphite for NSM2. The plot of figure 10 shows the
2 a-SiO np d =10 nm fnp =10% µp d =1 µm 2 a-SiO
evolution of the radiation thermal conductivities (at room temperature) of these 2 NSMs versus the microparticle population volume fractions . This figure clearly indicates that the quantity falls down considerably as soon as a tiny microparticle population is inserted into the NSM: a value of the microparticle population volume fraction as small as 1‰ produces a radiation thermal conductivity that is divided by a factor of 2.3 for NSM1 and of 5.6 for NSM2. On the other hand, once this rapid evolution of versus is passed away, the radiation thermal conductivity decreases very slowly with the volume fraction , so that, based on this behavior of the curve, it appears counterproductive to incorporate an important volume fraction of microparticles into a NSM: an augmented value of the parameter (say a few % instead of a few ‰) will have virtually no impact on the radiation thermal conductivity but on the other hand could possibly affect (via the percolation phenomenon) the solid thermal conductivity of the material.
R k (T) µp f R k (T) µp f R k (T) R k (T) µp f k (T)R µp f fµp 6k (R T) µp f R k (T)
0.000 0.002 0.004 0.006 0.008 0.010 0 1 2 3 4 5 6 7 k R (T = 300K) (mW .m -1 .K -1 ) f
Figure 10: dependence of the radiation thermal conductivity of a NSM (at T ) as a function of the microparticle population volume fraction . The circles and the solid curve refer to a NSM made of a nanoparticle population ( and )
and of a microparticle population ( ). The squares and the dashed curve refer to a NSM made of the same nanoparticle population and of a graphite microparticle population with an unchanged microparticle diameter ( ). The circles and squares correspond to values produced by our model, and the solid and dashed curves are
fits of these 2 series of data.
R k (T) =300K µp f 2 a-SiO np d =10 nm np f =10% 2 a-SiO µp d =1 µm 2 a-SiO µp d =1 µm
6. Optimum size for the microparticle population
As said earlier, for an improved efficiency of radiative insulation of a NSM, the microparticle population that it contains should be designed to provide a strong extinction around 4 µm. If
the material constituting this microparticle population is given, its extinction index spectrum and related absorption bands or peaks are also given, and in no way the average diameter of the microparticle population will change the spectral locations of these absorption sources. On the other hand, it is well-known that the value of the parameter impacts on the spectral location of the scattering phenomenon, so that it may reasonably be expected that an optimum microparticle population diameter exists for which the scattering phenomenon is positioned exactly over the tracked wavelength of 4 µm.
µp d µp d µp d
For the purpose of illustration, let us first consider a microparticle population made of graphite and of volume fraction equal to 1‰ . For 5 different values (100 nm, 300 nm, 1 µm, 3 µm and 10 µm) of the uniform diameter of this population (the volume fraction being held constant at 1‰), we have calculated the resulting effective albedo and effective extinction coefficient spectra produced by the population. For each value of the diameter , these 2 spectra and are plotted versus the size parameter
on the graphs of figures 11 and 12.
µp f µp d fµp e - µp λ Ω e - µp λ β µp d Ωe - µpλ βe - µpλ µp µp xλ = πd /λ
10-3 10-2 10-1 100 101 102 0.0 0.2 0.4 0.6 0.8 1.0 Ω x = π d / λ
Figure 11: effective albedo spectra of 5 graphite microparticle populations of identical volume fractions ( ) differing only by the microparticle uniform diameter (100
nm, 300 nm, 1 µm, 3 µm and 10 µm). The 5 spectra are plotted versus the size parameters . The arrow on the figure indicates increasing values of .
e - µp λ Ω µp f =1‰ dµp e - µp λ Ω µp µp xλ = πd /λ dµp
10-3 10-2 10-1 100 101 102 10-1 100 101 102 103 104 105 β (m -1 ) x = π d / λ
Figure 12: effective extinction coefficient spectra of 5 graphite microparticle populations of identical volume fractions ( ) differing only by the microparticle uniform diameter (100 nm, 300 nm, 1 µm, 3 µm and 10 µm). The 5 spectra are plotted versus the size parameters
e - µp λ β µp f =1‰ µp d βe - µpλ µp µp xλ = πd /λ
)
. Each spectrum contains a circle indicating the point
(
where the wavelength λ is 4 µm. The arrow on the figure indicatesincreasing values of .
µp e - µp
xλ ;βλ
µp
d
The plot of figure 11 reveals maxima of the 5 Ωe - µpλ curves that are all located at xµpλ ≈ 1 (when these maxima appear). This means that, a diameter being given for the graphite microparticle population, the fraction of the overall extinction produced by this population through the scattering phenomenon is maximum at wavelengths λ of the order of . In the particular case studied here, this increase in the rate of participation of the scattering for
µp
d
µp
d π
µp
xλ ≈1 comes with an increase in the overall extinction over this size parameter domain, as
shown on the graph of figure 12: similarly to the curves of figure 11, the 5 effective extinction coefficient βe - µpλ spectra displayed in figure 12 exhibit maxima that are all located at xµpλ ≈ 1 (when these maxima appear). Moreover, for each of the 5 spectra of this plot, we have positioned a circle indicating the location of the tracked wavelength of 4 µm, and these 5 circles clearly reveal the existence of an optimum graphite microparticle diameter producing a maximum effective extinction coefficient at
e - µp λ
β
e - µp λ
β λ =4 µm: this optimum diameter is probably such that its related size parameter at λ =4 µm is equal to 1.
The squares and the dashed curve of figure 13 show the evolution as a function of the microparticle diameter of the radiation thermal conductivity at T of a
NSM made of a nanoparticle population ( and ) and of a
graphite microparticle population ( ) ( values on the right scale). When the diameter is very small compared to IR wavelengths, the size parameters are very small compared to 1, and virtually no scattering is produced by the microparticle population. The level of radiation thermal conductivity is then dictated by the absorption phenomenon only, and is independent of the microparticle diameter . Let us note here the extraordinarily high absorption efficiency of the graphite particles: very small (10 nm or less in size) and added to the nanoporous matrix with a volume fraction as tiny as 1‰ , they result in a decrease in the radiation thermal conductivity of the ensemble by a factor of 3 (we recall that the radiation thermal conductivity of the nanoporous matrix is appromimately at room temperature). Increasing the diameter , one reaches a certain threshold (of approximately 100 nm) beyond which the scattering phenomenon starts to contribute consequently to the extinction process. It follows that the
µp d k (T)R =300K 2 a-SiO dnp =10 nm fnp =10% µp f =1‰ k (T)R µp d R k (T) µp d 2 a-SiO 2 a-SiO -1 -1 6.6 mW.m .K µp d
radiation thermal conductivity starts to decrease steadily until it reaches a minimum value when the scattering phenomenon operates exactly over the main transparence spectral band (located around ) of the nanoporous matrix. The optimum microparticle diameter introduced above is thus quite apparent on the graph of figure 13: the choice of this particular diameter for the graphite microparticle population can lead to a decrease in the radiation thermal conductivity of the NSM by a factor of almost 2. Finally, the value of the optimum microparticle diameter can be estimated from figure 13 to be approximately 1.6 µm. This value is in fairly good agreement with the one (1.3 µm) expected from the “ at ” criterion stated above.
R k (T) 4 µm λ = a-SiO2 µp µp xλ = πd /λ = 1 λ =4 µm
10-3 10-2 10-1 100 101 2 4 6 8 10 0.6 1.0 1.4 1.8 2.2 k R (T = 300K) (mW.m -1 .K -1 ) d (µm) k R (T = 300K) (mW.m -1 .K -1 )
Figure 13: dependence of the radiation thermal conductivity of a NSM (at T ) as a function of the microparticle population diameter . The circles and the solid curve refer to a NSM made of a nanoparticle population ( and ) and
of a microparticle population ( ) ( values on the left scale). The squares and the dashed curve refer to a NSM made of the same nanoparticle population and of a graphite microparticle population with an unchanged volume fraction ( ) ( values on the right scale). The circles and squares correspond to values
produced by our model, and the solid and dashed curves are fits of these 2 series of data.
R k (T) =300K µp d 2 a-SiO dnp =10 nm fnp =10% 2 a-SiO fµp =1‰ k (T)R 2 a-SiO µp f =1‰ k (T)R
In the case of a microparticle population made of , things are more difficult to analyze because of the complex shape of the extinction index spectrum of the material. The equivalent of figure 12 applied to microparticle populations yields the graph of figure 14: this graph is not as easy to read as the one of figure 12, but at least it clearly indicates, through the
2
a-SiO
2
5 circles located on the 5 spectra at the parameter sizes where the wavelength λ is 4 µm, that once again an optimum microparticle diameter exists, located around the value of 3 µm, for which the extinction produced by the microparticle population – exclusively through the scattering phenomenon – hits the
e - µp λ β 2 a-SiO 4 µm
λ ≈ IR zone in the most efficient way. This point is corroborated by the circles and the solid curve of figure 13, which show the evolution as a function of the microparticle diameter of the radiation thermal conductivity at of a NSM made of a nanoparticle population ( and ) and of a microparticle population ( ) ( values on the left scale). For very small values of the microparticle diameter , neither scattering nor absorption are produced by the microparticle population, so that the radiation thermal conductivity of the NSM is equal to the one of the nanoporous matrix ( ). The optimum diameter for the microparticle population (corresponding to an optimum spectral localization of the scattering phenomenon) is around 3 µm, and the choice of this particular microparticle diameter leads to a decrease in the radiation thermal conductivity of the NSM by a factor of 3.
µp d R k (T) T=300K a-SiO2 dnp =10 nm np f =10% a-SiO2 fµp =1‰ k (T)R µp d 2 a-SiO R k (T) a-SiO2 -1 -1 6.6 mW.m .K a-SiO2
10-3 10-2 10-1 100 101 102 10-1 100 101 102 103 104 β (m -1 ) x = π d / λ
Figure 14: effective extinction coefficient spectra of 5 microparticle populations of identical volume fractions ( ) differing only by the microparticle uniform diameter (100 nm, 300 nm, 1 µm, 3 µm and 10 µm). The 5 spectra are plotted versus the size parameters
e - µp λ β a-SiO2 µp f =1‰ µp d βe - µpλ µp µp xλ = πd /λ
)
. Each spectrum contains a circle indicating the point
(
where the wavelength λ is 4 µm. The arrow on the figure indicatesincreasing values of .
µp e - µp
xλ ;βλ
µp
d
7. Summary and perspectives
In the first part of this contribution, we have presented a model for the evaluation of the radiation heat transfer traveling through NSMs in relation with the compositions (sizes, volume fractions and physical natures of the different populations of constituents) of these materials. Our model is very rudimentary: it relies on the Rosseland diffusion approximation
and the related notion of radiation thermal conductivity. Nevertheless, we have extended the field of application of this theory in order to integrate spectral dependencies of the radiative properties of the constituents as well as anisotropic scattering effects in our calculations. Besides, the notion of radiation thermal conductivity being based on the concepts of refraction index and effective extinction coefficient spectra, we have detailed the principles of the optical and radiative homogenization techniques that we employ for the determination of these 2 spectra in the case of a NSM of known composition.
In the second part of this paper, we have used our model (i) to get a better understanding of the different radiative transfer phenomena that take place within NSMs, and (ii) if possible, to derive directions towards enhanced radiative insulation efficiencies of these materials. First, we have demonstrated that a nanoporous matrix presents an unacceptable transparence behavior over a narrow spectral band located around 4 µm, and we have deduced that an efficient microparticle population, i. e. a microparticle population able to cut down the radiation thermal conductivity of the matrix, must provide a strong extinction over this transparence spectral domain. Then, in order to decorrelate the scattering and absorption phenomena in the extinction process, we have selected, for the constitution of the microparticle populations, 2 materials presenting extremely different optical properties around the tracked wavelength of 4 µm: on the one hand, , very transparent, and on the other hand, graphite, very opaque. The different series of calculations that we have performed on the 2 NSMs described above (the first NSM being made of a nanoporous matrix and of a microparticle population, and the second NSM being made of the same nanoporous matrix and of a graphite microparticle population) have brought us to the following conclusions: (i) whatever the material constituting the microparticle population, provided the average diameter of this population is of the right order of
2 a-SiO 2 a-SiO 2 a-SiO a-SiO2 2 a-SiO µp d
2
a-SiO matrix contributes to an efficient cut down of the radiation thermal conductivity of the NSM; (ii) if the material constituting the microparticle population is transparent around 4 µm, extinction is produced by the microparticles exclusively via the scattering phenomenon; (iii) if, on the other hand, the material is opaque around 4 µm, both scattering and absorption contribute to the extinction process, resulting in an optimized efficiency of the microparticle population in terms of opacity production; (iv) the scattering phenomenon from a microparticle population of uniform diameter impacting the spectral domain around a wavelength λ given by , it follows that the diameter of the microparticles must be of the order of 1 µm (in order the scattering phenomenon to track the
wavelengths) and that an optimum diameter exists for which the scattering process hits the IR zone in the most efficient way; (v) finally, the radiation thermal conductivity of a NSM falls down considerably as soon as a volume fraction as small as 1‰ of the microparticle population is inserted into the material. All these conclusions will be exploited in the near future: they should guide us towards the formulation of new NSMs with optimized radiative properties. µp d µp d / 1 π λ ≈ µp d 4 µm λ ≈ µp d 4 µm λ ≈
Obviously, the modeling strategy that we have chosen is extremely basic. Investigation of the radiation heat transfer and of the interaction of this radiation mode with the conduction mode within nanoporous superinsulating materials is actually a vast research subject involving numerous activities in various fields such as radiative homogenization, coupled radiation and conduction heat transfer within semitransparent materials and thermal characterization. As far as heat transfer modeling is concerned, we will concentrate in the future on several studies related to the radiative homogenization theme: (i) impact of the nanometric scale of the particles on the features of their dielectric permittivity function (the phonons within such tiny particles having quasi-ballistic behaviors); (ii) effect of a non-uniform distribution
2
of the nanoparticle diameters on the effective radiative properties of the nanoporous matrix (during the fabrication process, the nanoparticles coalesce to one another and form agglomerates the sizes of which can reach several hundreds of nm); (iii) deeper analysis of the dependent nature of the scattering phenomenon, especially within the nanoporous matrix; (iv) finally, integration of the fibers in the radiative homogenization procedure. 2 a-SiO 2 a-SiO a-SiO2 2 a-SiO References
1. H. M. Strong, F. P. Bundy and H. P. Bovenkerk, J. Appl. Phys. 31:39 (1960).
2. H. Bjurström, E. Karawacki and B. Carlsson, Int. J. Heat Mass Transfer 27:2025 (1984). 3. D. W. Yarbrough, T. W. Tong and D. L. McElroy, High Temp. Sci. 19:213 (1985).
4. P. Scheuerpflug, R. Caps, D. Buttner and J. Fricke, Int. J. Heat Mass Transfer 28:2299 (1985).
5. C. Stark and J. Fricke, Int. J. Heat Mass Transfer 36:617 (1993).
6. M. F. Modest, Radiative Heat Transfer (McGraw-Hill, New York, 1993). 7. C. M. Chu and S. W. Churchill, Trans. Antennas Propagation AP-4:142 (1956).
8. C. F. Bohren and D. R. Huffman, Absorption and Scattering of Light by Small Particles (Wiley, New York, 1983).
9. Optical properties of : Handbook of Optical Constants of Solids, edited by E. D. Palik (Academic Press, San Diego, 1985); optical properties of graphite: Handbook of
Optical Constants of Solids II, edited by E. D. Palik (Academic Press, San Diego, 1991).
2
a-SiO
10. M. Kaviany, Principles of Heat Transfer in Porous Media, second edition (Springer, New York, 1995).


![Figure 3: extinction index spectrum of a-SiO 2 (taken from [9]).](https://thumb-eu.123doks.com/thumbv2/123doknet/13603984.424197/18.892.160.738.237.664/figure-extinction-index-spectrum-sio-taken.webp)
![Figure 5: extinction index spectrum of graphite (taken from [9]).](https://thumb-eu.123doks.com/thumbv2/123doknet/13603984.424197/21.892.164.734.106.532/figure-extinction-index-spectrum-graphite-taken.webp)