HAL Id: cea-02906391
https://hal-cea.archives-ouvertes.fr/cea-02906391
Submitted on 24 Jul 2020
HAL is a multi-disciplinary open access archive for the deposit and dissemination of sci-entific research documents, whether they are pub-lished or not. The documents may come from teaching and research institutions in France or abroad, or from public or private research centers.
L’archive ouverte pluridisciplinaire HAL, est destinée au dépôt et à la diffusion de documents scientifiques de niveau recherche, publiés ou non, émanant des établissements d’enseignement et de recherche français ou étrangers, des laboratoires publics ou privés.
BN-600 Hybrid core benchmark analyses
Y. Kim, A. Stanculescu, P. Finck, R.N. Hill, K.N. Grimm, G. Rimpault, T.
Newton, Z.H. Li, P. Mohanakrishnan, M. Ishikawa, et al.
To cite this version:
Y. Kim, A. Stanculescu, P. Finck, R.N. Hill, K.N. Grimm, et al.. BN-600 Hybrid core benchmark analyses. PHYSOR 2002 - International Conference on the New Frontiers of Nuclear Technology: Reactor Physics, Safety and High-Performance Computing, Oct 2002, Seoul, South Korea. �cea-02906391�
BN-600 HYBRID CORE BENCHMARK ANALYSES
Y. I. Kim and A. Stanculescu International Atomic Energy Agency (IAEA)
Wagramer Strasse 5, P.O. Box 100 A-1400 Vienna, Austria
Young-In.Kim@iaea.org; A.Stanculescu@iaea.org P. Finck, R. N. Hill and K. N. Grimm (ANL), U.S.A.
G. Rimpault (CEA Cadarache), France T. Newton (Serco Assurance), U.K.
Z. H. Li (CIAE), P.R. China P. Mohanakrishnan (IGCAR), India
M. Ishikawa (JNC), Japan H. Song (KAERI), Rep. of Korea M. Farakshin (OKBM), Russian Federation
V. Stogov (IPPE), Russian Federation
ABSTRACT
Benchmark analyses for the hybrid BN-600 reactor that contains three uranium enrichment zones and one plutonium zone in the core, have been performed within the frame of an IAEA sponsored Co-ordinated Research Project. The results for several relevant reactivity parameters obtained by the participants with their own state-of-the-art basic data and codes, were compared in terms of calculational uncertainty, and their effects on the ULOF transient behavior of the hybrid BN-600 core were evaluated.
The comparison of the diffusion and transport results obtained for the homogeneous representation generally shows good agreement for most parameters between the RZ and HEX-Z models. The burnup effect and the heterogeneity effect on most reactivity parameters also show good agreement for the HEX-Z diffusion and transport theory results. A large difference noticed for the sodium and steel density coefficients is mainly due to differences in the spatial coefficient predictions for non-fuelled regions. The burnup reactivity loss was evaluated to be 0.025 (4.3 $) within ~ 5.0% standard deviation. The heterogeneity effect on most reactivity coefficients was estimated to be small. The heterogeneity treatment reduced the control rod worth by 2.3%. The heterogeneity effect on the keff
and control rod worth appeared to differ strongly depending on the heterogeneity treatment method. A substantial spread noticed for several reactivity coefficients did not give a significant impact on the transient behavior prediction. This result is attributable to compensating effects between several reactivity effects and the specific design of the partially MOX fuelled hybrid core.
1. INTRODUCTION
This paper presents the results of benchmark analyses of a hybrid UOX/MOX fuelled core of the BN-600 reactor. These benchmark core analyses have been performed within the frame of the IAEA sponsored Co-ordinated Research Project (CRP) on "Updated Codes and Methods to Reduce the Calculational Uncertainties of the LMFR Reactivity Effects,” commenced in 1999. The general
objective of this CRP is to validate, verify and improve methodologies and computer codes used for the calculation of reactivity coefficients in fast reactors aiming at enhancing the utilization of plutonium and minor actinides.
There has been no change in the view that energy production with breeding of fissile materials is the main goal of fast reactor development to ensure long-term fuel supply. However, before the breeding role of fast reactors is recognized economically, due to the increasingly available low-cost uranium from the 1980s onwards, the emphasis of fast reactor development shifted to incineration of stock-piled plutonium and partitioning and transmutation (P&T) of nuclear wastes to meet contemporary demands.
Following a proposal by the Russian Federation, a hybrid UOX/MOX (mixed oxide) fuelled BN-600 reactor core that has a combination of highly enriched uranium (HEU) and mixed oxide (MOX) assemblies in the core region, was chosen as a calculational model [1]. Hence the benchmark clearly addresses the issues of weapons-grade plutonium utilization for energy production in a mixed UOX/MOX fuelled core of the BN-600 reactor.
Nine organizations from eight Member States and the IAEA participated in the hybrid BN-600 core benchmark analyses. The input data for the benchmark neutronics calculations prepared by OKBM and IPPE, have been reviewed and modified in the first meeting of the CRP [1]. The benchmark analyses consist of three Phases during 1999 – 2001: RZ homogeneous benchmark (Phase 1), HEX-Z homogeneous benchmark (Phase 2), and HEX-Z heterogeneous and burnup benchmark (Phase 3). This paper first addresses the benchmark definitions and specifications given for each Phase and briefly introduces the basic data, computer codes, and methodologies applied to the benchmark analyses by the various participants. Then, the results obtained by the participants in terms of calculational uncertainty and their effect on the core transient behavior are inter-compared. Finally it addresses some preliminary conclusions to be drawn at this stage of the benchmark.
2. DESCRIPTIONS OF BENCHMARKS
2.1. BENCHMARK MODELS
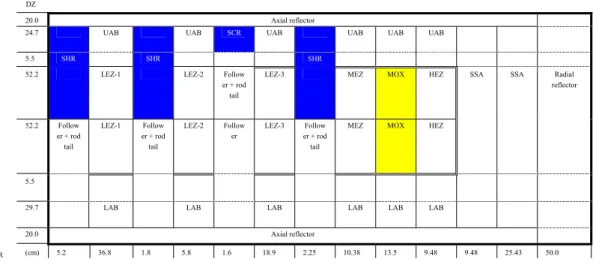
The input data including RZ and HEX-Z calculational models for the BN-600 benchmark calculations are completely described in the benchmark definitions [1, 2]. The hexagonal-Z (HEX-Z) calculational model, a 60o sector of the layout of the benchmark core, is shown in Fig. 1. The calculational model
corresponds to the 1470 MWth total power BN-600 reactor at the beginning of an equilibrium cycle,
when the impact of the control rods is the strongest. The core consists of a low enrichment inner zone (LEZ), a middle enrichment zone (MEZ), and a high enrichment outer zone (HEZ). Between MEZ and HEZ a mixed oxide zone (MOX) is located. Three control rod (SHR) zones and one scram rod (SCR) zone, consisting of 19 shim control rods and 6 scram control rods respectively, are interspersed radially in LEZ. The outer core zone is bounded by two steel shielding zones, followed by a radial reflector zone. The RZ calculational model indicating the axial positions of the control rods is shown in Fig. 2. In the SHR zone the bottom of the absorber is parked at the core midplane, whereas in the SCR zone the absorber is parked above the enriched fuel region.
From the composition specifications, each enriched fuel zone with axially uniform atomic fractions has an average fuel burnup of 2 – 3%. The LEZ, MEZ, and HEZ have uranium enrichments of 17, 21 and 26wt.% for feed fuel, respectively. The MOX contains plutonium of enrichment 21.3wt.% with
1 1 1 1 2 2 2 3 4 4 5 8 9 9 10 1 1 1 2 2 2 6 3 4 5 8 9 9 9 10 1 1 2 7 2 2 3 3 5 8 9 9 9 10 6 2 2 2 2 3 4 4 5 8 9 9 10 2 2 2 2 3 4 4 5 8 9 9 10 2 2 6 3 4 4 5 8 9 9 10 2 3 3 4 4 5 8 9 9 9 10 3 4 4 5 5 8 9 9 9 10 4 4 5 8 8 9 9 9 10 5 5 8 9 9 9 10 10 8 8 9 9 9 10 9 9 9 9 10 9 9 9 10 9 10 10 10 Subassembly types 1, 2 – LEZ SA 3 – MEZ SA 4 – MOX SA 5 – HEZ SA 6 – SHR 7 – SCR
8 – SSA (1st row) 9 – SSA (2nd – 4th rows)
10 – Radial reflector
6 1 1 1 6 2 2 2 3 4 5 8 9 9 9 10
Radial traverse 9.902 cm – lattice pitch
Figure 1. Benchmark model layout (60o sector, rotational symmetry)
DZ
20.0 Axial reflector
24.7 UAB UAB SCR UAB UAB UAB UAB
5.5 SHR SHR SHR
52.2 LEZ-1 LEZ-2 Follow er + rod
tail
LEZ-3 MEZ MOX HEZ
52.2 Follow er + rod tail LEZ-1 Follow er + rod tail LEZ-2 Follow er LEZ-3 Follow er + rod tail
MEZ MOX HEZ
SSA SSA Radial reflector
5.5
29.7 LAB LAB LAB LAB LAB LAB
20.0 Axial reflector
(cm) 5.2 36.8 1.8 5.8 1.6 18.9 2.25 10.38 13.5 9.48 9.48 25.43 50.0 DR
Figure 2. RZ calculational model indicating the axial position of control rods
93.8wt.% 239Pu content for feed fuel. In these specifications, it has been assumed that one fission
produces one fission product (FP), corresponding to the definition of FP cross-section in nuclear calculations. All fuel isotopes have been modeled at a uniform temperature of 1500 K and all structural and coolant isotopes are at a uniform temperature of 600K.
In the Phase 1 and 2 studies the effective multiplication factor (keff), and the integral value and/or its
spatial distribution of reactivity coefficients including kinetics parameters were calculated for the RZ and HEX-Z calculational models by diffusion and transport theory methods, using homogeneous representations of the material regions. Spatial distributions of reactivity coefficients were obtained by first order perturbation theory method. The core power distribution was normalized to the total power of 1470 MWth assuming energy is deposited at the point of fission with an energy of 200 MeV per
fission and 0 MeV per capture for all nuclides.
Phase 3 calculations were performed by diffusion and transport theory methods for the HEX-Z model only. For the burnup analysis a single stage calculation has been assumed with no recalculation of the
flux or resonance self-shielding for sub time steps. The burnup period is 140 effective full power days at an assumed 100% load factor. To evaluate the heterogeneity effect and the burnup effect, keff, fuel
Doppler coefficient and sodium density coefficient were mainly calculated at the beginning of cycle (BOC) and the end of cycle (EOC) for both homogeneous and heterogeneous core models. Detailed heterogeneous geometry configurations were used for the core fuel regions and the control rods in the heterogeneous core model [3]. The control rod worth at BOC and the reactivity loss with burnup were also evaluated.
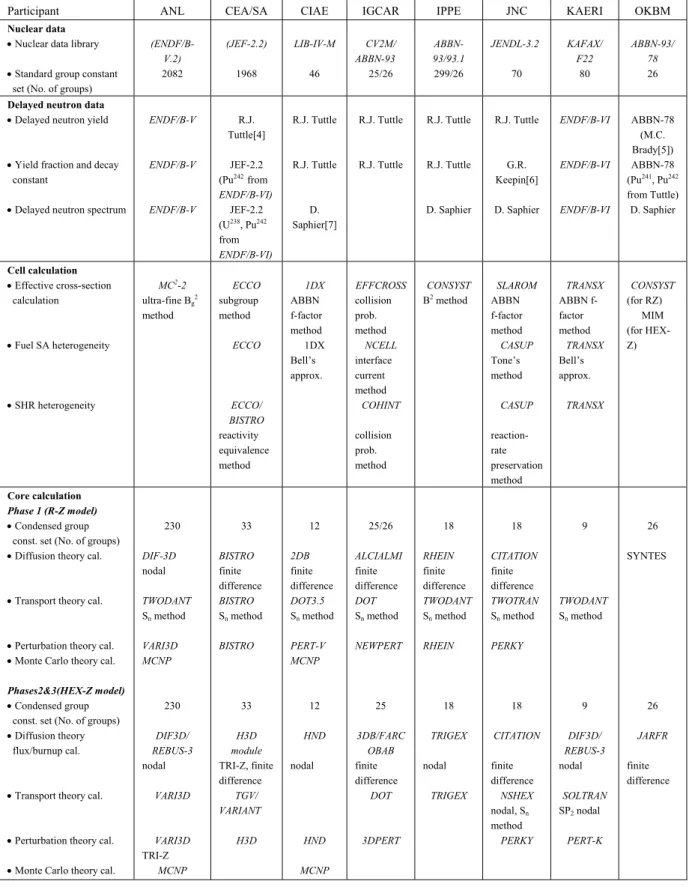
2.2.2 BASIC DATA AND COMPUTER CODES
Table I summarizes the basic data and computer codes used for the benchmark analyses by the participants, details of which are described in References [1-3]. The multi-group cross-sections were generated based on their own evaluated nuclear data library, using their own current state-of-the-art data processing system. Basically common delayed neutron data sets were used for the calculation of system kinetics parameters. The effective cross-sections condensed into broader energy group structure were generated using their own cell calculation code with various self-shielding treatments for homogeneous and heterogeneous cell models. The energy group number of condensed group constant sets ranges from 230 (fine) to 9 (coarse) with the upper energy boundary of ~ 10 MeV. Various specific heterogeneous cell modeling methods and specific code process schemes were employed for the treatment of the heterogeneity of control rods.
For HEX-Z diffusion theory calculations that are basic calculations in the benchmark analyses, mostly a finite difference method or a nodal diffusion approximation method were employed with the axial mesh size ranging from 2.6 cm to 5.0 cm for core and blanket regions. Most reactivity coefficients were determined using the diffusion theory based, first order perturbation theory method.
3. RESULTS AND DISCUSSIONS
3.1 HOMOGENEOUS BENCHMARKS
3.1.1 Reactivity coefficients and kinetics parameters
The reactivity coefficients for sodium density (WNa), fuel density (Wfuel), steel (structure) density
(Wsteel), absorber worth (Wabs), and Doppler effect were calculated using the first-order perturbation
theory. The density coefficients (material worths) for sodium, fuel and steel density coefficients are defined in terms of ∂k/k k'/∂ρ/ρ; this is the reactivity change per 1% reduction in material density specified in the benchmark definitions. The fuel and steel Doppler coefficients (KDfuel and KDsteel) were
calculated for temperature changes in the fuel (1500 K to 2100 K) and structure (600 K to 900 K) respectively for a flooded state. The radial and axial expansion coefficients (Rrad and Rax) were
calculated for a 1% uniform expansion of fuel, steel and absorber within the model in axial and radial directions. They were obtained by the keff differences using the expanded and un-expanded geometric
models. In these definitions, isotope masses are conserved except for sodium, which is kept at constant number density.
Integral reactivity coefficients obtained by the participants for the Phase 1 and 2 benchmarks are given in Tables II and III respectively, with the mean value and relative standard deviation of the results for each coefficient. The comparison of the diffusion and transport results for Phase 1 and 2 generally shows good agreement for most parameters between the RZ and HEX-Z models. The RZ
and HEX-Z diffusion theory calculations predicted the keff as 1.00270 and 1.00451 within 0.71%
standard deviation, respectively. For the Doppler effect, the structure Doppler was evaluated to be ~ 1/6 the magnitude of the fuel Doppler with standard deviations of 12 ~ 25%. These results are similar for Phases 1 and 2.
Table I. Basic nuclear data and computer codes used for benchmark analysis
Participant ANL CEA/SA CIAE IGCAR IPPE JNC KAERI OKBM
Nuclear data
• Nuclear data library • Standard group constant set (No. of groups)
(ENDF/B-V.2) 2082 (JEF-2.2) 1968 LIB-IV-M 46 CV2M/ ABBN-93 25/26 ABBN-93/93.1 299/26 JENDL-3.2 70 KAFAX/ F22 80 ABBN-93/ 78 26
Delayed neutron data
• Delayed neutron yield
• Yield fraction and decay constant
• Delayed neutron spectrum
ENDF/B-V ENDF/B-V ENDF/B-V R.J. Tuttle[4] JEF-2.2 (Pu242 from ENDF/B-VI) JEF-2.2 (U238, Pu242 from ENDF/B-VI) R.J. Tuttle R.J. Tuttle D. Saphier[7] R.J. Tuttle R.J. Tuttle R.J. Tuttle R.J. Tuttle D. Saphier R.J. Tuttle G.R. Keepin[6] D. Saphier ENDF/B-VI ENDF/B-VI ENDF/B-VI ABBN-78 (M.C. Brady[5]) ABBN-78 (Pu241, Pu242 from Tuttle) D. Saphier Cell calculation • Effective cross-section calculation • Fuel SA heterogeneity • SHR heterogeneity MC2-2 ultra-fine Bg2 method ECCO subgroup method ECCO ECCO/ BISTRO reactivity equivalence method 1DX ABBN f-factor method 1DX Bell’s approx. EFFCROSS collision prob. method NCELL interface current method COHINT collision prob. method CONSYST B2 method SLAROM ABBN f-factor method CASUP Tone’s method CASUP reaction-rate preservation method TRANSX ABBN f-factor method TRANSX Bell’s approx. TRANSX CONSYST (for RZ) MIM (for HEX-Z) Core calculation Phase 1 (R-Z model) • Condensed group const. set (No. of groups) • Diffusion theory cal.
• Transport theory cal.
• Perturbation theory cal. • Monte Carlo theory cal.
Phases2&3(HEX-Z model)
• Condensed group const. set (No. of groups) • Diffusion theory flux/burnup cal.
• Transport theory cal.
• Perturbation theory cal. • Monte Carlo theory cal.
230 DIF-3D nodal TWODANT Sn method VARI3D MCNP 230 DIF3D/ REBUS-3 nodal VARI3D VARI3D TRI-Z MCNP 33 BISTRO finite difference BISTRO Sn method BISTRO 33 H3D module TRI-Z, finite difference TGV/ VARIANT H3D 12 2DB finite difference DOT3.5 Sn method PERT-V MCNP 12 HND nodal HND MCNP 25/26 ALCIALMI finite difference DOT Sn method NEWPERT 25 3DB/FARC OBAB finite difference DOT 3DPERT 18 RHEIN finite difference TWODANT Sn method RHEIN 18 TRIGEX nodal TRIGEX 18 CITATION finite difference TWOTRAN Sn method PERKY 18 CITATION finite difference NSHEX nodal, Sn method PERKY 9 TWODANT Sn method 9 DIF3D/ REBUS-3 nodal SOLTRAN SP2 nodal PERT-K 26 SYNTES 26 JARFR finite difference
W R
Table II. Reactivity parameters (RZ model, Phase 1)
K W W
keff KDfuel Dsteel Na steel Wfuel abs ax Rrad
Participant
Diffusion. Transport Diffusion Transport Diffusion Transport Diffusion Transport Diffusion Transport Diffusion Transport Diffusion Transport Diffusion Transport Diffusion Transport
ANL 0.99684 1.00788 -0.00652 -0.00110 0.01749 -0.0384 0.3343 -0.0266 0.1327 0.4360 CEA/SA 1.01676 1.02298 -0.00679 -0.00671 -0.00134 -0.00146 0.00519 0.00343 -0.0112 -0.0147 0.3423 0.3382 -0.0273 -0.0263 0.1378 0.1374 0.4650 0.4573 CIAE 0.99808 1.01497 -0.00499 -0.00049 0.00211 -0.0055 0.3492 -0.0391 0.1432 0.1341 0.4232 0.4603 IGCAR 1.00360 -0.00462 0.00446 -0.0021 0.3410 -0.0269 0.1395 0.4840 IPPE 1.00140 1.00576 -0.00622 -0.00628 -0.00122 -0.00124 0.00898 0.00201 -0.0053 -0.0088 0.3505 0.3466 -0.0274 -0.0260 0.1297 0.1267 0.4868 0.4787 JNC 1.00423 1.00948 -0.00635 -0.00621 -0.00116 -0.00113 0.00765 0.00403 -0.0126 -0.0149 0.3491 0.3491 -0.0265 -0.0270 0.1393 0.1361 0.4812 0.4647 KAERI 1.02654 -0.00777 -0.00125 0.1376 0.4493 OKBM 0.99796 -0.00659 -0.00097 0.01065 -0.0114 0.3628 -0.0287 0.1415 0.4827 Mean 1.00270 1.01460 -0.00601 -0.00674 -0.00105 -0.00127 0.00808 0.00319 -0.0123 -0.0128 0.3470 0.3446 -0.0287 -0.0264 0.1377 0.1344 0.4656 0.4621 SD (±) (Rel. %) 0.00623 (0.62) 0.00777 (0.77) 0.00079 (13.1) 0.00062 (9.2) 0.00027 (25.7) 0.00012 (9.4) 0.00468 (57.9) 0.00080 (25.1) 0.0112 (91.1) 0.0028 (21.9) 0.0084 (2.4) 0.0047 (1.4) 0.0043 (15.0) 0.0004 (1.5) 0.0045 (3.3) 0.0040 (3.0) 0.0239 (5.1) 0.0097 (2.1)
Table III. Reactivity parameters (HEX-Z model, Phase 2)
keff KDfuel KDsteel W Na Wsteel Wfuel W abs Rax Rrad
Participant
Diffusion. Transport Diffusion Transport Diffusion Transport Diffusion Transport Diffusion Transport Diffusion Transport Diffusion Transport Diffusion Transport Diffusion Transport
ANL 0.99592 0.99802 -0.00665 -0.00106 0.02072 -0.0284 0.3339 -0.0241 0.1466 0.4427 CEA/SA 1.01546 1.02272 -0.00686 -0.00681 -0.00131 -0.00132 0.00771 0.00592 -0.0022 -0.0073 0.3435 0.3385 -0.0258 -0.0234 0.1463 0.1397 0.4741 0.4605 CIAE 1.00026 -0.00610 -0.00067 0.00486 -0.0037 0.3591 -0.0243 0.1600 0.5008 IGCAR 1.00642 -0.00471 0.00668 0.0107 0.3691 -0.0234 0.1461 0.4788 IPPE 1.00471 -0.00635 -0.00080 0.00877 0.0019 0.3477 -0.0217 0.1384 0.4904 JNC 1.00713 1.00967 -0.00646 -0.00633 -0.00109 -0.00109 0.01038 0.00664 -0.0020 -0.0066 0.3466 0.3457 -0.0200 -0.0219 0.1574 0.1530 0.4923 0.4814 KAERI 1.01260 1.01494 -0.00770 -0.00764 -0.00108 -0.00106 0.01050 0.0394 0.3490 -0.0267 0.1528 0.1514 0.4726 0.4679 OKBM 0.99357 -0.00632 -0.00106 0.01226 -0.0019 0.3561 -0.0245 0.1293 0.4941 Mean 1.00451 1.01134 -0.00639 -0.00693 -0.00101 -0.00116 0.01027 0.00628 -0.0017 -0.0069 0.3506 0.3421 -0.0238 -0.0227 0.1471 0.1480 0.4807 0.4699 SD (±) (Rel. %) 0.00714 (0.71) 0.00898 (0.89) 0.00078 (12.2) 0.00054 (7.8) 0.00019 (18.8) 0.00012 (10.3) 0.00453 (44.1) 0.00036 (5.7) 0.0176 (1354) 0.0004 (58.0) 0.0102 (2.9) 0.0036 (1.1) 0.0020 (8.4) 0.0008 (3.5) 0.0094 (6.4) 0.0059 (4.0) 0.0172 (3.6) 0.0087 (1.9)
The fuel density coefficient was estimated to be ~ 30 times larger than the steel density coefficient in the Phase 1 diffusion results. The fuel density coefficient was estimated even greater times larger for Phase 2. The reactivity coefficient distributions show that the fuel density coefficient is positive and the steel density is negative in the core zone, and that their signs are reversed in the blanket zone. The sodium density coefficients are 0.0081 and 0.0032 for the Phase 1 diffusion and transport theory results. The sodium density coefficients were evaluated to be larger for Phase 2. The absorber worth is ~ -0.028 and ~ -0.023 for Phases 1 and 2. The radial and axial expansion coefficients were evaluated to be ~ 0.14 and ~ 0.47 for Phases 1 and 2. The radial expansion coefficient is ~ 3 times larger than the axial expansion coefficient for a given relative change in dimension.
In the Phase 1 results, the sodium and steel density coefficients were obtained with standard deviations of 58% and 91% respectively in the diffusion theory results and also have a relatively large difference between the diffusion and transport theory results. These results are very similar for Phase 2. In particular, the steel density coefficient has a considerable dispersion. These results indicate that the transport theory method is more appropriate for the calculation of the sodium and steel density coefficients. In addition, the results for the steel density coefficient, even obtained by the transport theory method, show a considerable difference between the Phase 1 and 2 results. This is mainly attributed to differences in the spatial coefficient predictions for non-fuelled regions.
The effective delayed neutron fraction (βeff) and prompt neutron lifetime (lp) for system kinetics
parameters are given in Table IV. The results for Phases 1 and 2 show good agreement between the RZ and HEX-Z models and are very similar. The obtained effective delayed neutron fraction, βeff =
0.0059 is representative of a fast reactor system dominated by 235U fission (β = 0.0064), but with the
contribution from 239Pu (β = 0.0020).
Table IV. Kinetics parameters
RZ Model (Phase 1) HEX-Z Model (Phase 2)
Participant
βeff (pcm) lp (10-7 sec) βeff (pcm) lp (10-7 sec)
ANL 569 4.423 581 4.491 CEA/SA 597 (594)* 4.687 598 4.606 CIAE 604 4.277 598 4.239 IGCAR 598 4.618 598 IPPE 585 (583)* 4.586 593 JNC 586 4.620 587 4.484 KAERI 595 4.443 OKBM 578 4.618 573 4.130 Mean 588 4.514 590 4.399 SD (±) (Rel. %) (1.9) 11.2 0.134 (3.0) (1.5) 8.9 0.163 (3.7)
* Transport theory results
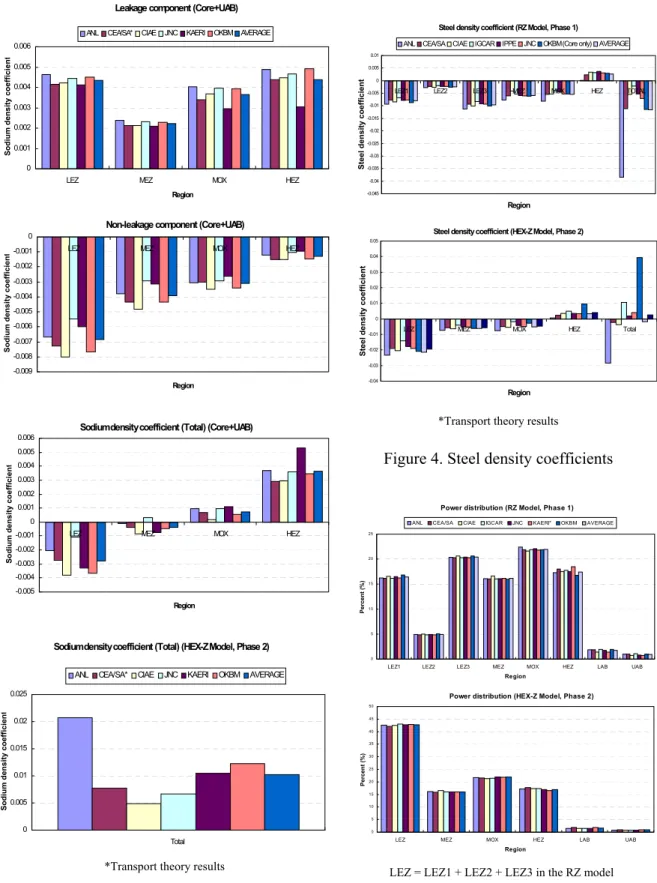
The regionwise sodium density coefficients for the core plus the upper axial blanket (UAB) regions obtained from the RZ and HEX-Z diffusion calculations are shown in Fig. 3, with the sum of the entire regions for comparison. The integral comparisons using only the core region plus the upper
axial blanket regions are given for a better gauge of comparison, since these regions will experience significantly higher temperatures in an accident situation. Furthermore, these regions are the locations where the largest cross-section differences would be expected. From the comparison of these figures, it can be inferred that large differences between the values obtained by the participants are due to the coefficients from the control regions and other non-fuelled regions. In these figures, the comparison of regional coefficients shows better agreement than the comparison of total coefficients summed over all regions, because the total value is a sum of very small positive and small negative contributions calculated from a 1% reduction in the material density. The resultant aspects are very similar for the steel density coefficients shown in Fig. 4.
The sodium density coefficient was investigated by separating its regionwise distributions for the leakage and non-leakage components. The regionwise leakage and non-leakage components for the core fuelled regions obtained from HEX-Z diffusion calculations are also shown in Fig. 3 with the averaged values. The comparison of the regionwise components shows similar aspects noticed for the sodium and steel density coefficients, particularly in the MEZ and MOX regions. In these figures, it is clearly observed that the leakage component becomes dominant in HEZ, and, as a result, HEZ has the greatest positive coefficient.
3.1.2 Power distributions
The core powers were calculated based on a local energy deposition model where energy is deposited at the point of fission with an energy of 200 MeV per fission and 0 MeV per capture for all nuclides. This local energy deposition model does not allow for gamma transport toward the outer regions of the core, and, as a result, the powers for non-fuelled regions are completely ignored.
Regionwise normalized power distributions calculated by the RZ and HEX-Z diffusion calculations are shown in Fig. 5 with their average values. The comparison of regionwise power distributions show good agreement for the RZ and HEX-Z models.
3.1.3. Influence of mesh size and energy group numbers
As previously mentioned, various planar and axial mesh sizes were used in the benchmark calculations, even though the axial mesh sizes were specified for desired result edit. In addition, some results were obtained using relatively low group numbered cross-sections in few group calculations. The value of a corresponding additional uncertainty strongly depends on the number of energy groups and the choice of the energy group boundaries. The OKBM participant devoted to investigate the possible uncertainties due to coarse mesh and few group calculations of the reactivity coefficients [8]. This parametric study was performed based on the Phase 2 results obtained using the finite difference option of the JARFR code in HEX-Z/triangular-Z diffusion approximations. In this study, few group calculations were performed for 26 to 9 energy groups with axial mesh sizes being varied from 2.61 cm to 10.0 cm for the core and from 2.5 cm to 5.0 cm for the axial blankets, respectively.
Among the examined parameters, the planar mesh size appeared to be most influential. The HEX-Z option has a coarse planar mesh configuration, i.e., one mesh point per hexagon, compared with six points per hexagon of the triangular-Z option. The results show that the use of the HEX-Z option having a larger planar mesh, results in the following additional uncertainties; overestimation of the fuel and steel Doppler coefficients by up to ~10 – 15% in the upper blanket, some shift of the sodium worth to positive by up to ~ 20% in LEZ, and significant underestimation of the absorber worth by 20%. The use of a larger axial mesh leads to some overestimation by 4 – 8% of all reactivity coefficients in axial blankets.
Leakage component (Core+UAB) 0 0.001 0.002 0.003 0.004 0.005 0.006
LEZ MEZ MOX HEZ
Region
S
odium density coefficien
t
ANL CEA/SA* CIAE JNC KAERI OKBM AVERAGE
Non-leakage component (Core+UAB)
-0.009 -0.008 -0.007 -0.006 -0.005 -0.004 -0.003 -0.002 -0.001 0
LEZ MEZ MOX HEZ
Region
S
o
dium density coefficien
t
Sodium density coefficient (Total) (Core+UAB)
-0.005 -0.004 -0.003 -0.002 -0.001 0 0.001 0.002 0.003 0.004 0.005 0.006
LEZ MEZ MOX HEZ
Region
S
o
dium density coefficien
t
Sodium density coefficient (Total) (HEX-Z Model, Phase 2)
0 0.005 0.01 0.015 0.02 0.025 Total S
odium density coefficien
t
ANL CEA/SA* CIAE JNC KAERI OKBM AVERAGE
Power distribution (RZ Model, Phase 1)
0 5 10 15 20 25
LEZ1 LEZ2 LEZ3 MEZ MOX HEZ LAB UAB
Region
Percen
t (%)
ANL CEA/SA CIAE IGCAR JNC KAERI* OKBM AVERAGE
Power distribution (HEX-Z Model, Phase 2)
0 5 10 15 20 25 30 35 40 45 50
LEZ MEZ MOX HEZ LAB UAB
Region
Percen
t (%)
Steel density coefficient (RZ Model, Phase 1)
-0.045 -0.04 -0.035 -0.03 -0.025 -0.02 -0.015 -0.01 -0.005 0 0.005 0.01
LEZ1 LEZ2 LEZ3 MEZ MOX HEZ TOTAL
Region Steel densi ty coeffi ci ent
ANL CEA/SA CIAE IGCAR IPPE JNC OKBM (Core only) AVERAGE
Steel density coefficient (HEX-Z Model, Phase 2)
-0.04 -0.03 -0.02 -0.01 0 0.01 0.02 0.03 0.04 0.05
LEZ MEZ MOX HEZ Total
Region Steel densi ty coeffi ci ent
*Transport theory results
Figure 4. Steel density coefficients
*Transport theory results
Figure 3. Sodium density coefficients
LEZ = LEZ1 + LEZ2 + LEZ3 in the RZ model Figure 5. Power distributions
It has also been revealed that the few group schemes, used by some participants, may result in significant uncertainties by up to -45% in the core and by up to -24% in the axial blankets for the sodium worth. The principle of the choice of the energy scale optimal division has been proposed for the few group calculations. Based on this principle, the optimal collapsing of the initial 26 groups into 9 groups has been provided. The sodium worth in the core (except for the MOX core), obtained from the 9 group calculation, agreed well with that obtained from 26 group calculation.
3.2 HETEROGENEOUS AND BURNUP BENCHMARKS
3.2.1 Burnup effect
To evaluate the burnup effect, keff, fuel Doppler coefficient and sodium density coefficient were
calculated at the beginning of cycle (BOC) with the SHR control rods mid-core insertion and the end of cycle (EOC) with the SHR rods fully withdrawn for the homogeneous core model. Burnup calculations were performed for 140 effective full power days at 1470 MWth in the equilibrium cycle
with SHR control rods mid-core insertion. The keff at EOC with the SHR rods mid-core position was
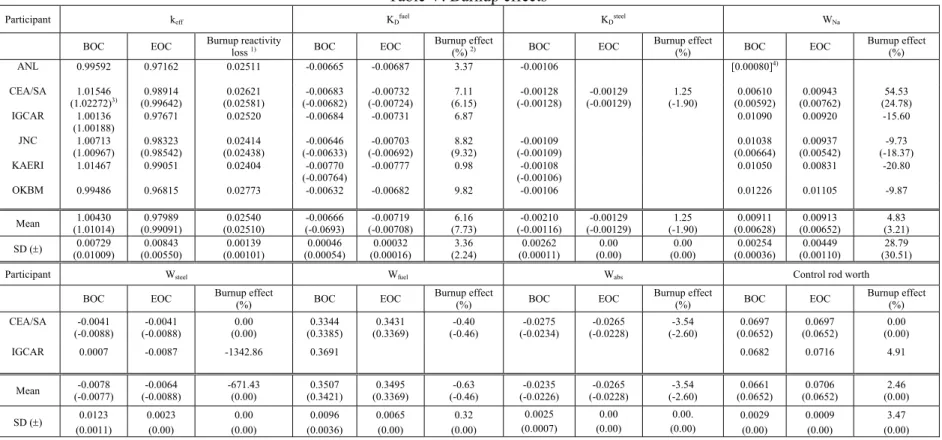
calculated to evaluate the reactivity loss with burnup. The control rod worth for the whole bank of rods were calculated for the homogeneous model, one with the SHR rods fully “withdrawn” and the other with the rods fully “inserted”. Core power calculations assumed a local energy deposition model using an energy 200 MeV per fission for fissionable isotopes and 0 MeV per capture for all nuclides. The reactivity parameters at BOC and EOC obtained by the homogeneous core model are given in Table V. Most burnup effects on the reactivity parameters show good agreement for diffusion and transport theory results. The reactivity loss with burnup in an equilibrium cycle was predicted to be 0.025 (4.3 $) both from the diffusion and transport theory results within 5.0% standard deviation. The fuel Doppler coefficient is more negative by ~ 6.0% and the absorber worth is less negative by ~ 3.0% at EOC, respectively. This is counterintuitive since the 238U content in the core is reduced at EOC. It is
conjectured that this change is caused by the power shift toward the LEZ zone. The burnup effects on the steel Doppler coefficient appeared to be negligibly small.
The sodium density coefficient obtained for the whole core becomes more positive at EOC by 53% at maximum. This is attributed to the build up of fission products leading to a harder spectrum, and is exacerbated by the power shift into the low leakage LEZ zone. However, in details, the sodium worth is observed to be less positive in most results. This conflicting result is surmised to come from the summation over its very small spatial contributions from non-fuelled regions, particularly at EOC, similar for Phases 1 and 2. The conflicting results cause a large standard deviation in the determination of the sodium worth. The steel density coefficient seems to have no difference in its value between BOC and EOC. The absorber worth becomes less negative by 3.5% at EOC. The control rod worth is more positive by 2.5% at EOC, and its burnup effect is small.
3.2.2 Heterogeneity effects
The keff, control rod worth and sodium density coefficient were calculated with the heterogeneous
treatment of the core fuel regions (LEZ, MEZ, HEZ, and MOX, and the core and axial blankets) and the SHR control rods in the heterogeneous core model. Several insignificant simplifications of real geometry description have been assumed in the heterogeneous geometry descriptions Fuel subassemblies for LEZ, MEZ, MOX, HEZ have the identical geometry, where 127 fuel pins are located with triangular pitch of 7.95 mm inside hexagonal wrapper. A separate geometry description was defined for the SHR absorber region [3].
K K Table V. Burnup effects
Participant keff Dfuel Dsteel WNa
BOC EOC Burnup reactivity loss 1) BOC EOC Burnup effect(%) 2) BOC EOC Burnup effect (%) BOC EOC Burnup effect (%)
ANL 0.99592 0.97162 0.02511 -0.00665 -0.00687 3.37 -0.00106 [0.00080]4) CEA/SA 1.01546 (1.02272)3) (0.99642) 0.98914 (0.02581) 0.02621 (-0.00682)-0.00683 (-0.00724) -0.00732 (6.15) 7.11 (-0.00128) -0.00128 (-0.00129) -0.00129 (-1.90) 1.25 (0.00592)0.00610 (0.00762) 0.00943 (24.78) 54.53 IGCAR 1.00136 (1.00188) 0.97671 0.02520 -0.00684 -0.00731 6.87 0.01090 0.00920 -15.60 JNC 1.00713 (1.00967) (0.98542) 0.98323 (0.02438) 0.02414 (-0.00633)-0.00646 (-0.00692) -0.00703 (9.32) 8.82 (-0.00109) -0.00109 (0.00664)0.01038 (0.00542) 0.00937 (-18.37) -9.73 KAERI 1.01467 0.99051 0.02404 -0.00770 (-0.00764) -0.00777 0.98 (-0.00106) -0.00108 0.01050 0.00831 -20.80 OKBM 0.99486 0.96815 0.02773 -0.00632 -0.00682 9.82 -0.00106 0.01226 0.01105 -9.87 Mean (1.01014) 1.00430 (0.99091) 0.97989 (0.02510) 0.02540 (-0.0693) -0.00666 (-0.00708) -0.00719 (7.73) 6.16 (-0.00116) -0.00210 (-0.00129) -0.00129 (-1.90) 1.25 (0.00628)0.00911 (0.00652) 0.00913 (3.21) 4.83 SD (±) (0.01009) 0.00729 (0.00550) 0.00843 (0.00101) 0.00139 (0.00054) 0.00046 (0.00016) 0.00032 (2.24) 3.36 (0.00011) 0.00262 (0.00) 0.00 (0.00) 0.00 (0.00036)0.00254 (0.00110) 0.00449 (30.51) 28.79
Participant Wsteel W fuel Wabs Control rod worth
BOC EOC Burnup effect (%) BOC EOC Burnup effect(%) BOC EOC Burnup effect (%) BOC EOC Burnup effect (%)
CEA/SA -0.0041 (-0.0088) (-0.0088) -0.0041 (0.00) 0.00 (0.3385) 0.3344 (0.3369) 0.3431 (-0.46) -0.40 (-0.0234) -0.0275 (-0.0228) -0.0265 (-2.60) -3.54 (0.0652) 0.0697 (0.0652) 0.0697 (0.00) 0.00 IGCAR 0.0007 -0.0087 -1342.86 0.3691 0.0682 0.0716 4.91 Mean (-0.0077) -0.0078 (-0.0088) -0.0064 -671.43 (0.00) (0.3421) 0.3507 (0.3369) 0.3495 (-0.46) -0.63 (-0.0226) -0.0235 (-0.0228) -0.0265 (-2.60) -3.54 (0.0652) 0.0661 (0.0652) 0.0706 (0.00) 2.46 SD (±) 0.0123 (0.0011) 0.0023 (0.00) 0.00 (0.00) 0.0096 (0.0036) 0.0065 (0.00) 0.32 (0.00) 0.0025 (0.0007) 0.00 (0.00) 0.00. (0.00) 0.0029 (0.00) 0.0009 (0.00) 3.47 (0.00) Notes: 1) Burnup reactivity loss = (keffBOC – keffEOC ) / keffBOC / keffEOC based on diffusion results, and transport results denoted by parenthesis.
2) Burnup effect = (BOC – EOC)/ BOC x 100 (%) based on diffusion results, and transport results denoted by parenthesis. 3) Values in parentheses denote transport results.
To evaluate the heterogeneity effect, the heterogeneous geometries of the SHR control rods have been treated by employing various specific heterogeneous modeling methods with specific procedures for reaction rate preservation [9-12]. The control rod worth for the whole bank of rods were calculated for the heterogeneous model, one with the SHR rods fully “withdrawn” and the other with the rods fully “inserted”.
The reactivity parameters calculated by the homogeneous and heterogeneous core models with the SHR rods mid-core insertion at BOC are given in Table VI. Most reactivity parameters and resultant heterogeneity effects show good agreement for diffusion and transport theory results. The heterogeneity effect on keff at BOC was evaluated to be the increase of 40 – 92 pcm and was
observed to be negligibly small. The obtained results appeared to differ depending on the heterogeneity treatment method and, as a result, it leads to a large standard deviation in the heterogeneity prediction. The fuel Doppler coefficient becomes less negative by ~ 6.0% with the heterogeneous treatment. The heterogeneity effect on the steel Doppler coefficient appeared to be negligibly small (based on the transport results). The heterogeneous treatment increases the sodium density coefficient by 53% at maximum. However, there remains a large standard deviation in the prediction between the obtained values.
The heterogeneity effect on the fuel, steel and absorber worth is negligibly small. The control rod worth becomes less positive by 2.3% (2.3% decrease in the control rod worth). From the comparison of the obtained values, it has been observed that the prediction of heterogeneity effect strongly depends on the heterogeneous modeling and the heterogeneity treatment methodology.
3.2.3 Influence of basic nuclear data
As part of the BN-600 hybrid core benchmark analysis effort, the JNC participant performed the sensitivity analysis of the difference between the JENDL-3.2 and JEF-2.2 libraries [13, 14]. Using the cross-section sensitivity coefficients, the nuclide-wise and reaction-wise contribution to the effect of the library change was analyzed for important reactivity parameters. From the sensitivity analysis, dominant nuclides and reactions were identified for those reactivity parameters. For example, the 235U
and iron cross-sections largely contribute to the keff difference between JEF and JENDL. The 235U
capture and iron elastic reactions are the largest components of the sodium density reactivity difference and the 235U capture and 238U capture reactions are main contributors to the burnup
reactivity loss difference.
Major findings observed from the results of the sensitivity analysis are given as follows: the criticality and sodium density reactivity are very sensitive to cross-section changes, and show strong non-linearity, which makes difficult for precise design work. The steel density reactivity also has large sensitivity coefficients, but the mechanism seems to be rather simple. The fuel and absorber density reactivities are simple and easy to predict.
3.3 ULOF TRANSIENT ANALYSES
The Russian participants, OKBM and IPPE, performed ULOF transient studies using the results prepared by the participants in Phases 1 and 2 [15, 16]. These transient analyses have been proposed to preliminary evaluate the effect of possible errors occurred in the reactivity coefficient calculations by comparing reactor dynamics behavior under several accident conditions. IPPE performed a simplified transient analysis up to onset of sodium boiling and OKBM carried out SAS4A transient analysis up to beyond sodium boiling with a more detailed reactor model.
K K
Participant keff Dfuel Dsteel WNa
Diffusion Transport Hete. effect(pcm)1) Diffusion Transport Hete. effect(%) 2) Diffusion Tranpsort Hete. effect(%) Diffusion Transport Hete. effect(%)
ANL (0.99592)3) (0.99802) (-0.00665) (-0.00106) [0.00080] 4) [(0.00800)] [0.12] CEA/SA 1.01474 (1.01546) (1.02272) 1.02211 (-61) -72 (-0.00683) -0.00734 (-0.00682) -0.00722 (5.93) 7.48 (-0.00128) -0.00128 (-0.00132) -0.00131 (-1.06) 0.55 (0.00610) 0.01062 (0.00592) 0.00984 (66.29) 73.99 CIAE 1.00214 (1.00026) 188 (-0.00610) -0.00640 4.77 (-0.00067) -0.00211 214.25 (0.00487) 0.00529 8.65 IGCAR 1.00188 (1.00136) 52 (-0.00684) (0.01090) 0.00838 -23.12 JNC 1.00913 (1.00713) (1.00967) 1.01109 (142) 200 (-0.00646) (-0.00633) (-0.00109) (-0.00109) (0.01038) 0.01280 (0.00664) 0.00934 (40.66) 23.31 KAERI (1.01260) (-0.00770) (-0.00764) (-0.00108) (-0.00106) (0.01050) 0.00858 -18.30 Mean 1.00697 1.01660 (40) 92 -0.00664 -0.00722 (5.93) 6.13 -0.00169 -0.00131 107.40 (-1.06) 0.00913 0.00959 (53.48) 12.91 SD (±) 0.00534 0.00551 (102) 111 0.00047 0.00 (0.00) 1.92 0.00041 0.00 151.11 (0.00) 0.00449 0.00025 (18.12) 39.14
Participant Wsteel W fuel Wabs Control rod worth
Diffusion Transport Hete. effect(%) Diffusion Transport Hete. effect(%) Diffusion Transport Hete. effect(%) Diffusion Transport Hete. effect(%)
ANL (-0.0037) (0.3339) (-0.0241) (0.0653) 0.0598 5) (0.0628)4) (-4.78) CEA/SA 0.0027 (-0.0041) (-0.0088) -0.0015 (-83.49) -165.44 (0.3444) 0.3431 (0.3385) 0.3369 (-0.46) -0.40 (-0.0275) -0.0265 (-0.0234) -0.0228 (-2.60) -3.54 (0.0697) 0.0683 (0.0652) 0.0641 (-1.69) -1.94 CIAE (-0.0037) (0.3591) 0.3560 -0.85 (-0.0243) (0.0662) 0.0664 0.33 IGCAR (0.0007) (0.0682) 0.0656 -3.77 JNC (-0.0020) (-0.0066) (0.3466) (0.3457) (-0.0200) (-0.0219) (0.0603) 0.0579 (0.0653) 0.0621 (-4.90) -3.98 Mean 0.0027 -0.0015 (-83.49) -165.44 0.3495 0.3369 (-0.16) -0.63 -0.0265 -0.0228 (0.06) 0.10 0.0646 0.0631 (-3.30) -2.34 SD (±) 0.00 0.00 (0.00) 0.00 0.0065 0.00 (0.00) 0.32 0.00 0.00 (0.00) 0.00 0.0040 0.0010 (2.27) 2.00
Notes: 1) Heterogeneity effect = (Hete. – Homo.) x 105 (pcm) based on diffusion results, and transport results denoted by parenthesis
2) Heterogeneity effect = (Hete. – Homo.)/ Homo. x 100 (%) based on diffusion results, and transport results denoted by parenthesis 3) Values in parentheses denote homogeneous results at BOC.
4) Values in brackets denote only for the core and upper axial blanket regions. 5) Monte Carlo results.
The simplified transient analysis employs point kinetics approximation without taking into account phase transitions of core materials and sodium boiling. The simplified ULOF (G = 30% G0) transient
analysis shows that flow of ULOF is characterized by the reactivity balance mainly due to the fuel Doppler effect and radial expansion in the hybrid BN-600 core. No principal differences in the ULOF flow were found in cases of using the Phase 2 diffusion results of different participants, especially for reactivity coefficients due to thermal expansion of materials. For the hybrid BN-600 core the influence of reactivity due to sodium density change on the accident process appeared to be negligible. The SAS4A transient analysis used a simplified channel model for the BN-600 reactor hybrid core. Total eight input data sets were prepared for SAS4A code calculations using the reactivity coefficients and power distributions obtained by the diffusion approximation, taking into account the energy release at the point of neutron capture in the Phase 2 study. The results of the inter-comparison of the ULOF transient analyses show that the existing spread in the reactivity coefficients is insignificant from the viewpoint of consequent spread in the basic integrated parameters of the initial ULOF accident stage. The spread in reactivity coefficients correlates with the spread (up to the sign reverse for the sodium density component) of the values of corresponding full current reactivity components. However, after the onset of sodium boiling, the spread in the reactivity coefficient distributions of the Doppler effect and the sodium worth in associated with the power distributions causes a significant divergence in the characteristics of the accident progress. Variations of the reactivity components obtained based on the OKBM data are illustrated in Figs. 6 and 7. The sodium density component shows the most significant relative spread among the components of the current reactivity balance. Up to the onset of sodium boiling, this large spread causes the current reactivity ranging from -66% to 59%. At the sodium boiling stage, the impact of a large uncertainty in the sodium worth becomes much more substantial. A significant contribution of the components from core radial deformation and the large uncertainty of its value have been noticed.
It is noteworthy that the results of the inter-comparison of the ULOF transient analyses using the reactivity coefficients and power distributions of the different participants show good agreement up to the onset of sodium boiling in spite of a substantial spread noticed for several reactivity coefficients. This is due to compensating effects between several reactivity effects and the specific design of the hybrid core mainly loaded with UOX fuel. On the other hand, beyond sodium boiling there exist significant differences in the transient behaviours resulting mainly from differences in Doppler, sodium void and power distributions.
CONCLUSIONS
Benchmark analyses for the UOX/MOX hybrid BN-600 reactor that contains three uranium enrichment zones and one plutonium zone in the core, have been performed within the frame for the IAEA sponsored Co-ordinated Research Project. In these benchmark analyses, results for several important reactivity coefficients obtained by the participants with their own state-of-the art methodologies, were compared in terms of calculational uncertainties. In addition, the latter’s effects on the ULOF transient behaviour of the hybrid BN-600 core were evaluated.
The comparison of the diffusion and transport results for Phase 1 and 2 obtained for the homogeneous representation generally show good agreement for most parameters between the RZ and HEX-Z models. The results for the sodium and steel density coefficients show large discrepancies both in the diffusion approximation, and between the diffusion and transport theory approximations. Large differences in these integral reactivity coefficients result from summation over very small contributions from the control rod regions and other non-fuelled regions. The separate treatment of the leakage and non-leakage components of the sodium density coefficient clearly indicates a similar aspect. In the Phase 3 study, the burnup effect and the heterogeneity effect on most reactivity parameters show good agreement for diffusion and transport theory results. The burnup reactivity loss was predicted to be 0.025 (4.3 $) within ~ 5% standard deviation. The heterogeneity effect on most reactivity parameters was evaluated to be small. The control rod worth decreases by 2.3% with the heterogeneous treatment. It has been observed that the heterogeneity effect on keff and control rod
worth differs strongly depending on the heterogeneity treatment method.
In the ULOF transient analyses, the substantial spread between the different participants noticed for several reactivity coefficients and power distributions did not have a significant impact on the transient behavior prediction, especially up to the onset of sodium boiling. This result is attributable to compensating effects between several reactivity effects in the specific design of the hybrid core mainly loaded with UOX fuel. This gives confidence that the outcome of this type of transient could be understood in the partially MOX fuelled hybrid core type.
The benchmark analyses will be extended to the study of a BN-600 fully fuelled MOX core design with sodium plenum above the core, and the transient analyses in the fully fuelled MOX core. It remains of significant interest to the participants to seek experimental verification of the reactivity coefficient distributions and integral coefficients through the analysis of experimental measurements.
REFERENCES
1. IAEA, “Working Material: Updated Codes and Methods to Reduce the Calculational Uncertainties of the LMFR Reactivity Effects, The first Research Co-ordination Meeting,” Vienna, 24-26 November 1999, IAEA-RC-803, IWG-FR/100 (2000).
2. IAEA, “Working Material: Updated Codes and Methods to Reduce the Calculational
Uncertainties of the LMFR Reactivity Effects, The second Research Co-ordination Meeting,” Vienna, 24-26 November 2000, IAEA-RC-803.2, IWG-FR/103 (2001).
3. IAEA, “Working Material: Updated Codes and Methods to Reduce the Calculational Uncertainties of the LMFR Reactivity Effects, The third Research Co-ordination Meeting,” Cadarache, 12-16 November 2001, IAEA-RC-803.3, TWG-FR/106 (2002).
4. R. J. Tuttle, “Delayed-Neutron Data for Reactor-Physics Analysis,” Nucl. Sci. and Eng., 56, pp.37-71 (1975).
5. M. C. Brady and T. R. England, “Delayed Neutron Data Group Parameters for 43 Fissioning Systems,” Nucl. Sci. and Eng., 103, pp.129-149 (1989).
6. G. R. Keepin, Physics of Nuclear Kinetic (1965).
7. D. Saphier, et al., “Evaluated Delayed Neutron Spectra and Their Importance in Reactor Calculation,” Nucl. Sci. and Eng., 62, pp.660-694 (1977).
8. M. Farakshin and B. Vasilyev, “The influence of an energy groups number and mesh size on results of reactivity coefficients calculations for BN-600 benchmark core,” Working Material:
The third Research Co-ordination Meeting (CRP),” CE/Cadarache, France, 12-16 Nov. 2001,
IAEA-RC-803.3, TWG-FR/106, pp.122-137 (2002).
9. P. Mohanakrishnan and R. Narayanan, “BN-600 hybrid core benchmark Phase III results,” ibid, pp. 273-277 (2002).
10. G. Rimpault, T. D. Newton and P. J. Smith, “European contribution to Phase 3 of the benchmark analysis for the BN-600 hybrid core,” ibid, pp.316-339 (2002).
11. M. Ishikawa, “JNC results of BN-600 benchmark calculation (Phase 3), ibid, pp. 355-357 (2002). 12. Z. H. Li, “Heterogeneous Calculation of BN-600 Benchmark Core,” ibid, pp. 290-309 (2002). 13. M. Ishikawa, “Sensitivity analysis of the difference between JENDL and JEF libraries,” Working
Material: The second Research Co-ordination Meeting (CRP),”Vienna, 20-24 Nov. 2001,
IAEA-RC-803.2, TWG-FR/103, pp.116-132 (2001).
14. M. Ishikawa, “Sensitivity Analysis of JEF and JENDL (Action 3.6)” (May 2002). 15. A. Danilytchev, D. Elistratov and V. Stogov, “Simplified approach to dynamic process
modeling,” Working Material: The third Research Co-ordination Meeting (CRP), CE/Cadarache, France, 12-16 Nov. 2001, IAEA-RC-803.3, TWG-FR/106, pp.237-256 (2002).
16. S. Belov, M. Farakshin and S. Voronov, “Results of comparative dynamics calculations of BN-600 hybrid core benchmark on the basis of different input data on reactivity coefficients,” ibid, pp. 150-173 (2002).