HAL Id: hal-01633480
https://hal.archives-ouvertes.fr/hal-01633480
Submitted on 16 Jan 2019
HAL is a multi-disciplinary open access
archive for the deposit and dissemination of
sci-entific research documents, whether they are
pub-lished or not. The documents may come from
teaching and research institutions in France or
abroad, or from public or private research centers.
L’archive ouverte pluridisciplinaire HAL, est
destinée au dépôt et à la diffusion de documents
scientifiques de niveau recherche, publiés ou non,
émanant des établissements d’enseignement et de
recherche français ou étrangers, des laboratoires
publics ou privés.
B. Lacroix, C. Genevois, J. Doualan, G. Brasse, A. Braud, P. Ruterana, P.
Camy, E. Talbot, R. Moncorgé, J. Margerie
To cite this version:
B. Lacroix, C. Genevois, J. Doualan, G. Brasse, A. Braud, et al.. Direct imaging of rare-earth ion
clusters in Yb : CaF 2. Physical Review B: Condensed Matter and Materials Physics (1998-2015),
American Physical Society, 2014, 90 (12), pp.125124. �10.1103/PhysRevB.90.125124�. �hal-01633480�
Direct imaging of rare-earth ion clusters in Yb:CaF
2B. Lacroix,1C. Genevois,2J. L. Doualan,1G. Brasse,1A. Braud,1P. Ruterana,1P. Camy,1E. Talbot,2
R. Moncorg´e,1and J. Margerie1
1Centre de Recherche sur les Ions, les Mat´eriaux et la Photonique (CIMAP), UMR 6252 CEA-CNRS-ENSICAEN,
Universit´e de Caen, 14050 Caen, France
2Groupe de Physique des Mat´eriaux (GPM), UMR 6634 CNRS, Universit´e et INSA de Rouen, 76801 Saint-Etienne-du-Rouvray, France
(Received 23 April 2014; revised manuscript received 26 August 2014; published 15 September 2014) The existence and the identification of only one or several coparticipating luminescent Yb3+ centers in
the heavily doped Yb:CaF2 laser crystals which are considered in the development of several high intensity
laser chains have been examined first by using two complementary and original experimental approaches, i.e., registration of low temperature site-selective laser excitation spectra related to near-infrared and visible cooperative emission processes, on the one hand, and direct imaging at the atomic scale of isolated ions and clusters using a high-resolution scanning transmission electron microscope in the high angle annular dark-field mode, on the other hand, and then correlating the data with simple crystal field calculations. As a consequence, and although all the experimental details could not be accounted for quantitatively, a good overall correlation was found between the experimental and the theoretical data. The results show that at the investigated dopant concentrations, Yb:CaF2should be considered as a multisite system whose luminescent and lasing properties are
dominated by a series of Yb3+clusters ranging from dimers to tetramers. Hexameric luminescent centers may be
dominant at really high dopant concentrations (likely above 20 at. %), as was originally proposed, but certainly not at the intermediate dopant concentrations which are considered for the laser application, i.e., between about 0.5 and 10 at. %.
DOI:10.1103/PhysRevB.90.125124 PACS number(s): 78.55.−m, 61.72.Ff, 42.70.Hj I. INTRODUCTION
Recent results obtained in the field of ultrahigh-peak power and short pulse solid state lasers with high repetition rates show that ytterbium-doped calcium fluoride single crystals (Yb3+:CaF2) tend to become among the most attractive laser
media for this type of application, supplanting well-known materials such as Yb3+:YAG or Yb3+:KYW. Yb3+:CaF2
exhibits many original properties [1,2]: a broad emission band extending over 100 nm, which is used for wavelength tunability and the generation of ultrashort laser pulses, a long emission lifetime of about 2.3 ms, which is favorable for energy storage and the production of very high peak powers, a good thermal conductivity, comparable to YAG, which is appreciated in the management of the diode-pump-induced thermal loads, a high laser damage threshold, and last, but not least, the possibility of growing large and extremely good quality single crystals by conventional crystal growth techniques such as the Bridgman technique, or thick crystalline layers (for thin disks and waveguides) by using the liquid phase epitaxy technique. As a matter of fact, since the first demonstration of laser wavelength tunability and femtosecond laser operation obtained in 2004 [1,3,4], the potentialities of Yb3+:CaF2have
been continuously unveiled with spectacular results such as a record short pulse duration of 48 fs [5], multiterawatt [6], and multijoule [7] peak powers. It was also demonstrated that such crystals could be operated at cryogenic temperatures [8] with an ultralow quantum defect (quantum shift between pump and laser emission wavelengths) which paves the way to the development of extremely high peak power laser systems.
In parallel, many efforts were devoted to the spectroscopic properties of this laser material as a function of the excitation wavelength, sample temperature, and dopant concentration, in order to identify the nature and the energy level structure of
the luminescent center(s) at the origin of its particular laser emission properties [9–12]. In particular, a number of results obtained with samples doped with various amounts of Yb3+
from tenths to tens of atomic percent, show that the lumines-cence properties change from isolated Yb3+centers consisting
of single ions sitting in positions of different symmetries to Yb3+ion clusters with more and more complicated structures.
This starts, according to a number of theoretical studies based on extended x-ray-absorption fine structure and neutron scattering experiments mostly performed in the 1980s [13,14], from Yb3+-Yb3+near-neighbor ion pairs up to hexamers, i.e.,
aggregates of six near-neighbor Yb3+ions. Unfortunately, up
to now, there has yet been neither direct observation of these clusters, nor unambiguous experimental results allowing one to confirm these theoretical atomic arrangements. Therefore, doubts still remain, especially at dopant concentrations around and exceeding about 0.5 at. %, i.e., at dopant levels of interest for the laser application (hereafter called “laser dopant levels”), on the real nature of the laser active luminescent centers in this apparently simple CaF2 crystalline material. It means that,
at such dopant concentrations, despite deep theoretical and spectroscopic analyses, no real evidence has been provided as to the existence of one or several coparticipating luminescent centers, or as to their complete energy level structures, which is a real problem for the optimization of the laser properties of this important laser material.
The purpose of the present work has been precisely to gain a better insight into these questions using two complementary experimental techniques and correlating the data with a simple theoretical approach.
The first experimental method consists in a refined site-selective laser excitation study, performed at very low temper-ature, of the so-called cooperative luminescence of the Yb3+
only when the active ions are very close to each other. The other technique is a structural analysis based on high angle annular dark-field scanning transmission electron microscopy (STEM-HAADF). The first experimental approach reveals at intermediate dopant levels the existence of at least two kinds of clusters leading to efficient cooperative luminescence, and the second approach allows, in Yb3+-doped single crystals,
direct imaging of isolated Yb3+ ions as well as Yb3+ ionic
clusters. The data obtained from both approaches are fairly well correlated using simple crystal field calculations.
II. SITE-SELECTIVE LASER EXCITATION SPECTROSCOPY AND COOPERATIVE LUMINESCENCE
In Yb3+-doped CaF2, the trivalent Yb3+ active ions enter
the crystal lattice in substitution of the Ca2+ cations and the
charge excess is compensated by interstitial F−anions, leading
to several kinds of atomic arrangements and luminescent centers. At low Yb3+concentrations (<0.1 at. %), the dopants
mainly form isolated centers, which can present tetragonal or trigonal local site symmetries, when the charge compensating F− anion is located near the rare-earth dopant, or a simple cubic symmetry when no charge compensation is located in the immediate vicinity. At higher dopant concentrations, i.e., over about 0.5 at. % and less than 8–10 at. %, Yb3+ions aggregate
and form clusters which progressively dominate over all the previous substitutional sites. However, the exact symmetry of these arrangements is still not yet firmly established. Indeed, according to the early literature mentioned above [14], the ions would tend to form cubo-octahedral hexameric clusters in which six Yb3+ ions site in square antiprisms of nearly
tetragonal site symmetry. In fact, these conclusions appear relatively disputable since there is no direct evidence of these arrangements and no recent studies based on more accurate and up-to-date experimental techniques.
In order to identify Yb3+ ion arrangements, an original
experimental approach is used here which aims at characteriz-ing the Yb3+ clusters by correlating the visible cooperative
emission processes induced by at least two nearby Yb3+
ions, whose principle is described in Fig.1, and the photo-luminescence excitation spectra of the associated visible and near-infrared emissions recorded at low temperature (15 K). The detection of a cooperative emission indeed implies that Yb3+ ions, with very similar energy level schemes, and thus
very similar environments, aggregate to form pairs or more complex clusters within which the ions “communicate” by transferring their energy to each other. Therefore, recording a cooperative emission signal following a particular laser excitation can be a very selective way to investigate and probe the presence of Yb3+clusters in the material.
For that purpose, the choice was made to investigate crystals with intermediate concentrations of 0.115%Yb3+, 0.2%Yb3+,
and 0.8%Yb3+ions, with a particular emphasis on the former
so that both isolated Yb3+ ions and Yb3+ clusters coexist
and can be more easily observed and discriminated. Indeed, samples containing 2%–5%Yb3+ions, as is the case for laser
crystals, exhibit rather broad absorption and emission bands and this broadening does not allow a clear discrimination between the spectroscopic signatures corresponding to the different species.
FIG. 1. (Color online) Nonlinear cooperative luminescence pro-cess in which two nearby excited Yb3+ions couple to each other to
emit one short-wavelength photon per each two excited ions from a virtual emitting state located at twice their excitation energy.
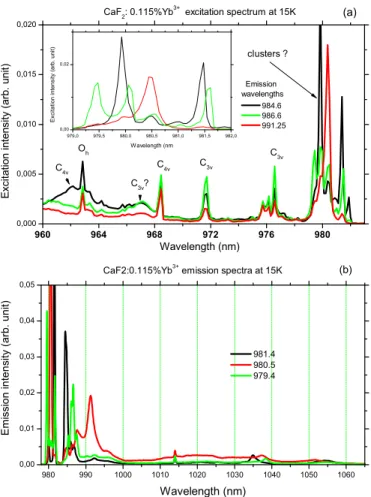
Figure2(a)presents first the low temperature (T ≈ 15 K) near-infrared photoluminescence excitation spectra (PLE) obtained for monitored emissions centered at 984.6, 986.6,
FIG. 2. (Color online) Photoluminescence excitation and emis-sion spectra obtained by monitoring near-infrared emisemis-sions peaking at 984.6, 986.6, and 991.25 nm and by exciting the samples at 981.4, 980.5, and 979.4 nm.
and 991.25 nm, with these wavelengths [see Fig. 2(b)] corresponding to the second most noticeable emission peaks observed on the short-wavelength side of the overall emission band and which will be confirmed in Sec. IV as (5)→(2) emission lines [9,10,15]. Here and in the remainder of the text, we call (1), (2), . . . , (7) the Yb3+ sublevels in order of
increasing energies. Thus (1) is the ground sublevel, (1)↔(5) is the resonance “zero line” which is present both in the absorption and emission spectra, and (5)→(2), (5)→(3), and (5)→(4) are the other emission lines.
The PLE peaks marked C4v, C3v, and Oh in Fig. 2
correspond respectively to absorptions by tetragonal, trigonal, and cubic Yb3+ sites. The strongest excitation lines [see
the inset of Fig. 2(a)] are observed in the spectral range (979–982 nm), and they are zero line, i.e., lines associated with the optical transition between the lowest Stark levels of each ground and excited Yb3+multiplet4F
7/2and4F5/2 (see
Fig.1), respectively. Previous investigations tend to indicate that these excitation lines are correlated to Yb3+clusters [10].
According to these selective excitation data, three different excitation spectra clearly appear by monitoring the emissions at 984.6, 986.6, and 991.25 nm. Therefore, it indicates the existence of at least three different Yb3+environments, which
will be called site A (only one excitation line at 980.5 nm for λem= 991.3 nm), site B (two excitation lines at 981.45 and
979.9 nm for λem= 984.6 nm), and site C (three excitation
bands at 981.6, 980.1, and 979.45 nm for λem= 986.6 nm),
respectively.
Based on these results, we decided, by using a continuous-wave tunable Ti:sapphire laser, to excite the sample at each of the excitation lines previously highlighted (979.4, 980.5, and 981.4 nm) and to register the corresponding cooperative emissions, if any. The interesting result of this experiment is that cooperative emission only occurred when the excitation wavelength was tuned around 980.5 nm. It means that only for the species called A, the Yb3+ ions are close enough,
i.e., within a cluster, to allow cooperative emission between them. Moreover, the fact that a cooperative process takes place indicates that such interacting Yb3+ ions have very
similar local environments and energy level schemes. The other excitation peaks which are observed around 979.9 and 981.45 nm and which do not give rise to any cooperative emission correspond either to isolated Yb3+ ions or Yb3+
clusters made of Yb3+ ions sitting in different environments
and characterized by different energy levels.
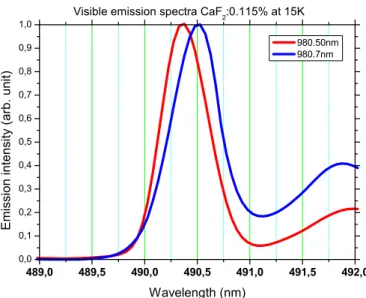
To deepen this analysis, the sample was then excited at various excitation wavelengths across the 980.5 nm excitation band. Doing so, as shown in Fig. 3 by exciting at 980.5 and 980.7 nm more specifically, essentially two types of cooperative emission spectra with peaks at 490.3 and 490.6 nm could be observed and thus be associated with two types of Yb3+ clusters, hereafter called A1 and A2, made of Yb3+
ions with similar environments. It is worth noting here that similar results were obtained with the samples containing 0.2%Yb3+ and 0.8%Yb3+. PLE spectra were then recorded
by monitoring each of the emissions centered at 490.3 and at 490.6 nm and by scanning the excitation wavelength between about 979 and 982 nm. The resulting PLE spectra are displayed in Fig. 4. According to these spectra, lines (“zero” lines) clearly appear at half the frequencies (doubled
FIG. 3. (Color online) Visible cooperative emission spectra reg-istered around 490 nm (half the wavelength of the main near-infrared emission peak around 980 nm) after excitation at 980.5 and 980.7 nm.
wavelengths) of the visible emission peaks at about 980.5 and 980.65 nm, the same excitation wavelengths (considering the experimental uncertainty of about 0.3 nm) used above to show the cooperative emission features reported in Fig. 3. These cooperative visible emission excitation spectra can be confronted in turn with the excitation spectra reported in the inset of Fig. 2 and obtained in the same near-infrared wavelength domain by monitoring near-infrared emissions at particular emission wavelengths. A clear correlation exists between the near-infrared excitation peaks occurring around 979.85 and 980.65 nm and found in both types of PLE spectra.
Finally, this low temperature site-selective spectroscopic investigation clearly indicates the coexistence of two types of
FIG. 4. (Color online) Photoluminescence excitation spectra reg-istered around 980 nm by monitoring visible cooperative emissions peaking around 490.3 nm (a) and 490.6 nm (b). Also reported, the absorption spectrum registered in the same spectral range (c) and the sum of the two previous excitation spectra (d).
Yb3+ clusters (A1 and A2) made of Yb3+ ions having very
similar energy level schemes and enabling visible cooperative emissions. However, at this step of the investigation, the existence of the other species which appear in the spectra by the presence of other excitation lines probably associated with different energy level schemes and which do not give rise to any cooperative emission, cannot be assigned yet to any well-defined Yb3+environments. Therefore, to go further into
the understanding of the characteristics of the luminescent species in Yb:CaF2, additional structural information at the
atomic scale is necessary, and this is discussed in the next section following our investigations using an atomic resolution STEM-HAADF.
III. STEM-HAADF
As discussed above, the spectroscopy of the Yb3+:CaF2
system suggests that rare-earth ions are not randomly dis-tributed in the fluorite crystal host and are instead arranged in clusters. However, even if the presence of clusters is generally admitted, there is little knowledge of their true nature, and their existence has not yet been clearly proven by direct observations. Therefore, imaging optical dopants and their organization within the fluorite structure is of prime importance for a better understanding of their luminescent properties.
To this end, use was made of the high-resolution STEM-HAADF technique (see the Appendix for a more detailed description of the sample preparation and data analysis). This technique has been proved to be very powerful to probe composition fluctuations at the atomic scale, like, for example, in multilayer structures [16,17]. To a first approximation, the HAADF intensity scales as Z1.7−2.0 meaning that the signal
is enhanced with the increase of the atomic number, and such images are known to exhibit Z contrast [18]. Therefore, to identify rare-earth atoms in an HAADF image one needs to locate the positions of the most intense atomic columns. By evaluating the corresponding intensities and determining the geometrical arrangement with respect to the rest of the CaF2lattice, it becomes possible to point out the presence of
rare-earth ion clusters. However, in contrast to other studies performed on systems with large Zdopant/Zhost ratios (>5)
[19], the detection of single dopant atoms with a lower Z ratio (ZYb/ZCa= 3.5) may not always be straightforward.
As noticed in the Appendix of this work, a key parameter to detect individual Yb atoms within the CaF2 matrix lies
also in the sample preparation where thin specimen areas of homogeneous thickness are needed. In our case, this has been achieved using the tripod polishing method (see Appendix). During growth of alloys, introducing more than 1% of heavy atoms in a matrix is always a challenge and may go along with the formation of numerous crystallographic defects [20,21], such as stacking faults [22,23], twins [24], inversion domains [25], dislocations [26], and even phase separation or ordering [27,28]. However, as can be seen in Fig. 5 which shows a Z-contrast high-resolution image of the 5%Yb:CaF2-doped
sample [Fig. 5(b)], no defects can be seen in the area, and this was the same for all the investigated samples which means that even with such high doping levels, the large number of Yb3+ ions do not strongly disturb the crystalline
FIG. 5. (Color online) STEM-HAADF images (10 nm × 10 nm) acquired along a ⟨001⟩ zone axis (a) for the pure CaF2and (b) for
the 5%Yb:CaF2 sample. The white rectangles bordered by arrows
indicate the areas where intensity profiles have been recorded. (c) Comparison of intensity profiles recorded along ⟨100⟩ directions and averaged on 0.3 nm of width for the pure and for the doped CaF2.
The arrows show local increase of intensity along some Ca columns (for more clarity, the profiles have been shifted vertically).
order of the CaF2 matrix. An interesting comparison can be
made when looking at Fig. 5(a) which corresponds to an undoped CaF2 sample imaged using the same conditions,
along a same ⟨001⟩ zone axis. In both images, only the Ca atomic columns are highlighted as bright dots, which is due to the Z difference between Ca (ZCa= 20) and F (ZF= 9).
In the pure CaF2, the contrast of the [001] Ca columns is
homogeneous, as can also be seen in the intensity profile recorded along a ⟨100⟩ direction, whereas for the doped sample, various atomic columns appear much brighter than the surrounding ones [Fig.5(c)]. As can be seen on these profiles, the average intensity difference between the maximum level and the background level is roughly the same as for the pure CaF2 (the difference between the maximum and the
minimum averaged intensity is approximately 8 × 10³); this
is a good indication that the local thickness of the samples (of the order of 10–20 nm) is highly uniform. Moreover, as the profiles underline nicely, a significant intensity increase of approximately 4 × 10³in one isolated atomic column or in a
group of adjacent columns can be seen [see arrows on profiles (1) and (2)]. Therefore, such local intensity variations can be attributed to the presence of one or more Yb atoms along the corresponding ⟨001⟩ columns.
From these observations, is it possible to know whether these Yb atoms are randomly distributed in the crystal or if they are organized in the form of clusters? Unfortunately, the answer is not straightforward, because the HAADF signal on the images is complex as it contains many components (matrix
FIG. 6. SVD analysis applied on Fig.5(b). (a) Experimental HAADF image of the Yb-doped 5%Yb:CaF2 viewed along [001], after
smoothing to reduce noise. (b) Lattice contribution of image (a) from SVD (1–8), also smoothed. (c) Dopants contribution of image (a) from SVD (9–480), also smoothed.
atomic columns, dopants, and noise). Moreover, even with taking the precaution to work in an area of uniform thicknesses (see Appendix), local small specimen thickness fluctuations may lead to changes in the lattice column intensity, which will overlap with the high contrast of possible rare-earth cluster regions. Therefore, for a sound determination of the possible Yb organization in the crystal, image processing and analysis are required. In this case, the image components were first separated using singular-value decomposition (SVD), follow-ing the procedure proposed by Voyles et al. [29,30] which has already been used to reveal individual atoms in doped silicon (see Appendix). In practice, the SVD is applied on the original image [Fig.6(a)]. The image reconstruction with the largest singular values reflects the Ca lattice [Fig.6(b)], as it contains most of the variance. The image reconstruction with the next modes [Fig. 6(c)] is the most interesting because it shows bright features which underline regions containing dopants. In the doped sample, these bright areas (not observed in the pure sample) are nonhomogeneously distributed on the image and have a small extension (<1 nm), which is a good indication of Yb clustering in the host crystal.
To go further in the quantification of the HAADF signal, the intensity was evaluated along each atomic column of the image (see Appendix). Figure 7shows mean intensity maps calculated from the original images (shown in Fig.5) of pure and doped fluorite. The pure sample only exhibits progressive
FIG. 7. (Color online) Intensity maps calculated from the HAADF images shown in Fig.5, (a) for the pure CaF2 and (b) for
the 5%Yb:CaF2samples. The colored disks reflect the mean intensity
integrated along the ⟨001⟩ Ca column detected on the image (intensity values are expressed in × 104counts).
intensity variations at large scale (several nanometers) due to specimen thickness gradient [Fig. 7(a)], and the column-to-column intensity ratio does not exceed 1.07. For the doped sample [Fig. 7(b)], a significant increase of the column-to-column brightness is clearly present at the scale of the unit cell (around 0.5 nm), and the column-to-column intensity ratio can locally reach values around 1.20.
The combination of the SVD analysis with the column intensity evaluation gives additional information about the repartition, the size, and the possible geometries of the Yb clusters in CaF2. On the SVD image reconstruction using
the 9–480 modes, the positions of the most intense columns (mean intensity above 4.92 × 10⁴) have been represented by
red circles in Fig. 8(a). On such images, it is possible to identify various isolated regions containing one, two, or three adjacent columns having higher intensities than the mean intensity level of all the surrounding columns. These regions are distributed in the whole image which confirms the Yb3+
clustering effect in CaF2which obviously cannot be confused
with the thickness gradient. It is worth pointing out that the large majority fits remarkably well with the bright areas on the SVD reconstruction, although a number of bright features may not, which is due to random local thickness fluctuations.
FIG. 8. (Color online) (a) Image reconstruction of 5%Yb:CaF2
using SVD (9–480) coupled with the mean intensity evaluation (image size is 10 nm × 10 nm). The small red circles indicate the positions of the brighter atomic columns (mean intensities >4.92 × 10⁴ counts). The most frequently observed patterns are surrounded by a white line. (b) Low-pass filtered and interpolated HAADF images showing the typical patterns identified in Fig.8(a). All the images (1.2 nm × 1.2 nm size) are displayed in nonlinear intensity scale.
In Fig. 8(a), four frequently observed organizations of Yb atoms at the scale of the unit cell are easily identified; some of these typical patterns have been surrounded in white. The corresponding HAADF images shown after image processing (low-pass filtering and interpolation), displayed in Fig. 8(b)
using a nonlinear intensity scale, show the ⟨001⟩ intensity projections of possible Yb3+clusters in CaF2. The first pattern
labeled (1) corresponds to one single isolated intense column. Pattern (2) consists of two consecutive Ca columns along a ⟨100⟩ axis of CaF2. In pattern (3), three columns form an “L”
shape (along two ⟨100⟩ directions). Finally, in pattern (4), three consecutive columns are aligned along a ⟨100⟩ direction.
Assuming a simple coherent model based on Ref. [31], the visibility of a ⟨001⟩ Ca column containing N atoms and n Yb atoms can be roughly estimated using the expression V(n) = [NZCa+ n(ZYb− ZCa)]2/(NZCa)2. The evolution of
V(n) versus the thickness (not shown here) evidences a strong increase of the visibility of Ca columns containing Yb for thicknesses t below 30 nm [for example, we found V(1) = 1.10 for t = 30 nm and V (1) = 1.30 for t = 10 nm). Experimentally, we evaluated the specimen thickness for the 5%Yb:CaF2 sample using electron energy-loss spectroscopy
with the logarithmic-ratio method. From the mean free path of the electrons in CaF2(λ = 85 nm) calculated with the electron
energy-loss spectroscopy tools in DIGITALMICROGRAPH, the
thickness crossed by the electrons in the first 150 nm from the specimen border does not exceed 20 nm. It is worth mentioning that all the HAADF images of the paper fulfill this criterion since they were recorded in the thinnest areas, very close to the hole of the specimens. To go further in order to determine the real organization of individual Yb3+clusters with limited
overlapping, the next Z-contrast results will be presented for less doped samples.
To gain more insight on the cluster geometries, the Z-contrast images were compared with atomic models which describe the theoretical stability of a variety of defect clustering containing trivalent ions in different fluorites, including the Yb:CaF2 system [13,14]. To classify the different types of
defect aggregates, the cluster notation i|v|p|qrst was used.
Here, i is the number of trivalent impurity ions (Yb3+)
substituting the host-lattice divalent cations (Ca2+), v is the
number of anion vacancies, p is the number of relaxed lattice ions, q is the number of anion interstitials (F−) in the
nearest-neighbor sites (r = 1), and s is the number of anion interstitials (F−) in the next-nearest-neighbor sites (t = 2). In
the Yb:CaF2system, several clusters are energetically stable.
The calculations predict a domination of the 1|0|0|11monomer
with respect to the 1|0|0|12 monomer. The reaction of two
1|0|0|11leads to the formation of the 2|0|2|21 dimer. Larger
clusters such as the 3|0|1|31trimer, the 4|1|2|41and 4|0|8|41
tetramers, or the 6|0|8|51 hexamer can be formed by the
reaction of two or more dimers together or with one monomer. In order to compare with experiments, these theoretical models were generated in a 5 × 5 × 5 CaF2supercell and projected
along all the ⟨001⟩ directions.
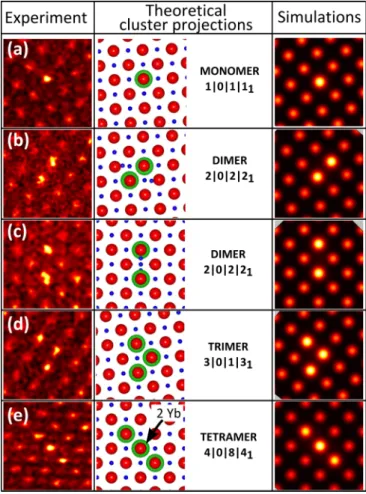
As can be seen in Fig.9, five Yb3+ arrangements
corre-sponding to four types of clusters along ⟨001⟩ appear. The first one (a) consists of an isolated intense column containing one Yb3+ and may correspond to a 1|0|0|1
1 monomer. The
next two arrangements labeled (b) and (c), consisting of two
FIG. 9. (Color online) Comparison of experimental STEM-HAADF images obtained for the 0.8%Yb:CaF2 sample (left) with
theoretical clusters model (middle) and image simulations (right) projected along ⟨001⟩ directions. Experimental images, displayed in nonlinear intensity scale, have been low-pass filtered to reduce noise and interpolated to add pixels. The experimental image dimensions are 1.17 × 1.17 nm2. On projections, the green and larger circles
correspond to Yb in substitution on a Ca site, the blue and smaller circles represent F, and the red circles correspond to Ca. In some cluster projections, two Yb can be projected along the same column (see indication). On the experimental and simulated images, the intensity increases from black to yellow.
intense columns aligned either along a ⟨100⟩ or a ⟨110⟩ direction, match very well with a 2|0|2|21 dimer. The fourth
configuration (d) contains three intense columns along two perpendicular ⟨100⟩ directions forming an “L” shape, in good agreement with the 3|0|1|31 trimer. Finally, the (e)
configuration corresponds to three intense columns aligned along a ⟨100⟩ direction, which corresponds to the 4|0|8|41
tetramer. It is important to note that the direct interpretation which is used throughout our analysis of the STEM data does not take into account the electron channeling, especially as the strain around the dopants should be present. To determine the influence of this effect on our HAADF images, we can either simulate the probe propagation in the sample or tilt the specimen away from the zone axis as has been proposed by Couillard et al. [32]. In this work, we focused on multislice simulations in order to analyze the propagation over the depth of the electron probe in our experimental conditions. The
results obtained have confirmed that the channeling effect is negligible for our experimental conditions (see Supplemental Material for more details about the channeling effect [33]).
In order to strengthen this analysis and prove the real observation of Yb typical clusters from the high-resolution STEM-HAADF experiments, image simulations have also been carried out. The frozen phonon multislice calculations were performed using theQSTEMprogram [34], through our
ex-perimental conditions (convergence semiangle = 22.5 mrads; detector inner and outer angles of 50 and 180 mrads, respectively; acceleration voltage of 200 kV; probe size of 0.08 nm). The probe was focused along ⟨001⟩ at the surface of 3 × 3 × 21 CaF2supercells (total thickness of about 11.5 nm)
that contain the cluster structures in the middle. As shown in Fig. 9, the simulations are in good agreement with the experimental images and the cluster models. In particular, they describe well the increase of signal observed in the central column of the tetramer view along ⟨001⟩ that corresponds to the projection of two Yb atoms, thus confirming the presence of such Yb clusters in our CaF2crystals.
Finally it is worth mentioning that in addition to the ⟨001⟩ crystallographic orientation, some high-resolution STEM ob-servations were also made along the ⟨110⟩ orientations (not shown in the paper). In that case, in a similar way to that for the ⟨001⟩ orientations, it was also possible to observe different groups of Ca columns with significantly higher intensity than the rest of the matrix: These results go in the same direction as the results for the ⟨100⟩ observations.
The experimental visibilities were also determined from the mean intensity evaluation on the original images by calculating the ratio of its maximum intensity with respect to the intensity of a pure neighbor Ca column as reference. They confirm that all the intense columns in each image have similar intensities in (b), (c), and (d), which confirms the expected clusters. In Fig. 9(e), the intensity of the column in the middle is approximately twice the intensity in the two other columns, which indicates that the number of Yb3+ in the middle is
twice the number of Yb3+ in the two others, in agreement
TABLE I. Experimental visibilities of the ⟨001⟩ Ca columns containing Yb extracted from the different HAADF images shown in Fig.9, and their possible [number of Yb atoms n; specimen thickness t]combination deduced from the equation V (n) = [NZCa+ n(ZYb−
ZCa)]2/(NZCa)2. The most probable combinations (with respect to the
investigated thickness range) are shown in bold.
Possible [n; t (nm)] Image Experimental visibilities V combination
(a) V = 1.34 [1;9], [2;17] (b) V1 = 1.28 [1;11], [2;21] V2 = 1.38 [1;8], [2;16] (c) V1 = 1.18 [1;16], [2;31] V2 = 1.13 [1;21], [2;43] (d) V1 = 1.21 [1;13], [2;27] V2 = 1.17 [1;17], [2;34] V3 = 1.25 [1;12], [2;24] (e) V1 = 1.12 [1;23], [2;46] V2 = 1.13 [1;21], [2;43] V3 = 1.23 [1;12], [2;24]
with the [100] projection of the 4|0|8|41 cluster. Table I
summarizes the experimental visibilities V measured in the different images of Fig. 9, and also presents for each of them different possible combinations of [number of dopant; specimen thickness] determined from the relation V (n) = [NZCa + n(ZYb − ZCa)]2/(NZCa)2. The latter confirm that
the intense Ca column in images (a)–(d) may contain only one single dopant, whereas in image (e) the middle column contains two dopants and its neighbors only have one single dopant, in good agreement with the expected cluster models. It is worth mentioning that the existence of other types of rare-earth clusters in CaF2is not excluded, but their projections
along ⟨001⟩ were not clearly observed in the analyses we did on various images.
IV. CRYSTAL FIELD CALCULATIONS A. Crystal field parameters estimation
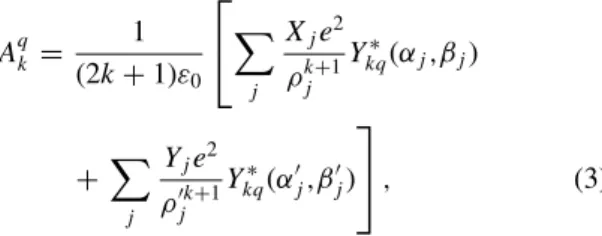
Our computation of absorption and emission spectra of Yb3+in various aggregates rests on a scheme previously used
by Doualan et al. [35]. The crystal field potential Vcacting on
the 4f13Yb3+ion of interest is written as
Vc= −
!
k,q
AqkrkYkq(θ,ϕ), (1)
where (r,θ,ϕ) are the spherical coordinates of the hole in the 4f electronic shell with origin O at the ytterbium nucleus, Ykqis a spherical harmonic, the A
q
k’s are coefficients, and the
initial minus sign appears because one deals here with a single hole and not with a single electron. For a 4fnion, the only
relevant values of k are 2, 4, and 6. As usual, we rewrite Eq. (1) in terms of new parameters, the Bq
k’s, which are defined from
the Aq k’s by Bkq = " (2k + 1) 4π ⟨r k ⟩Aqk, (2) where ⟨rk
⟩ is the average value of rk on the Yb3+ 4f radial
wave function. Each ligand ion j is described by a pair of two elastically bound point charges, the “core” and the “shell,” with respective electrical charges Xj and Yj as listed in Table II of
Ref. [36]. Letting (ρj,αj,βj) and (ρj′,α′j,βj′) be, respectively,
the spherical coordinates of the core and the shell of the jth ligand ion with the same origin O as above,1 the so-called
spherical harmonics addition theorem leads to
Aqk = 1 (2k + 1)ε0 ⎡ ⎣! j Xje2 ρjk+1Y ∗ kq(αj,βj) +! j Yje2 ρj′k+1Y ∗ kq(αj′,βj′) ⎤ ⎦ , (3)
where e is the elementary charge and ε0 the vacuum
permit-tivity.
1There are no significant differences in the results obtained with O
taken either at the core or at the shell of the Yb3+ion. All numerical
It is well known that formula (3), even with the present refinement of splitting each ligand ion between a core and a shell, is much too naive to yield a valuable estimate of the Aqk’s themselves. However, it may be useful to estimate the ratios between Aq
k’s with the same k and different q’s (see,
for instance, Refs. [37] and [35]). Thus, instead of using in Eq. (2) the real average value of rkon 4f wave functions, we
consider the three ⟨rk⟩’s (k = 2, 4, or 6) as empirical adjustable
parameters which we postulate to be the same for every kind of ytterbium center in CaF2. We determine these empirical ⟨rk⟩’s,
along with the spin-orbit parameter ζ , by comparing calculated and experimental spectra in two well-known cases, those of the cubic and the tetragonal CaF2:Yb3+monomers [10]. Like
in [35], we limit the j summations in Eq. (3) to the ncF−
ions of the first coordination shell around the Yb3+ ion of
interest, since these anions provide the greatest contribution to the crystal field.2Depending on the particular defect under
study, ncis equal to 8, 9, or 10.
B. Lattice relaxation
In order to get the (ρj,αj,βj)’s and the (ρj′,α′j,βj′)’s
of Eq. (3), we must know how the fluorite lattice relaxes in the vicinity of the defect made up of one or several substitutional Yb3+cation(s) and of one or several interstitial
F− anion(s). For this purpose, the crystal is divided into two regions. Region 1 is a sphere with center * and radius R1= 14.39 ˚A, containing N1ions, with N1≈ 930, the exact
value depending both on the choice of * within the crystal unit cell and on the number of interstitial F− ions in the
particular cluster of interest. This cluster is located close to *. As suggested in Sec. IV A, each ion of region 1 is described by a core and a shell, both independently mobile, which makes a total of 6 × N1coordinates to adjust. Region 2
is formed of N2nonpolarizable “ions” (N2≈ 11 500), fixed at
the regular fluorite lattice positions and situated between two concentric spheres of radii R1 and R2, with R2 = 33.34 ˚A.
More precisely, the outer part of region 2 is composed of whole crystalline unit cells, the centers of which lie at a distance of *smaller than or equal to R2. Since some Ca2+ and/or F−
ions lie on cell boundaries, some of the N2“ions” of region 2
are really only fractions of ions, with suitably reduced electric charges. This sophistication is necessary to avoid spurious Coulomb effects in the calculation.
Interactions between ions are described by Eqs. (5)–(8) of Ref. [36], with parameters given in its Table II. Let E be the total energy of the N1 ions of region 1, including
both the mutual interactions of two ions in this region and the interactions of one ion of region 1 and one of region 2. A computer program minimizes E with respect to the
2It is possible to extend the j summations to all the (N
1+N2) ions
of regions 1 and 2 (defined in Sec. IVB). One thus gets results similar to those obtained with the restricted summations, provided the extension is made consistently both for the determination of parameters ζ and ⟨rk⟩ and for the calculation of optical spectra of
the various defects under study. However, the results obtained with the restricted j summations are significantly closer to experimental results. Therefore, they are the only ones to be reported below.
TABLE II. Fit of calculated and observed spectra, in order to determine parameters ⟨rk⟩ and ζ (in lines 1, 3, 4, and 6, energies are
in cm−1units). Cubic Observed [10] 0 649 649 10384 10849 10849 center Weight 0 1 1 0 1 1 1 Calculated 0 661 661 681 10381 10840 10840 Tetragonal Observed [10] 0 456 520 588 10332 10410 10766 center Weight 0 0 1 1 1 1 1 Calculated 0 217 495 593 10312 10431 10773
6 × N1coordinates of region 1 ions, thus yielding their relaxed
position for the defect under study.
This lattice relaxation calculation was performed for a number of Yb3+ defects which we designate again according
to the i|v|p|qrst notation of [14], where i is the number
of trivalent impurity ions (Yb3+) substituting the host-lattice
divalent cations (Ca2+), v is the number of anion vacancies,
p is the number of relaxed lattice ions, q is the number of anion interstitials (F−) in the nearest-neighbor sites (r =
1), and s is the number of anion interstitials (F−) in the
next-nearest-neighbor sites (t = 2):
(1) the cubic Yb3+monomer, 1|0|0|0 (effective charge +1),
Ohsite symmetry;
(2) the tetragonal Yb3+ monomer, 1|0|0|11 (effective
charge 0), C4vsite symmetry;
(3) the 1|0|0|12 monomer (effective charge 0), C3v site
symmetry;
(4) the 1|0|0|21 monomer, i.e., 1|21 (l), Fig. 4(a) of
Ref. [13] (effective charge −1)3, C
4v site symmetry;
(5) the 1|0|1|21 monomer, i.e., 1|21 (L), Fig. 4(b) of
Ref. [13] (effective charge −1)3, C
3v site symmetry, as will
appear in Sec.IVC 2;
(6) the 2|0|1|21dimer (effective charge 0)4;
(7) the 2|0|1|31dimer (effective charge −1)3;
(8) a less compact dimer, which we shall call 2|0|1|21(lc),
where the two Yb3+ ions are distant by a (the CaF 2 lattice
constant), instead of a/√2 in 2|0|1|21(effective charge 0);
(9) the 3|0|1|31trimer (effective charge 0);
(10) the 3|0|1|41trimer (effective charge −1)3;
3The reason to consider these charged centers, along with the neutral
ones, is double: (a) Some of them have been calculated [13,14] to be very stable and (b) cubic Yb3+ centers (with effective charge
+1) are experimentally observed (through their optical spectrum) to be present up to high Yb3+ concentrations, so that some negatively
charged defects are required to ensure electric neutrality of the whole sample.
4The 2|2
1 center, introduced by [13], is called 2|0|2|21 by [14],
in agreement with the relaxation of two regular lattice F− ions
toward interstitial positions shown by Fig.2(a)of [13]. However, our calculations do not confirm the stability of such a defect: One of the (2+2 = ) 4 interstitial F−ions of this Fig. 2(a)migrates back
toward one of the anion vacancies and the relaxed center remains with only one anion vacancy; it should therefore be called 2|0|1|21, which
FIG. 10. (Color online) A few projections of clusters along ⟨001⟩ directions (• = Ca2+, • = Yb3+, • = F−).
(11) a less compact trimer, which we shall call 3|0|1|31
(lc), where the Yb3+ions are distant by a and a√2, instead of
a/√2 and a in 3|0|1|31(effective charge 0); and
(12) a few Yb3+ tetramers which we shall not discuss in
the present paper.
In most cases Yb3+-Yb3+ distances after relaxation are
calculated to be shorter than the corresponding Ca2+-Ca2+
distances in the unperturbed fluorite lattice. Thus, the attractive power of three anions which belong to the close neighborhoods of two Yb3+’s overcompensates the increased Coulomb
repulsion between these triply charged cations. Displacements of Yb3+during relaxation are rather small (a few tenths of ˚A),
so that they are not detectable by HAADF-STEM experiments. Therefore, one can state that Figs.9(b)and9(c)are compatible with 2|0|1|21or 2|0|1|31dimers viewed along different ⟨001⟩
directions. Similarly, 3|0|1|31 and 3|0|1|41 are expected to
appear as Fig.9(d), when viewed along any of the three ⟨001⟩ directions of the crystal. On the other hand, 2|0|1|21 (lc),
3|0|1|31(lc), and the tetramers are not fully supported by Fig.9
which lacks the pattern expected in at least one of the ⟨001⟩ directions. Figure9(a)may be 2|0|1|21 (lc) in one direction,
but the two other views are lacking; they should appear as in Fig.10(f). 3|0|1|31 (lc) should appear as Fig.9(b)in one
direction, Fig.9(e)in another one, but the third projection is missing: It should look the same as Fig.10(g). Figure9(e)may be the projection of the square tetramer in two directions, but again the third expected figure, namely, Fig.10(h), is absent. The relaxed 2|0|1|21dimer is calculated to have an energy E
lower by 0.08 eV than 2|0|1|21 (lc) (which is constituted of
the same number of ions of each kind). Similarly the relaxed 3|0|1|31trimer center is calculated to have an energy lower by
0.27 eV than 3|0|1|31 (lc). Thus, in each of these cases, the
center which is unambiguously observed is also the one with the lowest energy, i.e., the one which is expected to be the more stable.
Contrarily to cations, F− ions may be much displaced
by lattice relaxation [13,14]. We initially place the extra F−
ions in interstitial positions close to the Yb3+ ions. There
is some uncertainty concerning which place(s) to choose, and this choice is by no means innocent, since the computer program does not determine the absolute minimum of energy E, but only a local minimum which may depend on fluorine ions starting positions. Therefore, with a given “skeleton” of Yb3+’s, we have to make several trials for the initial positions
of extra fluorine ions and to select the one which leads to the lowest final energy E. Of course, there remains the possibility that none of our choices was a good one and that we have missed the genuine energy minimum.
A priori2|0|1|21should be highly symmetrical (D2h), but
it is found to be only Cs after relaxation, the two Yb3+ ions
becoming nonequivalent, one with a neighborhood of ten and the other of only nine fluorine ions. This unexpected result is obtained as well with a symmetrical or with an asymmetrical starting position of the extra F− ions. On the
other hand, the (electrically negative) relaxed 2|0|1|31is found
to have an overall C2v symmetry and its two Yb3+ ions are
wholly equivalent, since their neighborhoods correspond to one another by a plane reflection.
A completely different behavior is predicted for the trimers: The relaxed 3|0|1|31 has C3v symmetry, with the three Yb3+
ions perfectly equivalent to one another. But in the relaxed 3|0|1|41, the symmetry reduces to Cs: Yb3+ ions Nos. 1 and
2, each with a totally asymmetrical neighborhood (C1), are
symmetrical with respect to one another in the Cs overall
symmetry of the defect and are therefore totally equivalent, while Yb3+ No. 3 has a different neighborhood (of Cs
symmetry).
C. Spectra calculation and discussion 1. Values of parameters ζ and ⟨rk⟩
From the geometry of cubic and tetragonal centers deter-mined in Sec.IVB, we calculated their Aq
k’s by formula (3) and
then the best values of ζ and of the ⟨rk⟩’s by a fit of calculated
energies [using Eq. (2)] to observed ones. The latter (taken from Table II of [10]5) are listed in lines 1 and 4 of our TableII.
Lines 2 and 5 indicate the weights we have used for these data in our fitting procedure. Of course the weight is zero for the ground sublevels which are fixed at 0 cm−1both in calculated
and observed spectra. The symmetry of the fourth sublevel of the cubic center is +6, while the lowest 2F5/2 sublevel is
a +7. But +7→ +6 transition is forbidden, and, indeed, it is
still a debated point whether the cubic center fourth sublevel has been experimentally observed or not. Therefore it is not included in our fitting procedure, i.e., its weight is 0. As for the tetragonal second sublevel, it is located at 456 cm−1by Petit et al.[10], because of a weak emission line (bF3on their Figs.3
and4). But the same authors calculate this tetragonal second sublevel at 229 cm−1, which is not so far from the experimental
164 cm−1reported by Baker and Blake [38]. Because of this
uncertainty, we choose a weight of 0 for this level. Let us finally point out that, for the cubic center, both components of each +8sublevel (649 and 10 849 cm−1) are given a weight of
1, so that each +8quartet has a twice bigger influence on the
fitting procedure than an “ordinary” Kramers doublet. The above-described procedure yields ζ = 2905.8 cm−1,
⟨r2⟩ = 0.1162 ˚A2, ⟨r4⟩ = 0.2693 ˚A4, and ⟨r6⟩ = 0.8268 ˚A6.
The quadratic deviation σ for the fit is σ = 18 cm−1, defined
as σ = ' ( l ) Elcalc− Eobsl *2 (nl− 4) , (4)
where the summation is over the nl= 10 sublevels with weight
1. El
calcand Eobsl are the calculated and observed energies of
5A misprint of this reference has been corrected: 10 332 and not
TABLE III. Spectra of ytterbium monomers (the first five lines are calculation results for different arrangements; the last line is the observed spectrum of the so-called trigonal center [10].
Resonance line Absorption lines Emission lines
Defect (1)↔(5) (nm) (1)→(6); (7) (nm) (5)→(2); (3); (4) (nm) Cubic center 963.2 922.5; 922.5 1028.7; 1028.7; 1030.9 Tetragonal center 969.7 958.7; 928.3 990.5; 1018.6; 1028.9 1|0|0|12 962.3 919.8; 917.6 1029.5; 1031.1; 1038.0 1|0|0|21 969.1 957.9; 925.2 991.1; 1017.8; 1034.0 1|0|1|21 977.0 970.2; 950.3 984.3; 999.0; 1018.0
Expt.: trigonal center 976.1 971.2; 966.6 980.1; 984.1; 986.4
level l. The 4 in the denominator is the number of adjustable parameters.
2. Spectra of monomers
From the geometry of various aggregates obtained in Sec. IV B, we calculate the Aq
k’s by formula (3), then the
Bkq’s by formula (2) using the above values of the ⟨rk⟩’s, and
finally the theoretical energy levels using these Bq
k’s and the
above value of ζ . The results are listed in TablesIIIandIV
below (in terms of absorption and emission wavelengths, rather than of level energies). In these tables and in all the following text, as already mentioned in Sec.II, we call (1), (2), . . . , (7) the Yb3+ sublevels in order of increasing energies. Table III
is devoted to monomers, and more especially to the problem of the so-called “trigonal” center, which was experimentally observed by a number of authors, in particular by V. Petit
et al.[10]. A comparison of lines 1 and 3 of TableIIIshows that 1|0|0|12is just a weakly perturbed cubic center, quite unable
to explain the observed trigonal spectrum (TableIII, last line). Similarly, a comparison of lines 2 and 4 shows that 1|0|0|21
is a weakly perturbed tetragonal center, unable to account for the trigonal spectrum. Lattice relaxation turns the symmetrical Fig. 4(a) of [13] into an unsymmetrical one, where one of the interstitial fluorine ions comes closer to the Yb3+, like in the
tetragonal center, while the other one is somewhat repelled. On the other hand, a completely new spectrum is pre-dicted for 1|0|1|21. After relaxation, the rather unsymmetrical
Fig. 4(b) of [13] yields a defect with perfect C3v symmetry:
One of the eight regular fluorine ions which surround the Yb3+
relaxes to an interstitial position, so as to form with the two
other interstitial F−ions an equilateral triangle. The Yb3+ion
is now inside a “cage” of ten F−, which may be described as
a deformed cube in which one apex is occupied by the above referred triangle. Energy E is smaller by 1.02 eV for 1|0|1|21
than for 1|0|0|21 which contains the same number of ions of
each kind;6 therefore, 1|0|1|2
1 is expected to be more easily
formed. A comparison of lines 5 and 6 of TableIIIshows that 1|0|1|21is indeed a good candidate for being the trigonal center
(and it has C3vsymmetry): The resonance line is calculated at
0.9 nm from the observed position, and the second absorption line at −1.0 nm. Thus the two conspicuous excitation lines marked “C3v” in Fig. 2 are nicely explained. The third one
marked “C3v?” is far from its predicted position (950.3 nm),
but we suspect an identification error in [10]: Indeed, it seems queer, for any Yb3+center in CaF2, that the crystal field should
be weak enough to make the overall splitting of2F
5/2so small
as 101 cm−1. The third excitation line of the trigonal center
should be sought at a shorter wavelength, out of the frame of Fig.2, on the left. For emission, the comparison between lines 5 and 6 of TableIIIis not so satisfactory as for excitation: The predicted (5)→(2) line is at 4.2 nm from the observed intense line dF3of Fig. 5 of [10], close to the much weaker dF2line.
But, here again, one cannot fully believe the interpretation given in [10] because of an incredibly small overall 2F
7/2
splitting of 107 cm−1.
6This is in semiquantitative agreement with Table IV of [13] which
gives a 0.60 eV energy difference between these defects.
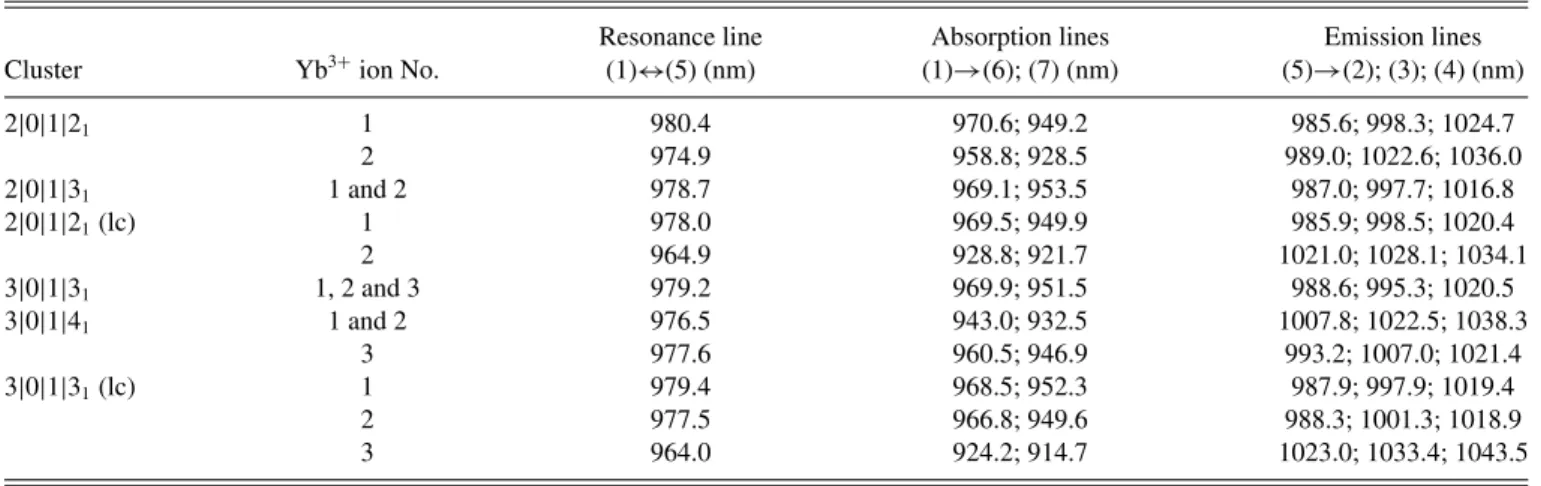
TABLE IV. Calculated spectra for some small ytterbium-fluorine clusters.
Resonance line Absorption lines Emission lines Cluster Yb3+ion No. (1)↔(5) (nm) (1)→(6); (7) (nm) (5)→(2); (3); (4) (nm)
2|0|1|21 1 980.4 970.6; 949.2 985.6; 998.3; 1024.7 2 974.9 958.8; 928.5 989.0; 1022.6; 1036.0 2|0|1|31 1 and 2 978.7 969.1; 953.5 987.0; 997.7; 1016.8 2|0|1|21(lc) 1 978.0 969.5; 949.9 985.9; 998.5; 1020.4 2 964.9 928.8; 921.7 1021.0; 1028.1; 1034.1 3|0|1|31 1, 2 and 3 979.2 969.9; 951.5 988.6; 995.3; 1020.5 3|0|1|41 1 and 2 976.5 943.0; 932.5 1007.8; 1022.5; 1038.3 3 977.6 960.5; 946.9 993.2; 1007.0; 1021.4 3|0|1|31(lc) 1 979.4 968.5; 952.3 987.9; 997.9; 1019.4 2 977.5 966.8; 949.6 988.3; 1001.3; 1018.9 3 964.0 924.2; 914.7 1023.0; 1033.4; 1043.5
3. Spectra of small clusters
Let us now turn to dimers and trimers for which our calculated results are summarized in Table IV. One notices that every small cluster has one predicted (1)↔(5) zero-line transition in the rather narrow (977.6–980.4) nm spectral range, in nice agreement with the most intense lines observed in the absorption and excitation spectra between about 979.45 and 981.6 nm [see Fig.2(a)].
When, in a given cluster, the Yb3+ions are not equivalent,
we expect excitation transfer between the members of the Yb3+
duo or trio during the long (several millseconds) lifetime of the2F
5/2excited level, so that, at very low temperatures, one
should observe only the emission spectrum from the ion with the lowest (5) sublevel, i.e., according to TableIV, from Yb3+
No. 1 in 2|0|1|21, 2|0|1|21 (lc), and 3|0|1|31(lc) clusters and
from Yb3+No. 3 in 3|0|1|4
1. Thus, the second emission line
(5)→(2) should be observed, according to TableIV, at 985.6, 987.0, 985.9, 988.6, 993.2, and 987.9 nm, respectively, for the six clusters of Table IV. All these values fall into the relatively narrow wavelengths range 985.6–993.2 nm, in very good agreement with the experimental observation of a group of intense emission lines in the 985–992 nm domain [see in Fig.2(b)].
From Fig.2(b), the third and fourth emission lines (5)→(3), (4) are obviously much less intense than the two first ones (5)→(1), (2). (This is also the case for the tetragonal monomer, Fig. 3 of [10]). Maybe the small bump which appears at 996 nm in Fig. 2(b) is the (5)→(3) emission of one of the clusters of Table IV, which is predicted in the 995.3–998.5 domain (except for 3|0|1|41).
Among the investigated clusters, 2|0|1|31and 3|0|1|31have
been calculated in Sec.IVB to be constituted of two or three strictly equivalent Yb3+ions7in close vicinity. Thus, they are
expected to yield cooperative visible emission, as is indeed observed for the A1 and A2 sites (see Sec.II).
On the other hand, the clusters 2|0|1|21 and 2|0|1|21 (lc)
are constituted of two nonequivalent Yb3+ ions. Therefore,
they should give rise to no cooperative emission, since one cannot populate the 2F
5/2 level of both Yb3+ ions by the
same pump wavelength (Table IV). This is the case of the experimental sites B and C. Moreover, as mentioned above, there should be excitation transfer, during the2F
5/2lifetime,
between the (5) sublevel of both Yb3+ ions of the cluster,
so that the only expected fluorescence spectrum is the one from the Yb3+ ion with the lowest (5) sublevel energy. This
may explain the behavior of the B site, with a double peaked excitation spectrum for its (5)→(2) emission (see Sec.II).
For similar reasons, 3|0|1|31(lc) with three nonequivalent
ytterbium ions should not display cooperative visible emission and should have a triple peaked excitation spectrum for the (5)→(2) emission of Yb3+ No. 1, which has the lowest (5)
sublevel energy. This is, at least qualitatively, the case of the observed C site, but unfortunately one excitation peak of 3|0|1|31 (lc) is predicted at a much shorter wavelength
7As a result, Yb3+ ions Nos. 1 and 2 of 2|0|1|31are calculated to
have exactly the same spectrum, as appears in TableIV. The same is true of Yb3+ions Nos. 1, 2, and 3 of 3|0|1|31.
(by around 13 nm) than the two other ones (TableIV), while the three excitation peaks of C are observed at 981.6, 980.1, and 979.45 nm (Sec.II). An alternative possibility would be to choose 3|0|1|41, instead of 3|0|1|31 (lc), to match the C
site, with the advantage of having replaced a defect which is not testified by HAADF-STEM experiments by another one which is quite compatible with Fig. 9(d). But, in 3|0|1|41,
two Yb3+ ions are calculated to be completely equivalent to
one another, with the double result that cooperative visible emission is expected, contrary to experiment for the C site, and that only two excitation peaks of the (5)→(2) emission are expected, again contrary to experimental results which show three distinct peaks.
Here are a few more difficulties in our current understanding of experimental data:
(1) The very low temperature absorption spectrum of highly doped CaF2:Yb3+ is observed to extend from about
980 to 920 nm and the corresponding emission spectrum from about 980 to 1050 nm. But the predicted spectra of 2|0|1|21,
2|0|1|31, 3|0|1|31, and 3|0|1|41, do not extend so far: From
TableIVnothing is expected (with the exceptions of Yb3+No.
2 in 2|0|1|21and of Yb3+Nos. 1 and 2 in 3|0|1|41) out of the
980–947 nm domain in absorption and out of the 980–1025 nm range in emission. Maybe, as proposed by Petit et al. [10] from Raman spectra experiments, local vibrations of the clusters are responsible for the short-wavelength portion of observed absorption spectra, as well as for the long-wavelength part of emission spectra.
(2) In absorption (or excitation), the intense (1)↔(5) line is the only one to be clearly testified by experiment. The (1)→(6) and (1)→(7) absorptions are not observed. It looks as if they were so weak as to be concealed by the above postulated vibrational continuum.
(3) All calculations are performed assuming a single defect in the center of a perfect CaF2lattice. No account is taken of the
presence of other defects with random distances, positions, and orientations. We currently ignore to what extent this presence affects the excitation and emission spectra.
V. CONCLUSION
In summary, the question of the existence and of the iden-tification of only one or several coparticipating luminescent Yb3+defects in the heavily doped Yb:CaF2laser crystals has
been examined by using two complementary experimental approaches and by correlating the data with simple crystal field calculations.
The first experimental approach has consisted in recording of low temperature site-selective excitation and emission spectra, with a particular emphasis on the spectral signatures presumably associated with the Yb3+clusters. The analysis of
the results led to the conclusion that at least three categories of Yb3+clusters noted A, B, and C existed, corresponding to
three different types of Yb3+environments. Among them, only
two, called A1 and A2, are associated with two types of Yb3+
clusters belonging to the first category giving rise to visible cooperative emissions, thus coming from coupled Yb3+ions
with very similar energy level schemes.
The second experimental approach has consisted in a direct observation of the crystal structure based on the analysis of
images produced via annular dark-field scanning transmission electron microscopy. The analysis of these high-resolution STEM-HAADF images recorded along the ⟨001⟩ axis of pure and Yb-doped CaF2crystals has evidenced a nonrandom
distribution of the Yb3+ ions within the matrix, in agreement
with the spectroscopic measurements. Comparing the images with atomic models describing the theoretical arrangements of a variety of defect clusters containing trivalent rare-earth ions in different fluorites, including CaF2, at least four Yb3+
arrangements have been identified. The first one is associated with monomers noted as 1|0|0|11, i.e., Yb3+isolated ions with
one interstitial F−ion, and the rest corresponds to clusters: one
with dimers noted as 2|0|2|21, i.e., Yb3+ ion pairs associated
with two interstitial F−ions, one with trimers noted as 3|0|1|31
for three Yb3+ associated with three interstitial F−ions, and
one with tetramers noted as 4|0|8|41for four Yb3+associated
with four interstitial F−ions.
Finally, crystal field calculations have been performed for a number of Yb3+defect centers, including the above-identified
clusters, starting with a potential based on crystal field parameters determined from the calculated positions, by lattice energy minimization, and the previously derived electrical charges of the cores and shells of the ligands. Doing so and using the spin-orbit parameter and the averaged radial integrals which can be determined with the known energy levels of the cubic and tetragonal Yb3+ isolated centers (monomers)
in CaF2, it has been possible to derive the energy level
positions and the resulting spectra of a series of isolated centers (monomers), including those of the controversial trigonal center of C3v symmetry (noted as 1|0|1|21), and a series of
clusters, including those identified through the microscopy analysis made in a particular crystallographic direction. From these data, it can be safely stated that the calculations nicely predict qualitatively most of the important features observed in the spectra of Yb:CaF2. Although it is still difficult to
account for all the experimental details, there are a number of conclusions which can be drawn, some agreeing and some not with those found in the past literature.
First it is clear that Yb:CaF2 must be more considered
as a multisite crystal with a glasslike behavior. Only one kind of hexameric center may be dominant at very high dopant concentrations (probably above 20 at. %), as was originally proposed, but in the case of a “fully concentrated” structure Ca2YbF7 [39,40]. However, at intermediate dopant
concentrations around 0.5%Yb up to about 10%Yb, for which the absorption and the emission spectra and the fluorescence lifetimes do not vary significantly, the conclusion is that the luminescent and laser properties of Yb:CaF2result
predominantly from the contribution of a number of more or less perturbed Yb3+ dimeric, trimeric, and tetrameric
clusters in which the Yb3+ ions experience slightly different
crystal fields and thus have similar level schemes. It is also obvious from the low temperature emission and excitation spectra and from the calculations that the observed intense purely electronic inter-Stark optical transitions occur mostly in absorption between the lowest Stark components of each
2F
7/2 and 2F5/2 electronic multiplets. Therefore, this takes
place around the zero-line transitions, i.e., in the 979–982 nm spectral range, and in emission around again the zero-line but also in the 985–995 nm spectral range which corresponds to
emission transitions between the lowest level of the excited multiplet and the second Stark level of the ground state. The other electronic transitions are so weak that they are drowned within the vibronic sidebands and they cannot be clearly observed. From this point of view, it is quite plausible that these vibronic sidebands can be attributed to a series of electron-phonon couplings and phonon energies associated with the different local vibrations experienced in each Yb3+
cluster, something which was already reported in Ref. [10] from Raman measurements.
Finally, it is worth noting that such a glasslike behavior was already proposed in the past, but via far-infrared and thermal conductivity measurements. Indeed, the far-infrared measurements [41] clearly indicated a continuous distribution of two-level systems, whereas the thermal conductivity mea-surements [42] made as a function of dopant concentration and temperature clearly exhibited, for high dopant concentrations, decreasing thermal conductivities for decreasing temperatures, a behavior which is more typical of alloys and glasses than of perfectly ordered crystals.
ACKNOWLEDGMENTS
The present work was performed and financed within the framework of the LABEX-EMC3 research program entitled MATISS. The authors would like to thank A. Benayad and V. M´enard from CIMAP for the growth and the preparation of the samples, and A. Rosenauer and his group of the Institute of Solid State Physics at the University of Bremen (Germany) for their introduction to the analysis of high-resolution STEM-HAADF images usingMATLABcomputing.
APPENDIX: SAMPLE PREPARATION AND NUMERICAL TREATMENT CONSIDERATIONS IN THE
STEM-HAADF TECHNIQUE
Electron microscopy gray scale images (512 × 512 pixels2)
were acquired in a JEOL ARM200F microscope (200 kV, probe corrected) using the high-resolution STEM-HAADF technique. The electronic probe size, the convergence semian-gle, and the inner semiangle of the detector were respectively set to 0.08 nm, 22.5 mrad and 50 mrad.
Electron-transparent specimens of Yb3+:CaF
2single
crys-tals were prepared by mechanical polishing using the tripod method to get thin areas of homogeneous thickness, which is an important criterion for high-resolution STEM observations. The first side of a 2.5 × 1.5 × 0.5 mm3 piece of crystal was
polished using plastic diamond lapping films with grains of decreasing sizes up to get a mirror face. The opposite side was polished in the same way and the sample was thinned down to approximately 50 µm. To improve the cleanliness of the surface, ethanol was employed instead of water at the end of the polishing step of each side. Then, the electron transparency of the specimen was achieved by argon ion milling in a Gatan Precision Ion Polishing System (PIPS). Ion thinning was performed during less than 1 hour at low energy (<5 keV), low temperature (−150 °C), and low incidence angles (±5°) to avoid irradiation damage. As soon as a hole was formed at the center of the lamella, the specimen was cleaned during 20 minutes at room temperature using ion beam at lower energy
![FIG. 6. SVD analysis applied on Fig. 5(b). (a) Experimental HAADF image of the Yb-doped 5%Yb:CaF 2 viewed along [001], after smoothing to reduce noise](https://thumb-eu.123doks.com/thumbv2/123doknet/13589233.422866/6.911.177.736.104.289/analysis-applied-experimental-haadf-image-viewed-smoothing-reduce.webp)