Engineering Systems Division
Working Paper Series
ESD-WP-2003-01.07-ESD Internal Symposium
THE
CONCEPT
OF
A
CLIOS
ANALYSIS
ILLUSTRATED
BY
THE
MEXICO
CITY
CASE
REBECCA DODDER
Doctoral Candidate
Technology, Management & Policy Program
JOSEPH M. SUSSMAN
JR East Professor
Professor of Civil and Environmental Engineering
and Engineering Systems
T
HE
C
ONCEPT OF A
CLIOS A
NALYSIS
I
LLUSTRATED BY
T
HE
M
EXICO
C
ITY
C
ASE
REBECCA DODDER
Doctoral Candidate Technology, Management & Policy Program
JOSEPH M.SUSSMAN
JR East Professor Professor of Civil & Environmental Engineering and Engineering Systems
Massachusetts Institute of Technology Cambridge, Massachusetts
February 23, 2003
11,873 Words 10 Figures
I
NTRODUCTION
W
HAT IS ACLIOS?
The term CLIOS (Complex, Large-scale, Integrated, Open Systems) was conceived as way to capture the salient characteristics of a class of systems that are of growing interest to researchers, decisionmakers, policy makers and stakeholders. These systems range from an air traffic control system to the global climate system, and from Boston’s Big Dig to the eBay online trading system.1
We start by defining the primary characteristics of CLIOS. First, a system is complex when it is composed of a group of interrelated units (component and subsystems), for which the degree and nature of the relationships is imperfectly known – with varying directionality, magnitude and time-scales of interactions among the various subsystems. Second, CLIOS have impacts that are large in magnitude, and often long-lived and of large-scale geographical extent. Third, subsystems within CLIOS are integrated, closely coupled through feedback loops.
Finally, by open we mean that CLIOS explicitly include social, political and economic aspects (Sussman, 2000a).
Finally, with CLIOS we are as concerned with the complexity of the organizational and institutional parts of the systems as we are with the physical system. In fact, understanding the organizational and institutional structure and its interaction with the physical structure is one of the key potential values of a CLIOS analysis.
M
OTIVATIONThe primary motivation for this paper is the authors’ perception that there is a critical need for a new framework for both analyzing and managing this class of systems. Because of the many sub-systems, the uncertainty in the behavior of the subsystems and their interactions, and the degree of human agency involved, the emergent behavior of CLIOS is difficult to predict and often counterintuitive. This holds true even when subsystem behavior is readily predictable. Developing quantitative models that will predict the performance of the physical system can be very difficult, and management challenges are even more difficult. Increasingly sophisticated systems models have evolved to incorporate economic, social and political interactions with the physical system (Marks, 2002). Nonetheless, the ability to integrate economic, social and political issues into a systems framework has been limited by a relatively weaker understanding of organizations and institutional structures (Flood and Carson, 1993).
To place this paper in its own institutional context, the CLIOS framework is being developed in a time of major transitions in many of the engineering disciplines at MIT and elsewhere (Sussman, 2002b). We view engineering systems as “public” or “open” systems, meaning that the profession is responsible for dealing with and working in the broader social, economic and political environments in which engineering projects are implemented. Illustrative
of this transformation is the new Engineering Systems Division at MIT, created to respond to the intellectual and professional challenges of engineering systems.
While CLIOS can describe many different systems, including natural and social systems, an engineering system could be classified as a special case of a CLIOS in which technology plays an important role. Technology can be one of the integrators of the system, such as a telecommunications network, or technology can be important because of its impact on the
performance of the system. For example, vehicle technologies play a key role in a transportation system, because of the impacts on mobility and other important attributes such as air quality and urban sprawl. We suggest that the CLIOS analysis, when applied to an engineering system, provides an integrated analysis of the interactions of the technologies and institutions by bringing a systems perspective to both.
This paper defines the concept of a “CLIOS Analysis” drawing from the Mexico City Metropolitan Area (MCMA) transportation/environmental/land-use system to illustrate the various steps in the CLIOS Analysis.
K
EY
C
ONCEPTS
S
UPPORTING A
CLIOS A
NALYSIS
A CLIOS R
EPRESENTATIONThe CLIOS analysis begins with a “representation” of the CLIOS both diagrammatically as well as with supporting text. The motivation for the CLIOS representation is to convey the structural relationships and direction of influence between the components within a system. In this sense, the CLIOS representation is organizing mechanism for first exploring the system’s underlying structure and behavior, and then identifying options and strategies for improving the system’s performance.
The steps outlined below for developing a CLIOS representation are intended to assist one in capturing the key characteristics of a system in an organized and systematic manner, and therefore avoiding the omission of salient factors in both its physical and
organizational/institutional manifestations.
Developing a CLIOS representation is largely a conceptual process. Rather than
expecting quantitative results from the CLIOS representation, the purpose to develop insight into the emergent behavior of the CLIOS and possible strategies to enhance its performance. This does not suggest, however, that quantitative analysis is neither possible nor useful for other aspects of the CLIOS analysis, such as the identification of performance measures and evaluation of options for performance improvements.
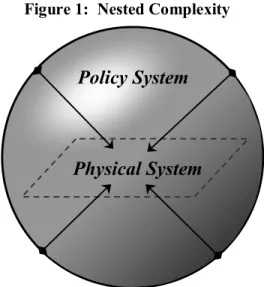
A key motivation for a CLIOS analysis is the idea of “nested complexity.” This concept suggests that there is a physical system, the behavior of which, while complex, follows more quantitative principles that can be approximated by engineering and economic models.
However, the physical system, represented by the inner plane in Figure 1, is embedded within a much “messier” sphere representing the policy system. This sphere represents the organizational and institutional framework of policymakers, firms, non-governmental organizations, and
stakeholders that together comprise the broad policy system.2 Analyzing this outer sphere of organizations and institutions requires different methodologies – usually qualitative in nature and often more participatory, such as evaluation of stakeholder perspectives and organizational analysis.
We therefore have “nested complexity” when the physical system is being “managed” by a complex organizational and policymaking system. However, while we make a distinction between the physical system and policy system – which captures the primary stakeholders as well as the policymaking and other decision-making institutions – we also need to explicitly represent the connections between the physical and policy systems. Indeed, an important step in the CLIOS representation process is to identify and characterize these policy-physical system links. Understanding nested complexity is a necessary step in moving towards better integrating institutional and policy design with physical system design.
2 We realize that representing the physical and policy systems in this manner – more structured and quantifiable physical systems,
compared to messier, more chaotic, and more complex, human-based policy systems – runs the risk of overstating the dichotomy between systems composed of “things” and systems composed of “people.” This discussion has been taken up by researchers from many disciplines, we would refer the reader to Almond and Genco, 1977 and Flood and Carson, 1993 (in particular, pages 251-2).
Figure 1: Nested Complexity
Policy System
T
YPES OFC
OMPLEXITYAnother function of the CLIOS representation is to explore the nature and primary sources of the complexity of the system. While there is a long and growing list of the different types of complexity that characterize systems (Sussman, 2002c, Lloyd, 2002), here we find it useful to think of complexity along the three dimensions (Sussman, 2000b):
(1) Internal complexity (i.e. the number of components in the system and the network of interconnections between them),
(2) Behavioral complexity (i.e. the type of behavior that emerges due to the manner in which sets of components interact), or
(3) Evaluative complexity (i.e. the competing perspectives of decisionmakers and
stakeholders in the system who have alternate views of “good” system performance). Because we envision CLIOS analysis as a tool in identifying policy or management interventions to improve the system, understanding the source of the complexity of the system becomes crucial. Understanding the internal and behavioral complexity – basically, how the CLIOS works – enables the analyst to identify changes to the system to achieve more desirable outcomes. Once those changes are identified, however, the evaluative complexity will determine the feasibility of actually implementing those options, by highlighting areas where barriers to implementation, resulting from different stakeholders views, might exist.
M
ETHODOLOGY
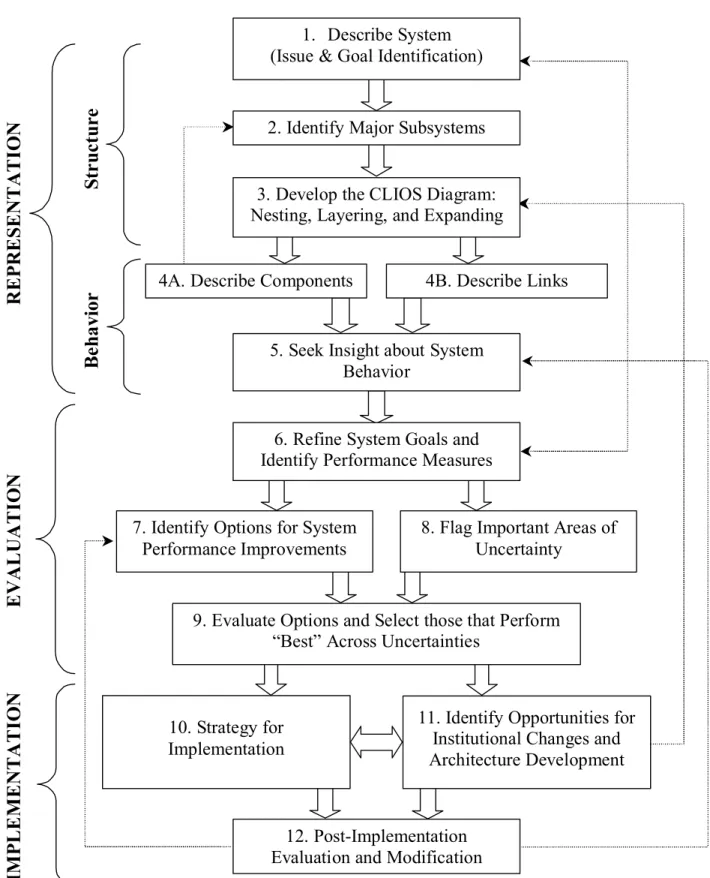
A CLIOS analysis, outlined below, involves three phases. During the first phase, the CLIOS representation is created and analyzed with reference to both its “structure” and “behavior.” Then, in the evaluation and implementation phases, we build upon the insights drawn from the CLIOS representation, utilizing it to measure the system’s performance along various dimensions and to identify strategies for system improvements. Each of the phases will address a different set of questions about the system:
(1) REPRESENTATION Structure
What are the technical, economic, social, political and other subsystems? How are the physical subsystems embedded in a political and institutional
structure?
In the physical system, can we break out several relatively independent types of physical systems that are “layered” upon one another? Can this be done for the policy system as well?
Behavior
What is the degree and nature of the connections between subsystems? Are the connections weak or strong?
Are there important feedback loops connecting subsystems? What insights can we gain into emergent behavior?
How is performance measured for the entire CLIOS as well as the physical subsystems?
How do key stakeholders and decisionmakers measure or rank different types of performance?
What are the tradeoffs among the various dimensions of performance? How could performance be improved?
(3) IMPLEMENTATION
How do these performance improvements actually get implemented, if at all? What compromises have to be made in the name of implementation?
What actors/organizations on the policy sphere have an influence on the parts of the system targeted for intervention?
Do the types of policies made by different organizations on the policy sphere reinforce or counter each other?
Under the current institutional structure, can organizations manage the system to achieve reasonable performance levels?
While the first two phases are used to understand behavioral, internal and evaluative
complexity, the final phase brings these together to form a strategy for implementing changes to
the system. One of the departures of the CLIOS analysis from other system approaches is that the strategy for implementation includes changes to both the physical and institutional systems.
The following discussion will outline the structure of a CLIOS analysis, as illustrated in Figure 2. We will first present the “12 Steps in a CLIOS Analysis,” so that the reader has an idea of the overall process, and then define and discuss each step in greater detail. Although we will be explicit about the steps involved in the methodology, recognize this is an iterative process, and not a rigid, once-through process. For concreteness, we will focus on the case of Mexico City, one of the world’s largest megacities, which is attempting to improve its air quality under the pressures of a growing population and economy, and the concomitant expansion of demand for goods and services, housing, transportation, and energy. With a complex institutional structure as well, Mexico City is certainly a CLIOS by any standard.3
3 While more simplified examples will be used here for illustration of the methodology, the full Mexico City CLIOS will be
Figure 2: 12 Steps in a CLIOS Analysis
5. Seek Insight about System Behavior
6. Refine System Goals and Identify Performance Measures
7. Identify Options for System Performance Improvements
8. Flag Important Areas of Uncertainty St ru ctu re Be ha vior IM P LEMENT A TIO N EV ALU A TIO N REP R ES ENTA TIO N
4A. Describe Components 4B. Describe Links
10. Strategy for Implementation
11. Identify Opportunities for Institutional Changes and Architecture Development
12. Post-Implementation Evaluation and Modification
9. Evaluate Options and Select those that Perform “Best” Across Uncertainties
3. Develop the CLIOS Diagram: Nesting, Layering, and Expanding
2. Identify Major Subsystems 1. Describe System (Issue & Goal Identification)
R
EPRESENTATIONStructure
During the first stage in developing the CLIOS representation, the structure of the system and its subsystems is captured in a diagram and accompanying text. This requires not only looking at the system at various scales, but also structuring the system according to both its policy and physical systems (the source of nested complexity) and separating the physical system into several of its core physical subsystems that are essentially “layered” upon each other. The concept of layers may also be used to characterize the institutional system.
Step 1: Describe System (Issue and Goal Identification)
The first step in developing the CLIOS representation is to provide an overarching description of the CLIOS, identifying the salient characteristics and issues. This step can be simply a list or an in-depth description, but should address the questions posed by Puccia and Levins (1985), “What is it about the system that makes it interesting?” They suggest drawing upon not only reports in the literature, but also previous experience with this or other related systems. More specifically, we can ask of each CLIOS:
• What is the temporal and geographic scale of the system? • What are the core technologies and systems?
• What are the natural physical conditions that impact or are impacted by the system? • What are the key economic and market issues?
• Are there any important social or political issues or controversies that relate to this system?
• What are the persistent and “irresolvable” problems?
This initial description of the system, which can be highly detailed or simply a list of points, serves as a valuable checklist for the rest of the analysis. In particular, as the CLIOS representation is developed, one can return to this checklist to identify any major issues that have been omitted from the representation.
Above all, this description and issue identification should capture the concerns and needs of policymakers, managers and stakeholders. While this is essentially an overview or scan of the overall system, embedded in this overarching description of the CLIOS is a problem definition. The CLIOS analysis is intended to facilitate better management of the system, one has to ask, “What are the policy questions that need to be addressed?” and “What are the goals for the CLIOS?”
This first step also implies a preliminary “bounding” of the system. For example, given that CLIOS are, by definition, large-scale systems, the analysis needs to take into account the actual scale of the system (spatial and temporal), and the magnitude and scope of its impacts – physical, economical, political and social. This will not only determine where the system boundaries are drawn, but also which subsystems and components will be included. The relationships between the CLIOS and the broader external environment cannot be ignored, and
will be important in the uncertainty analysis. For example, in a CLIOS analysis for a
metropolitan level transportation and environmental system, one may not include the national or global economic system as an integral part of the CLIOS. Nevertheless, one would need to think through issues such as the impact of globalization, the health of the global economy or major shifts in world oil prices on the local regional economy and what that would mean for the development of the transportation system and the local environment. As will be discussed later, scenario building will be one tool to think systematically about these linkages between the CLIOS and the broader environment.
We emphasize that this is an iterative process. At later stages, one may realize that the system has not been framed correctly, or that some important parts of the CLIOS have been left out or only partially represented. In this case the analyst might even return to the first step, and redefine the boundaries of their own system. Generally, this redefinition will be an expansion of the CLIOS boundaries. Senge (1994) illustrates through a simple case of beer retailers and wholesalers, why there needs to be broader systems viewpoint for systems to be managed successfully. One’s own system will not succeed, unless the larger system works.
While system boundaries are one case of the need for an iterative process, system goals are another. In Step 1, some preliminary system goals will be identified as the overarching
description of the CLIOS is developed. However, these goals will be revisited in greater depth in Step 6 (Refine System Goals and Identify Performance Measures), after the CLIOS
representation has been developed in more detail. Operationalizing system goals into performance measures may lead one to revisit the system goals as originally conceived.
A BRIEF INTRODUCTION TO THE MEXICO CITY CLIOS
In developing a CLIOS representation for the Mexico City Metropolitan Area (MCMA), we must turn first to the policy issues that motivate the analysis. Our intention is to examine opportunities for air pollution emissions reductions, in order to mitigate future damage to public health, and to enhance economic productivity and quality of life.
The combination of topography and meteorological conditions, together with the pressures of industrial growth and increased auto ownership (triggered by growth in per capita GDP) has produced an air quality problem of the first magnitude. While air quality is recognized as an important policy objective, economic and industrial growth have historically been the overriding policy concerns for Mexican politicians. Although in recent years there have been tendencies toward demographic, economic and political decentralization, Mexico remains a highly centralized system due to the historical concentration of investment and growth in the core of Mexico City, the Federal District.
While the capital city has been the focus of many regional and national development goals, as with many developing countries there is a tremendous range in wealth among its citizens. This inequality influences everything from the use of the transportation system, particularly the relative split of private to public transport, to the patterns of residential
development. In the past few decades, the city has experienced an increasingly sprawling land use pattern fueled by both illegal settlements on the fringes and “suburbanization” by its wealthier citizens, and the resistance of “delegaciones” to densification.
Urban sprawl leads to other important environmental issues related to deforestation, soil erosion, and overexploitation of local and regional water supplies (Molina and Molina, 2001). But this phenomenon is also tightly interconnected with air quality through operation of the surface transportation system. As land use patterns become less dense and not well planned, the efficacy of public transit systems deteriorates and the costs of service provision escalate. As one of the major contributors of emissions, the transportation system is also subject to substantial congestion, which not only exacerbates the air quality issues in the MCMA, but also impacts the quality of life of residents through lost travel time, and poses a constraint to the efficient
operation of industries transporting their goods in and out of the metropolitan area.
While we must draw certain system boundaries to focus the analysis and understand the CLIOS’ internal structure and behavior, the “openness” of the system must also be recognized. For the MCMA, while the state of the national economy and trends in internal migration and natural population growth might not be a factor that is included within the CLIOS, the impact of crucial links to the outside need to be recognized, such as fluctuations in the economic health of other countries, especially the US. As we will see later, these “external” factors pose important uncertainties, and should be considered in the development of policies.
A BRIEF INTRODUCTION TO THE MEXICO CITY CLIOS (CONTINUED)
In order to provide a checklist for the CLIOS analysis, we can extract some of the most salient issues that come to bear upon the issue of air quality and transportation in Mexico City. • “Megacity” close to 20 million people in Mexico City Metropolitan Area (MCMA).
• The combination of topography and meteorological conditions, together with increased auto ownership, producing an air quality problem of the first magnitude.
• As with many developing countries, a tremendous range in wealth among its citizens. • A sprawling land use pattern fueled by both illegal settlements on the fringes and
“suburbanization” and the resistance of central city “delegaciones” to densification.
• A surface transportation subject to substantial congestion – throughout the day in some parts of the city – exacerbating the air quality issue in the MCMA.
• The MCMA as institutionally complex, considering its relation to the federal government and relationship between the Distrito Federal (DF) and the Estado de Mexico (EM).
• The MCMA as the economic engine of Mexico, but dependent on the economic health of its neighbor to the north.
• Economic growth as a driving policy.
• A potentially extraordinary political shift for Mexico with the election of President Fox in 2000, after 71 years of presidential rule by the same party.
Step 2: Identify Major Subsystems
The next step is then to determine which major subsystems – technical, natural, economic, social, and political – compose the CLIOS and how they relate to one another on a macro-level, in order to outline the general structure of the CLIOS. One way to identify these subsystems is by grouping the phenomena and issues identified in the first step. In the case of a Mexico City CLIOS, by grouping the issues highlighted above, the major physical subsystems would include the environment, land use, transportation, and economic activity.
Figure 3: Relationships between Subsystems
Environment
Land Use
Transportation Economic
Since many CLIOS will encompass several types of technological or physical systems, the subsystems can often be organized according to their common technological characteristics or their functions. This will depend on the questions that need to be addressed for the analysis. For example, the transportation system as a whole can be considered as one subsystem, or one could separate the transportation system into freight and passenger transportation, which have similar technological bases but different functions and operations. This would also alter how the decisionmakers and stakeholders on the outer policy sphere (as shown later in Figure 7) are arranged with respect to these subsystems. The major subsystems may be grouped according to specific policy or disciplinary domains, while bearing in mind that a disciplinary or policy bias can also be too constraining and leave out important parts of subsystems or connections between them.
Step 3: Develop the CLIOS Diagram: Nesting, Layering, and Expanding
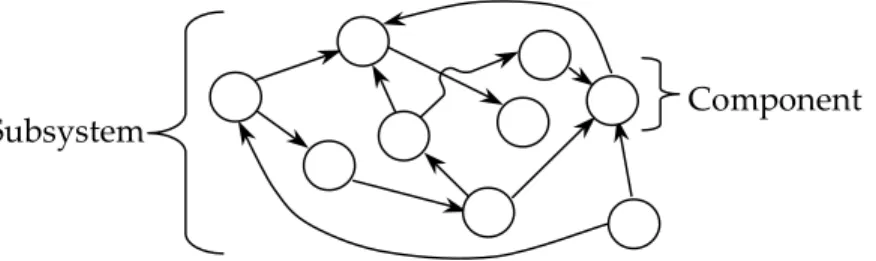
In this step, an initial CLIOS diagram is created by breaking out each subsystem – such as passenger transportation or land use – in greater detail, and identifying the major components in each subsystem. The CLIOS is mapped with the individual subsystems (transportation, land use, etc.) represented by a system diagram that shows its major components (identified as circles in Figure 4 and links indicating influence of one component upon the other. This type of basic system diagram is common in systems sciences, “defined as having elements and relations that may be represented (at least in principle) as a network-type diagram with nodes representing elements4 and lines the relationships” (Flood and Carson, 1993).
While this initial systems diagram helps to map out the system, the use of this type of diagram on its own quickly reaches its limits. There is a cognitive upper bound to the number of subsystems or “components” that can be represented within such a diagram, while still providing an opportunity for insight to a user of the diagram.5 However, remaining within this cognitive limit will necessitate oversimplifying the system, leaving many of its technological, economic, social and political subsystems poorly represented. In order to expand the system diagram into a fuller representation of the system, we will develop three mechanisms for expanding the system without overwhelming the user (or the creator) of the diagram: expanding, nesting and layering.
4 We use the term “components” to mean the same as “elements” in Flood and Carson (1993).
5 From the authors’ experience, a single subsystem diagram should contain approximately 20 components, although that number
may be substantially more or less depending upon the personal preferences and abilities of the analyst.
Subsystem Component
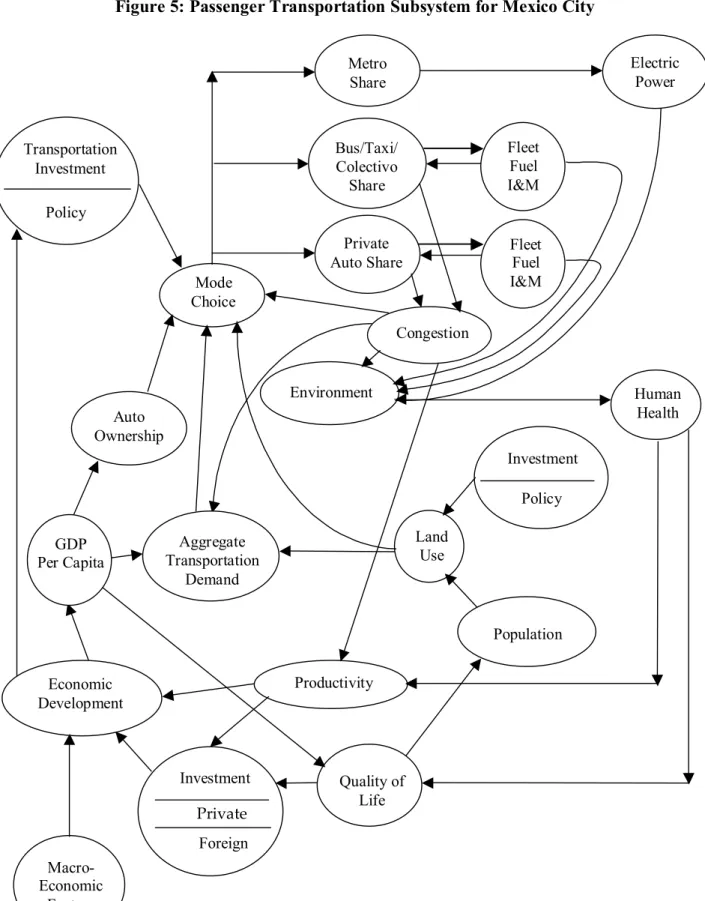
Before turning to the issues of expanding, nesting and layering, it may be helpful to examine an actual example of a diagram for a key subsystem in the Mexico City case: the passenger transportation system. While Figure 5 will be developed here in its simplified form, after further discussion of the CLIOS representation, we will return to the same diagram (in Figure 10), representing it in its more complex form, and including the notation for
Figure 5: Passenger Transportation Subsystem for Mexico City Private Foreign Investment Electric Power Transportation Investment Environment Metro Share Private Auto Share Productivity Bus/Taxi/ Colectivo Share Fleet Fuel I&M Mode Choice Congestion Fleet Fuel I&M Economic Development Land Use Auto Ownership Investment Human Health Policy Aggregate Transportation Demand GDP Per Capita Macro- Economic Factors Quality of Life Policy Population
The diagram shown for the Mexico City passenger transportation system provides a comprehensive overview of the critical components in the passenger transportation system in the context of air quality. Two aspects of this diagram should be noted. First, while this represents one subsystem described in detail, many of the other subsystems – such as land use,
environment, and electric power – appear in the diagram as single components. Clearly, we cannot expand each of these components fully within the same diagram without the diagram becoming overwhelmingly complicated. Second, while some of the components such as
“investment” and “policy” are policy-related components, none of the components of the policy system are shown. This physical subsystem is embedded within a policy system; further, this subsystem represents but one layer in a multi-layered physical system.
Nesting
First, by nesting the systems (as shown in Figure 1) the basic CLIOS diagram is separated into the inner physical system and outer policy sphere. Because many CLIOS are engineering systems,6 a major part of the physical sphere may be oriented around a system of technologies (e.g. transportation, IT, energy) but can also represent a natural system (e.g. climate, ecosystem). While the policy sphere will include the usual actors – policymakers and decisionmakers who most visibly influence the system – it may also include other actors whose decisions impact the system in a subtler manner. For example, while in Mexico City the environmental authorities and transportation planners would clearly be included, so would less obvious stakeholders such as bus companies and taxi associations and non-governmental organizations.
For the CLIOS representation shown above for passenger transportation, nesting would be accomplished by linking the policy components of “investment” and “policy” decisions to policymakers, decisionmakers and stakeholders on the policy sphere. Therefore, the policy sphere would need to include actors such as the Secretaries of Transportation for the Federal District and State of Mexico, financial institutions, private sector firms, and public transit operators.
Layering
Another organizing tool is the layering of physical systems into several separate but interrelated subsystems of a similar scale. The layering format serves two main purposes. First, it permits the further expansion of the subsystems, without resulting in a two-dimensional subsystems diagram containing an incomprehensible number of components, such that gaining insight is impossible. Second, it forces the analyst to identify both where subsystems are separable and distinct physical systems, as well as where they are interlinked, either because of common components, which may even be exogenous to the systems, or because of direct links where a component in one layer influences a component in another layer. The layering of the systems can be determined according to the predominant technologies involved or the functions of those subsystems.
physical “subsystems.” There may be some CLIOS for which the physical system cannot be divided into distinct subsystems, in which the system would resemble Figure 1, in which a single system layer is embedded in the policy sphere.
In the case of Mexico City, the common drivers across the subsystem layers of passenger transportation, freight transportation, industry, land use, would include population growth, regional production, income levels and inequality, and employment. As is suggested in Figure 6, a generic depiction of layered subsystems, the common drivers does not necessarily have to go through all of the layers. For example, income levels would be an important driver for passenger transportation and land use, while regional production would be relevant common drivers for freight transportation, industry, and land use.
Although we decouple the subsystems into layers, not only do we have to look for connections between the subsystems, but also for these common drivers. While we know that population and economic growth drive the entire Mexico City CLIOS, by looking at its
differential impact on individual subsystems, we can begin to unravel the more subtle ways that these drivers influence the overall system.
Figure 6: Layered Subsystems with Common Drivers
Subsystem 1 Subsystem 2 Subsystem 3 Subsystem 4 C o mm o n D ri v e r Co m m o n Dr iv er
AN EXAMPLE: INFORMAL SETTLEMENTS AND PUBLIC TRANSPORTATION
As a critical “common driver” of the system, poverty is one of the contributing factors to illegal land invasions that are leading to the unplanned and sprawling residential developments that are emerging along the fringe of the urban area, particularly in the State of Mexico. At the same time, the poor represent the income bracket most likely to use the public transportation systems, the so-called “captive riders” of public transit. Therefore, by looking at the competing influence of this driver on two different layers – passenger transportation and land use – we can begin to ask questions such as: “How do we deal with this disparity between the growth in the potential demand for public transportation, and the inefficient urbanization patterns which make it more difficult to provide public transportation services to these particular groups?”
By identifying the tension between these layers, which are interconnected by their common drivers, we can the CLIOS diagram to identify sources of potential problems. In fact, one of the consequences of this tension between the supply and demand for public transportation services has been the explosion of a paratransit services known as colectivos or collective taxis. These low to medium capacity vehicles have filled an important gap in transportation supply that could not be met by traditional bus services or private autos. Yet, despite their important role in providing mobility, they are viewed negatively by the Mexico City authorities, due to their perceived impacts on congestion and air quality, and their operational practices.7
Bringing together the ideas of nested complexity and layering, as seen in Figure 7, these two concepts can help to convey a more intuitive sense of the interaction between the outer
policy sphere, which houses the institutional, organizational, political and social actors, and the
physical layers which represent technological, natural as well as economic subsystems. As will be discussed later, given the potential audiences for the methodology behind the CLIOS
representation, this visualization element of the CLIOS diagram can be very important, since insights will be drawn more through this more qualitative and diagrammatic representation, rather than a quantitative analysis.
This separation into the policy and physical also requires that the analyst clarify the set of actual decisionmakers that influence the development of the system. For example, one could have colectivo owner-operators as actors within the physical system, with a focus on their individual economic decisions. However, if the colectivo operators organized in route associations with sufficient political influence, they would be considered as relevant actors in policy decisions, and would then be represented on the policy sphere. As policy actors, their decisions and input could alter several components in the physical system, such as colectivo fleet size and turnover, or they could have an impact on investment decisions, for example, in
intermodal facilities to allow for transfers from colectivos to the Metro system. In summary, the primary difference is that the individual colectivo operators make private, economic decisions, while the colectivo route associations make more public, political decisions.
Expanding
Finally, there is the method of expanding. This represents an alternative technique to nesting or layering for exploring certain aspects of the system in more detail. If one of the components in a subsystem, congestion for example, seems to be an important component of the system, by opening the “black box,” we can look more closely at the internal dynamics. Rather than creating an entire additional subsystem, which we might do for other components such as land use or the environment, the component of interest is simply “pulled out” of the system, in order to perform a mini-analysis of that specific component. After that component is analyzed, we can “reinsert” the component into the system diagram, although with a much clearer idea of what drives the dynamics and the variation in that component.
Behavior
Having developed the general structure of the CLIOS, the next steps (4A, 4B, 5) are to characterize the behavior of the system, first in terms of its individual components and links, and
in terms of its emergent behavior. While much of this is shown diagrammatically, to some extent the representation of the behavior will also need to be done with supporting text. Attempting to have enough different symbols for components and arrows to reflect all of their relevant characteristics would probably be more confusing than illuminating.
Step 4A: Describe Individual Components
While to this point, the components have been considered as generic elements in the subsystems, in this step we more carefully characterize the nature of the individual components. Within the physical system, there are three types of components, as illustrated below:
Components are the basic elements of the CLIOS diagram within the physical system. These elements can be expressed in different forms, qualitative or quantitative,
nominal, ordinal or interval. They can refer to simple concepts, or can contain complex subsystems.8
Policy Levers are the elements within the physical system that are most directly controlled or influenced by decisions by the institutions and organizations of the outer policy sphere.
Common Drivers are elements that are shared across multiple and possibly all layers of the physical system. These elements may also be influenced by macro-level factors outside of the boundaries of the CLIOS.
While most of the elements within the system will be described simply as components, the other two box types are derived from the earlier process of nesting and layering. Most relevant to the process of nested complexity, the policy levers are the elements that directly link the policy system to changes in the physical system. The common drivers, on the other hand, emerge from the process of layering the systems.
The common drivers are important from both for understanding the behavior of the system as well as for later stages of implementing changes to the system. First, they may be exogenous to the physical system. Second, they may constitute major sources of uncertainty, since they impact the physical system at several different layers. The uncertainty of the common drivers, such as population and economic growth, will have to be taken into account in any evaluation of options for system improvement.
In addition to the three types of components that are characterized in the diagram, the supporting text for the CLIOS representation should provide more detail on the behavior of the individual components. One important attribute to be considered is described by Magee and de Weck (2002) as “time dependence.” In their classification of system attributes, they describe time dependence as the change in the system’s state or any of the other system’s properties over time.” While time variance (the system is dynamic, not static) arises from the interaction
may occur within the components themselves.
DESCRIBING CHANGE IN INDIVIDUAL COMPONENTS
In the Mexico City application of CLIOS, from a policy standpoint, we are quite interested in the rate at which technologies “change” or are “substituted” since many policy options dealing with transportation and environmental issues will call upon a technological solution. For example, we could look at a fleet of vehicles for private autos, buses, or heavy freight trucks. While the vehicle fleet may be represented as a single component within the diagram, there are still complex dynamics within this component. The “rate of change” could be the growth in absolute number of vehicles or the “rate of change” of the average fuel efficiency and emissions performance of the fleet. In terms of the “substitution” we think of the turnover of vehicles, and policy options that affect the rate at which new elements come in (incentives for buying new vehicles) or old elements go out (inspection and maintenance and scrappage
programs). In comparison, there is the variation of the road infrastructure, another “component” which is much slower to change. Also, infrastructure investment is “lumpy” because one can, say, either build a bridge or not (Sussman, 2000b).
A motivation for understanding internal variation in the individual components is that this links to the issue of the time scale on which the systems are operating. It is important to know both how fast and how strong the links are between components (as will be described in the next step), but also the internal changes within the components themselves. While some of the more important or complex components may undergo “expansion” in the diagram, therefore
transforming internal variation into more visible linkages, variation can be used to indicate that the components are not static elements, as described in the example above.
Step 4B: Describe Individual Links
Similarly, as the components were characterized and divided into different types, we also need to characterize the nature of the links. As stated earlier, one key perspective is the need to be “disciplined” in one’s diagrammatic notation. Links and arrows need to be consistent, and if they mean different things, one will have to use different diagrammatic elements (Carson and Flood, 1993). In the diagrams used in the CLIOS representation, these links will be largely qualitative. However, while hesitating to suggest a highly detailed notation that would work for all CLIOS, at the least, the links must indicate:
• Directionality of influence and feedback loops9
• Magnitude of influence (big/important or small/marginal impacts on the adjoining components)
Other possible characteristics to include in the notation for the links include: • Timeframe of influence (short-, medium-, or long-term lags)
9 Feedback loops in which one component has a feedback loop directly back onto itself would ideally not be used in a CLIOS
representation. Instead, the intervening components need to be identified, to provide insight into the chain of causality that creates this feedback.
• Functional form of the influence (linear/non-linear functions of various forms or threshold effects, step functions)
• Continuous or discontinuous (under what conditions the link is active or inactive) • Uncertainty in the effect of one component upon another (including uncertainty in all of
the above characteristics).
LINKS: TRANSPORTATION, ENVIRONMENT, AND LAND USE
While directionality and magnitude of influence are straightforward characteristics that would be included in any CLIOS diagram, the other possible characteristics that need to be captured will probably vary for different CLIOS. Within the Mexico City CLIOS, there is a range of characteristics across links. The land use subsystem has long-term lags on the order of years, for example, the growth of informal squatter settlements and the provision of
infrastructure. Alternatively, the influence of links in the environmental subsystem can manifest themselves in hours, as emissions are transformed into concentrations of pollutants such as ozone. In terms of the functional form, another highly important link is that of GDP per capita and motorization. There appears to be a threshold effect in Mexico City and other developing country cities; therefore, when incomes reach a certain level, auto ownership increases
dramatically.
In thinking about the linkages, one of the key components in the CLIOS representation will be to develop a framework for thinking about and describing the links in the system. By drawing upon the idea of nested complexity, we can identify three classes of links:
(1) Between components within the physical system
(2) Between components within the physical system and components within the policy system.
(3) Between components within the policy system
For each of these classes of links, there are different approaches appropriate to each. Generally the links within the physical system (Class 1) can be analyzed using engineering- and microeconomics-based methods, and will usually be quantifiable. Regarding the links from the policy sphere to the physical layers (Class 2), quantitative analysis is less useful, since human agency organizational and stakeholders interests come into play as they attempt to induce changes in the physical system. Finally, there are the interactions that take place within the policy system itself (Class 3). Understanding this class of links requires methods drawing upon organizational theory, and institutional and policy analyses.
While the interactions within the physical system and within the policy systems more readily fall under the domain of more traditional disciplinary perspectives, we would argue that the interactions between the policy and physical systems are of the most interest to the evolving field of engineering systems. As phrased by Karl Popper (1972) “obviously what we want is to understand how such non-physical things as purposes, deliberations, plans, decisions, theories,
intentions and values, can play a part in bringing about physical changes in the physical world” (cited in Almond and Genco (1977), emphasis in original).
Once the general structure of the CLIOS has been established, and the behavior of individual components and links has been relatively well characterized, the next stage is to use this information to gain a better understanding of the overall system behavior, and where possible, emergent system behavior. This step entails essentially tracing through the system at its different levels – the physical layers and policy spheres. By tracing through the pathways in the CLIOS, there are several sources of important systems behavior that can be identified by asking the following types of questions (among others).
First, with respect to the physical layers (Class 1):
• Are there strong interactions within or between subsystems?
• Are there chains of links with fast-moving, high-influence interactions? • Are some of the paths of links non-linear and/or irreversible in their impact? • Can strong positive or negative feedback loops be identified?
Second, looking at the links between the policy and the physical sphere (Class 2):
• Can one identify components within the physical systems that are influenced by many different organizations in the policy sphere (“A” in Figure 8)?
• If so, are they pushing the system in the same direction, or is there competition among organizations in the direction of influence?
• Alternatively, are there organizations on the policy sphere that have an influence on many components within the physical system (“B” in Figure 8)?
Third, within the policy system itself (Class 3):
• Are the relationships between organizations characterized by conflict or cooperation? • Are there any high-influence interactions, or particularly strong organizations that have
direct impacts on many other organizations within the policy sphere?
• What is the hierarchical structure of the policy system, and are there strong command and control relations among the organizations?
• What is the nature of interaction between organizations that both influence the same subsystems within the physical system (“A” in Figure 8)?
As illustrated in Figure 8, a core concern and motivation for this type of CLIOS analysis is to think through the systemic impact that the organizations on the policy sphere can have on the physical system.
In this stage, rather than attempting to quantify the relationships, the focus should be more on simply “getting the sign right” (Marks, 2002) or understanding the direction of change through a series of complex and uncertain chains of links. Furthermore, in this stage, we may also begin to develop a catalogue of potential issues and solutions in CLIOS. The idea is that in a CLIOS representation, certain type of links –fast, large magnitude, irreversible, etc – should raise a warning flag that there could be a potential problem (or opportunity) arising from this link or sequence of links. For example, certain components may be pulled in two directions
simultaneously by two different loops. These loops can be purely within the physical system, but are also likely to arise when different actors on the policy sphere have an influence on the same components within the physical system (as identified in Figure 8 as “A”).
Now that we have analyzed the CLIOS from the standpoint of its structure and behavior, the next steps will focus on the evaluation of the CLIOS, and will end in the development of options for system improvements.
E
VALUATIONStep 6: Identify and Refine Performance Measures
In order to study the performance of the systems, those elements within the systems that constitute important parameters for evaluating the performance of a subsystem, need to be
identified and given units for measurement. Diagrammatically, this can be represented for any of the system elements – components, common drivers, or policy levers – by a double line for the
A
B
A
For example, referring to the system diagram of the Passenger Transportation Subsystem, certain common drivers such as economic development or GDP per capita, are important
performance measures for many stakeholders. Not only do these measures reflect the economic health of the city, but because economic growth depends in part upon the efficacy of the
transportation system to bring goods to customers, customers to stores, and employees to work, then economic health can indirectly reflect a well-functioning transportation system. Policy
levers can also be performance measures in themselves. For example, the level of investment in transportation can be viewed as a performance measure, although it actually measures the financial inputs to the system, and not necessarily the output of that investment (better roads, cleaner bus fleets). Finally, components such as congestion or human health can be key performance measures.
Performance measures for CLIOS are often difficult to define, and it is not uncommon that consensus fails to be reached on even how to measure or prioritize different performance measures. In this sense, we are confronted with the evaluative complexity inherent in CLIOS. “Performance” will depend heavily upon the viewpoint of the analysts, decisionmakers, and stakeholders. However, it is also important that each of these actors involved in the CLIOS understand other actors’ measures of performance. One may even find that difficulties in
defining performance measures that capture all of the phenomena of interest, lead one back to the first step, to challenge the initial description and bounding of the system. This emphasizes that this process is highly iterative, since the following step, identifying options for system
performance improvements, will provide important feedback regarding how to measure performance.
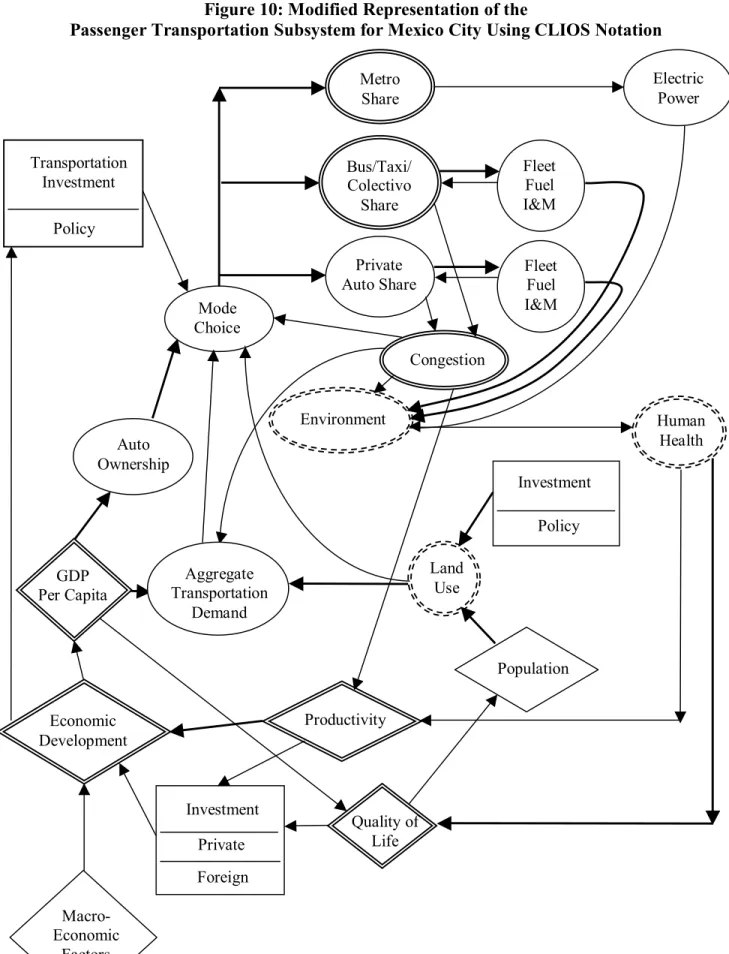
Now that the notation for the CLIOS representation has been fully developed, we return briefly to the original diagram (Figure 5) of the passenger transportation subsystem.
Figure 10: Modified Representation of the
Passenger Transportation Subsystem for Mexico City Using CLIOS Notation
Electric Power Transportation Investment Environment Metro Share Private Auto Share Productivity Private Foreign Investment Bus/Taxi/ Colectivo Share Fleet Fuel I&M Mode Choice Congestion Fleet Fuel I&M Economic Development Population Land Use Auto Ownership Investment Human Health Policy Aggregate Transportation Demand GDP Per Capita Quality of Life Policy Macro-
different elements – components, common drivers, and policy levers – some of which are performance measures as well. In addition, we have identified components that can be layered into separate subsystems (although we have not included these diagrams in this paper), and these are identified by dashed lines for their boundaries. A complete discussion of the Mexico City CLIOS will be developed in a subsequent paper; in our quest for brevity, we have decided to focus primarily on methods in this paper, using Mexico City only as a stylized example.
Step 7: Identify Options for System Performance Improvements
As the performance measures for the system and subsystems are established, it will naturally lead to questions about how the system’s performance can be improved. Indeed,
performance improvements can be identified using the CLIOS representation in two “directions.” In terms of the diagram of nested complexity, we can think through options from the “outside in” or from the “inside out.”
Thinking through system performance from the “inside out” (from the inner physical layers to the outer policy sphere), is a more bottom-up engineering approach, in which we look first at the physical system, and ask how the subsystems in the physical system, through changes to the components or perhaps, in some cases, changes to the links between them, can lead to better performance. This approach usually leads to more technology-driven policy options such as technology mandates and standards, since there are clear specifications about the performance goals that need to be reached. Once the improvements “inside” the physical system are
identified, one then looks “out” at the policy systems, to highlight the interventions that need to be made by the policy system to accomplish those changes to the physical system.
The alternative method is to look at the impact of policy options from the “outside in.” This approach to identifying system improvements is common when speaking of policy
measures that rely on incentives or disincentives such as taxes, subsidies, voluntary agreements, and restrictions on certain behaviors. Implicit in these types of options is usually an assumption about how that policy change, beginning on the policy sphere, will cascade through the physical system, and what target for the performance measure will be reached. Following this process can also reveal where policy options are counterproductive, diminishing the performance in other parts of the system.
An example that distinguishes between these two approaches is emissions from private automobiles. The “inside out” approach is exemplified by technology mandates such as CAFE standards, in which a performance measure for a part of the physical system – average emissions by the fleet of vehicles – was targeted directly for improvement, with the final performance target explicitly set. The other approach, from the “outside in” would be the different types of behavioral change policies that have intended to reduce the aggregate number of vehicle kilometers traveled. These are policies such as car sharing or congestion pricing, in which the policies are generally conceived first on the outer policy sphere, with a less precise idea how it will work through the physical system.
Regardless of the approach taken, the insights from Step 6, in which we identified areas of high-impact emergent behavior, will be extremely important. Even for policies that are narrowly targeted on specific subsystems or components, the systemic impacts of all policies need to be considered.
Step 8: Flag Important Areas of Uncertainty
A parallel activity to the identification of options for system performance improvements is to look for the uncertainty in the performance of the CLIOS, both at the subsystem and the CLIOS-wide level. In identifying the important uncertainties, one must rely on the insights gained in Step 5, in which we looked for chains of strong interactions, areas of conflict between policy organizations, or emergent behavior from positive feedback loops. For example, such signals included individual links or loops that had large magnitude, fast-moving, non-linear or irreversible influences on other components within the system.
The “common drivers” are another key source of uncertainty. Common drivers such as GDP and population can be highly uncertain in their long-term trends, and their overall impact on the CLIOS may be counterintuitive at times. Since these factors can simultaneously influence different subsystems in very different ways, the overall impact of the common drivers can be difficult to ascertain without systematically tracing through the CLIOS at each layer. These common drivers can have a particularly strong influence on the physical system when one considers the longer-run evolution of the CLIOS. For example, whether the Mexican economy grows only gradually, with many sharp downturns, or suddenly takes off, can radically influence the entire CLIOS through changes in demand for goods and services, including transportation and energy, levels of investment available, changes in land use patterns, supply and demand for different types of technologies, and the relative value placed on the environment and economic growth.
Finally, in flagging important areas of uncertainty, we should also highlight the “openness” of the system, and analyze the impact of these external factors, such as
macroeconomic growth, international fuel prices, and national and international political trends that link the CLIOS to a even broader system.
Scenario Planning
One methodology for identifying key uncertainties and understanding their impact on the CLIOS is scenario planning, a tool developed by Royal Dutch/Shell in the years leading up to the oil shocks of the 1970s. Ged Davis (the current head of Shell’s Scenarios Team) defines
scenarios as “coherent, credible stories about alternative futures” (Davis, 2002). Scenarios are used in the corporate context to make decisions in a complex and uncertain environment by fostering a new way of thinking about the future. While scenario planning has continued to evolve within Shell, becoming an integral part of Shell’s strategic planning process, it has also found applications in a wide range of contexts besides corporate strategy.
impact of key uncertainties, including common drivers such as economic growth, population shifts, and rates of technological change. The basic steps for developing scenarios are: 10
Identify the focal issue or decision
o Similar to Step 1 of the CLIOS Analysis Identify the primary "driving forces"
o Including social dynamics, economic issues, political issues, and technological issues – often the “common drivers” of the CLIOS
Develop the scenario “logics”
o How these “driving forces” are intertwined, and what are the different paths they could follow
Flesh out the scenarios into coherent narratives or “stories”
Explore the implications of the scenarios for the decisions/focal issues identified earlier. In the context of CLIOS, the easiest approach for scenario building would be to develop several combinations of trends in the common drivers, and explore the implication of scenarios based upon these “logics.” However, a more meaningful set of scenarios would link the CLIOS to the broader environment – an important point, considering that CLIOS are “open” systems, and the most significant uncertainties may come from “outside” the CLIOS. Therefore, one would look beyond the common drivers, perhaps to identify the external forces that influence the common drivers – forces such as international trade regimes, societal attitudes, environmental movements, and many others.
Scenario planning may be an important tool not only to identify and understand key uncertainties, but also to evaluate the performance of options across uncertainties, as discussed in the next step.
Step 9: Evaluate Options and Select Robust Ones that Perform “Best” Across Uncertainties
When evaluating options, robustness comes from the ability of an option to perform reasonably well under different “scenarios” of the future.11 This represents a different approach than that of identifying an optimal strategy, which may only perform optimally under a
constrained set of conditions. In fact, we would argue that achieving “optimal performance” is an unrealistic goal for a CLIOS. Given the range of performance measures involved, different stakeholder views, and trade-offs needed to obtain the necessary support to begin implementing an option, simply finding an option that “works” may be the best expectation.
One manner of representing robustness is with a matrix, where the columns represent different scenarios (which may be combination of common drivers that tell a “story” about the
10 The scenario planning concepts discussed here were developed by scenario planners such as Schwartz (1996) and Wack
(1985). For a discussion of the extension of scenario planning to regional transportation planning, see Sussman and Conklin (2001).
11 This section draws heavily upon scenarios developed for the Integrated Program on Urban, Regional and Global Air Pollution:
The Mexico City Case Study. These three scenarios for the future of the MCMA include both qualitative and quantitative factors ranging from economic growth and stability, income inequality, and changes in urban form to civic participation and
economic, demographic, political future of Mexico City) and the policy strategies that combine options are rows, then we can see how the strategies perform compared across a range of futures.
Scenario 1 Scenario 2 Scenario 3
Option 1 + − +
Option 2 + + +
Option 3 0 0 +
In the case where you have a positive value in each of the scenarios (Option 2, for example) then the strategy is robust, and will perform well across all futures. In this case, the choice is straightforward. However, if choosing between Option 1 and 3, this would depend upon the desire to avoid negative outcomes, in which case Option 3 would be preferable, even though Option 1 performs well in two out of the three scenarios. In further developing and refining strategies, the focus should be upon combining options that can make strategies more robust across the entire set of possible futures.
Implicit in this discussion, is that the formulation of performance measures and the evaluation of policy options will require some modeling and quantitative analysis. Most of the quantitative modeling will focus on specific parts of the system; for example, policies to change passenger transportation mode share in Mexico City. However, while a focused quantitative analysis may be necessary for better characterizing certain options, understanding how those options impact the rest of the system, in a qualitative manner, is an essential part of the evaluation of options.
Therefore, an evaluation of an option might be presented in two parts, the first of which might be an engineering-based or benefit-cost analysis. The second part outlines the impacts on (1) other aspects of the same subsystem layer, (2) other subsystems, and (3) the actors on the policy sphere. This last step will also set the stage for the implementation phase of the CLIOS analysis, as described below.
I
MPLEMENTATIONStep 10: Strategy for Implementation
Once a set of “promising” policy options are identified, the next crucial (but often overlooked) step in the analysis is to develop a strategy for implementation. Many policy
analyses come to an end at Step 9, with a set of recommendations, with little guidance as to what obstacles might arise in the implementation of these recommendations. In the CLIOS analysis, identifying a strategy for implementation requires taking the set of “best performing” options and identifying combinations (a portfolio) of policy options that fit together in a comprehensive strategy. By combining options, one may accomplish two primary goals:
• Mitigate/compensate for negative impacts: Given the interconnectedness of the system, improvements along one dimension of performance may degrade performance in other areas of the system. Therefore, one should look for options that can either attenuate those
might not have made the initial “cut” in Step 9).
• Improve the robustness of the options: Given the uncertainties in the individual options, finding certain combinations of options can provide “insurance” against extreme changes or shocks to the systems. In particular, combinations of options can insulate the strategy from major shifts in the common drivers. For example, a certain option aimed at private automobiles may be highly sensitive to changes in household income levels, and might perform poorly in periods of extremely high or low economic growth. However, if we find that investments in public transportation seem to be less sensitive to economic growth, it may be that this option, in conjunction with the option aimed at private autos, provides a more dependable, if not necessarily an optimal outcome.
In working toward both of these goals, it is important to focus on performance measures. Neglecting certain performance measures, especially those measures which are highly valued by certain actors on the policy sphere, can make the strategy vulnerable to strong resistance from groups that feel that their interests are threatened by these options. This highlights another key task in developing a strategy for implementation, which is the use of the CLIOS representation to identify who is going to implement and enforce what option, as well as who has the potential to impede its implementation. By looking along the policy sphere, to assess how each option impacts their interests, one can look for both the “winners” and “losers” from certain actions. Then, returning to the issue of mitigation or compensation, one can begin to build coalitions by creating more winners than losers.
Step 11: Identify Opportunities for Institutional Changes and Architecture
The structure of the policy system may make certain policies intended to bring about a change in the physical system either more or less feasible. For this reason, we consider Step 11 to be a parallel activity to Step 10, with institutional changes and architecture explicitly being a central part of the overarching strategy for implementation. Here, we define the CLIOS
architecture as a methodology for designing organizational interactions among the institutions
on the policy sphere of the CLIOS that “manage” the physical system.12 Therefore, part of Step
11 should be to evaluate the institutional arrangements that govern the management of the CLIOS. We suggest that this is one of the strengths of the CLIOS framework – that the analysis can be used to inform the development of an institutional architecture that is better able to
support a well-functioning physical and technical architecture.13
Returning to the concept of nested complexity, this concept is central to the CLIOS analysis for several reasons. First, by separating the policy sphere from the rest of the “system,” primarily the physical systems, we draw attention to the fact that the policy system is a complex
12 This definition is adapted from Sussman and Conklin (2001), where a regional architecture is defined “as a methodology for
designing organizational interactions among the various agencies and private-sector firms that would participate in providing transportation services of any type at a regional scale.” Indeed, one can consider a regional architecture as a special case of an architecture, where the CLIOS is a regional transportation system.
13 The concept of developing an institutional architecture in parallel with a technical architecture comes from the RES/SITE work