HAL Id: inserm-00819676
https://www.hal.inserm.fr/inserm-00819676
Submitted on 2 Aug 2013HAL is a multi-disciplinary open access archive for the deposit and dissemination of sci-entific research documents, whether they are pub-lished or not. The documents may come from teaching and research institutions in France or abroad, or from public or private research centers.
L’archive ouverte pluridisciplinaire HAL, est destinée au dépôt et à la diffusion de documents scientifiques de niveau recherche, publiés ou non, émanant des établissements d’enseignement et de recherche français ou étrangers, des laboratoires publics ou privés.
White adipose tissue overproduces the lipid-mobilizing
factor zinc α2-glycoprotein in chronic kidney disease.
Caroline Pelletier, Laetitia Koppe, Marine Croze, Emilie Kalbacher, Roxane
Vella, Fitsum Guebre-Egziabher, Alain Geloen, Lionel Badet, Denis Fouque,
Christophe Soulage
To cite this version:
Caroline Pelletier, Laetitia Koppe, Marine Croze, Emilie Kalbacher, Roxane Vella, et al.. White adipose tissue overproduces the lipid-mobilizing factor zinc α2-glycoprotein in chronic kidney disease.. Kidney International, Nature Publishing Group, 2013, 83 (5), pp.878-86. �10.1038/ki.2013.9�. �inserm-00819676�
White adipose tissue overproduction of the lipid mobilizing factor
zinc alpha2-glycoprotein (ZAG) in chronic kidney disease
Caroline C. PELLETIER, MD, M.Sc1,2,3,*, Laetitia KOPPE, MD, M.Sc1,2,3,*, Marine L. CROZE, M.Sc1,2, Emilie KALBACHER, MD, M.Sc 1,2,3, Roxane E. VELLA, M.Sc1,2, Fitsum GUEBRE-EGZIABHER MD, PhD1,2,3, Alain GELOEN, PhD1,2, Lionel BADET MD, PhD1,4 , Denis FOUQUE MD, PhD 1,2,3, and Christophe O. SOULAGE, PhD1,2
1 Université de Lyon, F-69600, Oullins, France ;
2 INSERM, U1060, CarMeN, INSA-Lyon, Univ. Lyon-1, F-69621, Villeurbanne, France
3Hospices Civils de Lyon, Service de Néphrologie, Hôpital E Herriot Lyon, F-69003, France. 4Hospices Civils de Lyon, Service d’Urologie, Hôpital E Herriot Lyon, F-69003, France.
* CC Pelletier and L Koppe contributed equally to this work
Running title: ZAG overproduction in uremia
Corresponding author: Dr Christophe O. SOULAGE
CarMeN, Cardiovasculaire, Métabolisme, diabétologie et Nutrition Bâtiment IMBL,
INSA-Lyon, 20 avenue Albert EINSTEIN 69621 VILLEURBANNE cedex FRANCE Tel : +33 4 72 43 81 96 Fax : +33 4 72 43 85 24 E-mail : christophe.soulage@insa-lyon.fr Word count : 4628
Abstract
(227 words)Chronic kidney disease (CKD) is frequently associated with protein energy wasting which has been recognized as a strong predictive factor of mortality. Zinc α2-glycoprotein (ZAG) has been proposed as a new adipokine involved in body weight control through its lipid mobilizing activity. We hypothesized that the uremic environment in CKD could alter ZAG production by white adipose tissue and contribute to CKD-associated metabolic disturbances. ZAG protein was quantified in 3T3-L1 adipocytes after incubation with plasma from healthy volunteers and CKD patients (20%, v/v). ZAG was also measured in white adipose tissue (WAT) from 5/6 nephrectomized rodents (Nx5/6) and subcutaneous adipose tissue biopsies from end-stage renal disease patients. Uremic plasma induced a significant increase in ZAG synthesis in 3T3-L1 adipocytes (+124%, p<0.001), associated with an increased basal lipolysis (+31%, p<0.01) and a blunted lipogenesis (-53%, p<0.05). In vivo, Nx5/6 rats and mice exhibited a significant decrease in WAT accretion (-44%, p<0.01 and -43%, p<0.005, respectively) and a higher content of ZAG protein in WAT than control (+498%, p<0.05 and +106%, p<0.01 respectively). Human WAT biopsies from CKD patients exhibited a higher content of ZAG (+573%, p<0.05) than age matched control. This study demonstrated for the first time that ZAG protein content is increased in white adipose tissue from CKD patients or animal models. Overproduction of ZAG in CKD could be a major contributor to dysmetabolism associated with CKD.
Keywords: chronic kidney disease, zinc α2-glycoprotein, ZAG, white adipose tissue, lipolysis,
Introduction :
Chronic kidney disease (CKD) is characterized by non specific metabolic disturbances as protein-energy wasting (PEW) (1), insulin resistance and dyslipidemia (2,3). Despite improved treatments and nutritional support, all of these are still responsible for high mortality rate, mostly from cardiovascular events (4,5). Several causes of CKD-associated dysmetabolism have been identified, including acidosis, inflammation and oxidative stress (6– 8) but the pathogenesis remains unclear. White adipose tissue (WAT) is an endocrine organ since it releases a large number of bioactive compounds called adipokines. Their endocrine or paracrine activities contribute to the regulation of energy balance, inflammatory response and could play a key role in the etiology of uremia-associated insulin resistance and cachexia (9– 11). Zinc α2-glycoprotein (thereafter referred to as ZAG) is a 43 kDa glycoprotein isolated from human plasma (12,13). ZAG is secreted in large amount by WAT but also by epithelia cells from liver, breast, gastrointestinal tract as well as sweat glands (14). ZAG has attracted extensive researches since it acts as a lipid-mobilizing factor. Clinically, ZAG is overexpressed in some malignant tumors and is strongly associated with the loss of adipose tissues in cancer cachexia (15–17). In contrast, expression of ZAG is rather low in obese rodents and obese human subjects and negatively correlated with body fat mass (18,19). Russel et al (2004) successfully used ZAG injections to reduce body fat and body weight in mice (20). Indeed, ZAG displays both lipolytic and antilipogenic effects on WAT (19,21,22) and it promotes lipolysis through an interaction with β3-adrenoreceptors (20,21,23). Body fat loss appears to be due to the lipolytic effects of ZAG, in combination with an up-regulation of UCP-1 in brown adipose tissue, increasing thermogenesis and lipid utilization (22). CKD and more especially end-stage renal disease are associated with increased plasma concentration of most adipokines (24). These increases are traditionally thought to result from passive accumulation due to a decreased renal clearance (25). Recent data however challenged this view since two independent studies demonstrated that uremic plasma induces an upregulated secretion of leptin by adipocytes (26,27). Presently few data are available on ZAG metabolism in CKD. Two studies recently showed an increase of ZAG plasmatic level in
haemodialysis patients, suggesting a defect of its renal clearance (28,29). In good agreement, uremic sera from CKD stage 5 patients stimulate basal lipolysis in cultured human adipocytes (30).
We therefore hypothesized that CKD could be associated with an overproduction of ZAG in WAT which could in turn induce CKD-associated metabolic disturbances and particularly loss of body fat mass. The aim of the present study was to explore the effect of CKD on cellular ZAG content in WAT. To this end, 3T3-L1 cultured adipocytes were exposed to uremic plasma and ZAG content was measured by Western blotting (WB). ZAG content was also measured in WAT from CKD rodent models as well as CKD stage-5 patients.
Results :
Patient data.
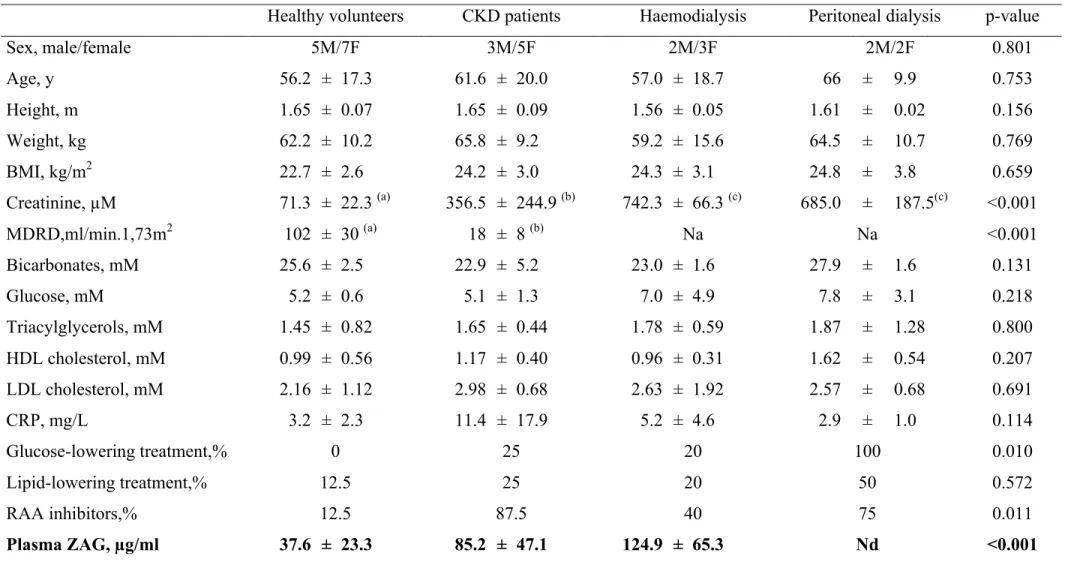
Clinical and biological characteristics of healthy volunteers (HV), chronic kidney disease (CKD), haemodialysis (HD) and peritoneal dialysis (PD) patients are summarized in Table 1. As expected, plasma creatinine and renal function were the only significant differences between the groups. ZAG was quantified by enzyme immunoassay in individual plasmas. ZAG plasma concentration was 2-fold higher in CKD patients as compared with healthy volunteers (Table 1) (+226%, n=8, p<0.05). Pre and post-dialysis patients also exhibited further increases in ZAG plasma concentration. The mean plasma ZAG concentration was 125 ± 65 µg/ml before and 145 ± 43 µg/ml after haemodialysis session (+18%, p<0.05).
Uremic plasma pool increases ZAG protein content in 3T3-L1 adipocytes.
3T3-L1 adipocytes were incubated for 16h with HV, CKD, HD or PD human plasma pools and ZAG content was measured using WB (Figure 1A,B). Incubation of 3T3-L1 adipocytes with CKD and HV pools slightly decreased cell viability as measured by MTT and LDH assay (Supplementary Table 1). The presence of ZAG in control 3T3-L1 cells was almost undetectable while treatment with CKD pool induced a significant increase in ZAG content as
compared with HV pool (+124%, p<0.001). Incubation with HD pools yielded a similar increase of ZAG content (+143%, p<0.001) in adipocytes while incubation with PD pool had no effect (Figure 1B). Since heparinized plasma activates lipoprotein lipase which itself could interfere with ZAG production, we compared the effects on 3T3-L1 adipose cells of plasma and serum from the same CKD stage 5 patients. Of note, plasma and sera pools yielded similar increase in ZAG content excluding such effect (Supplementary Figure 1). Urea at a concentration chosen to mimic uremia (30 mM) did not elicit any increase of ZAG in 3T3-L1 adipocytes. To get further insight into the molecular effect of CKD plasma pool on cellular ZAG content, plasma were heat-inactivated (heat-shock, 65°C for 30 min) or fractionated by ultrafiltration (Figure 1C). Heat denaturation did not significantly alter ZAG production in adipocytes neither for HV nor for CKD pools. Ultrafiltration of the CKD pool with a 10 kDa cut-off dialysis membrane, triggered ZAG overproduction in 3T3-L1 cells while the ultrafiltrate (ie. compounds <10kDa) did not elicit any ZAG overproduction. Taken together these results suggest that the “stimulating factor” is not a protein (since it resists to heat denaturation) but possess a MW higher than 10kDa or is tightly bound to plasma proteins. We therefore performed incubations with two prototypical representatives of the protein-bound uremic toxin family, p-cresyl-sulfate and indoxyl-sulfate. p-cresyl-sulfate and indoxyl-sulfate, at concentrations chosen to mimic the levels encountered in end stage renal disease (www.eutox.org), did not elicit any change in ZAG content, as compared with K2SO4. (data
not shown). Experiments with acidosis (evaluated with culture medium adjusted pH 7.0) yielded similar negative result on ZAG content (data not shown). Since an elevation of ZAG content may affect lipolytic activity of adipocytes, lipolysis was measured in basal conditions as well as under isoproterenol stimulation (Figure 2). Treatments with CKD and HD plasma pools triggered an increase of basal lipolysis (+30%, p<0.001) compared to HV plasma pool. In contrast, isoproterenol-induced lipolysis was slightly reduced by HV, CKD and HD pool treatments. Incubation of 3T3-L1 cells with HV pool did not alter lipogenesis while incubation with CKD or HD pool significantly decreased lipogenesis (-50%, p<0.05) compared to HV pool.
ZAG white adipose tissue content is increased in animal models of CKD.
To confirm these in vitro results, WAT ZAG content was measured in rodent models of CKD induced by 5/6 nephrectomy in rats and mice. Nephrectomized rats (Nx5/6) were compared to sham-operated pair-fed rats (SO). The main features of renal function and biometric data of SO and Nx5/6 rats are shown in Supplementary Table 2. Nx5/6 rats exhibited an elevated plasma urea concentration (+156%, p=0.03), a higher proteinuria (+650%, p=0.001) and a significant decrease in white adipose tissue accretion (-44%, p=0.006) compared to SO rats. As shown in Figure 3A, WB analysis of epididymal WAT evidenced a dramatic increase in ZAG content in the Nx5/6 rat WAT as compared to SO rats (+598%, p<0,02). That finding demonstrates that renal impairment increases ZAG content in WAT. Using linear regression analysis, we found a positive correlation between ZAG tissue content and proteinuria (Figure
3B, p=0.001) and a negative correlation with total WAT weight (Figure 3C, p=0.006)
suggesting that ZAG, through its lipolytic and antilipogenic actions, could contribute to fat mass loss. Fat mass loss was associated in Nx5/6 rats with ectopic lipid redistribution in muscle, as evidenced by the measurement of gastrocnemius total lipid content (Figure 3D, p=0.002) and liver (data not shown). ZAG is rather low in WAT from obese rodents and obese human subjects (18,19). The effects of nephrectomy on ZAG tissue content was therefore tested in mice fed a high fat diet (HFD) to test the effects of increased fat deposition. Biometric data for these animals are shown in Supplementary Table 3. All nephrectomized mice exhibited an elevated plasma urea concentration (+191%, p<0.001) compared to SO mice. Regardless of renal function, mice fed a HFD exhibited a striking increase in fat deposition when compared to mice fed a standard diet (Figure 4A). Nephrectomized mice however exhibited a blunted fat accretion when compared to SO mice. ZAG adipose tissue content was strikingly increased in WAT from Nx5/6 mice fed a standard diet as well as in mice fed a HFD (Figure 4B) compared to their respective controls. Thus, renal insufficiency is able to trigger ZAG overproduction in adipose tissue of lean as well as obese animals.
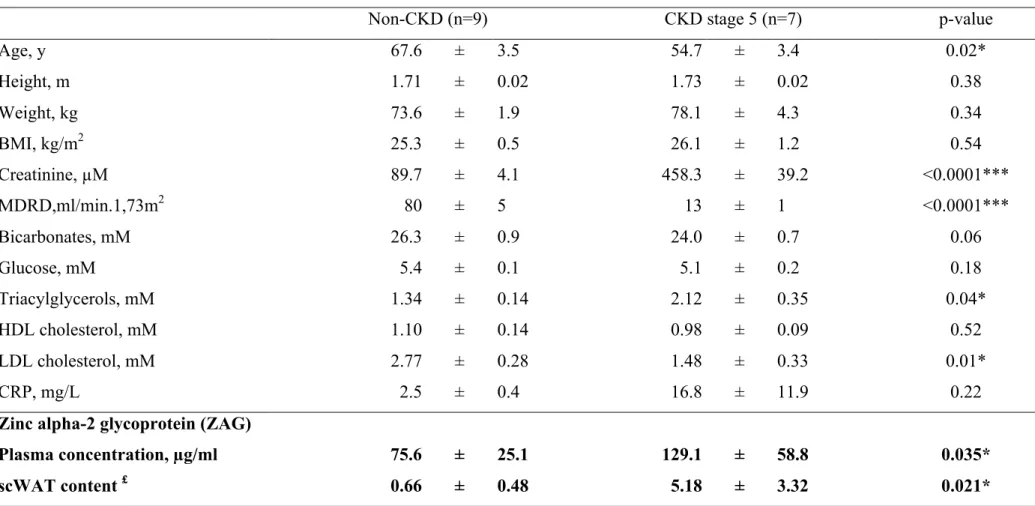
Experimental study in rats and mice indicated that ZAG content was increased by renal impairment; we therefore aimed to assess ZAG content in WAT from CKD patients. Seven stage-5 CKD patients and nine non-CKD patients were recruited from an ongoing study to perform surgical subcutaneous WAT biopsies. To rule out potential selection biases that may contribute to disturb WAT metabolism, evidences of inflammation, cancer diseases, acidosis, diabetes or obesity were considered as exclusion factors. Baseline characteristics of patients are summarized in Table 2. ZAG plasma concentration was measured by enzyme immunoassay method. As expected, a higher plasma concentration of ZAG was noticed in CKD stage-5 patients compared to non-CKD patients (+71%, n=7-9, p=0.04). CKD patients exhibited a higher ZAG content in abdominal subcutaneous WAT than the non-CKD patients (+573%, n=7-9, p=0.03) (Table 2, see Supplementary Figure 2 for typical blots). Plasma ZAG concentration was further compared in non-CKD and CKD overweighed/obese patients (BMI>30kg.m-2) (Table 3). A higher plasma concentration of ZAG was noticed in CKD stage-5 obese patients compared to non-CKD obese patients (+184%, n=7-8, p<0.005). The ZAG protein white adipose tissue content was analyzed by western blotting in one obese CKD stage-5 patient compared to one non-CKD obese patient (see Supplementary Figure 3). In good agreement with animal studies, ZAG/ Tubulin ratio was strongly increased (+ 633%) in WAT from CKD obese patient compared to non-CKD obese patient (ZAG/Tubulin ratio: 0.89 and 6.53 for non-CKD and CKD, respectively).
Discussion :
We report in the present study that uremic plasma increases ZAG protein production in 3T3-L1 adipose cells. The clinical relevance of this finding is further confirmed by the observation of increased WAT content of ZAG in CKD animal models as well as in subcutaneous white adipose tissue from CKD Stage 5 patients. These data offer a novel insight into the possible mechanisms of CKD associated metabolic disturbances such as dyslipidemia and protein energy wasting. In good agreement with the study by Philipp et al. in hemodialysis patients (28), the CKD patients included in the present investigation exhibited a marked elevation of plasma ZAG concentration (two-fold, p<0.05) that was also observed in
haemodialysis patients. Incubation of 3T3-L1 adipose cells in the medium containing plasma from the CKD patients significantly increased intracellular ZAG protein content compared to that found with plasma from HV. This increase is mainly due to a neo-synthesis of ZAG protein since it is abolished by the use of a protein synthesis inhibitor such as cycloheximide (data not shown). This observation suggests that increased plasma concentration of ZAG reported in CKD could, at least in part, be due to an increased production and secretion as opposed to the decrease of its renal clearance (28,31). To get an insight into the mechanism of uremic plasma induced ZAG production, plasma pool were heat inactivated (30 min, 65°C) or fractionated by ultrafiltration (cutoff : 10kDa). Aminzadeh et al (26) reported that uremic plasma induces an exuberant secretion of leptin and that plasma TNF-alpha is involved in this process. However, most cytokines are rapidly inactivated during heat shock (i.e. temperature >50-60°C) excluding that the stimulatory factor of ZAG production being a pro-inflammatory cytokine. Supporting this view, overnight incubation of 3T3-L1 adipose cells with two common inflammatory cytokines TNF-alpha and interleukin-6 did not elicit any change in ZAG content (Supplementary Figure 4). In vitro ultrafiltration study indicated that the “stimulating factor” had a high MW (>10kDa) or was tightly bound to plasma proteins. To test this hypothesis, 3T3-L1 cells were incubated with plasma extensively dialyzed through cellulose membrane (MWCO: 8 kDA) to remove low MW compounds (see Supplementary
Figure 5). Dialyzed plasma from CKD did not significantly alter ZAG production compared
to HV plasma suggesting that “stimulating factor” could be a small protein-bound uremic toxin. In good agreement, ultrafiltrate collected from one CKD patient undergoing ultrafiltration to treat fluid overload also failed to trigger ZAG production in 3T3-L1 adipose cells confirming that “stimulating factor” was either high MW or tightly bound to plasma proteins (see Supplementary Figure 6). Taken together, these data indicate that “the stimulating factor (s)” belong(s) to the group of protein-bound uremic toxin(s) with molecular weight(s) <8 kDa. Further studies and fractionation techniques are however needed to decipher the exact molecular nature of the stimulating compound(s). Plasma for haemodialysis patients elicited similar increase in ZAG content in adipose cells suggesting that the “stimulating factor” was not removed by the haemodialysis process. In contrast, plasma from peritoneal dialysis patients did not elicit any change in ZAG content (Figure
1B). This observation desserves some comments. Because of their strong protein binding,
protein-bound toxins are poorly removed by classical hemodialysis strategies, even using large pore dialysis membranes (32). In contrast with hemodialysis (an intermittent dialysis strategy), peritoneal dialysis is characterized by slow but continuous removal of solutes.
Peritoneal dialysis is also associated with a peritoneal loss of albumin and an improved preservation of residual renal function. While clearance of protein-bound solutes was greater in hemodialysis patients than in those on peritoneal dialysis, paradoxically the plasma concentration of these protein-bound solutes was lower in patients on peritoneal dialysis than in those on hemodialysis (33,34). As an example, Pham et al (34) reported that the total concentration of p-cresyl sulfate, the prototype member of protein-bound uremic toxins, was lower in anuric patients on peritoneal dialysis than in those on hemodialysis. The discrepancy between the higher blood concentration and higher clearance of protein-bound solutes in patients on peritoneal dialysis compared with patients on hemodialysis is currently unexplained, but differences in intestinal generation or metabolism of these solutes could be involved (35). These observations support the fact that the stimulating factor(s) could be a protein-bound coumpound(s).We cannot however exclude that physiologic and/or metabolic differences in these patients should underlie the absence of effect of PD plasma on 3T3-L1 cells. This issue will however deserve further researches.
We demonstrate for the first time that ZAG protein content was strikingly increased in white adipose tissue from Nx5/6 rodents or stage 5 CKD patients. We failed to find a significant correlation between adipose tissue ZAG protein level and plasma concentration of ZAG in CKD Stage 5 patients (r2=0.03, p=0.843). In good agreement, the measurement of arterio-venous differences in human showed that there was no significant contribution of WAT to the circulating levels of ZAG (36). In this study, in obese subjects, ZAG secretion from WAT increased significantly whereas serum levels remained unaltered. ZAG is therefore released from human WAT, but this tissue does not contribute significantly to the circulating levels. ZAG could therefore be regarded as a “local factor” in adipose tissue exerting its catabolic action mainly through autocrine and/or paracrine activity. ZAG displays both lipolytic and antilipogenic effects on white adipose tissue (19,21,22,37). ZAG has been shown to promote lipolysis through an interaction with β3-adrenoreceptors (21,23) and upregulation of lipolytic enzymes (19). On the other hand, ZAG downregulated expression of major lipogenic enzymes such as fatty acid synthase (FAS) or acetyl-coA carboxylase (ACC) in white adipose tissue (19) or liver (37). Nephrectomized rats exhibited a significant loss of total WAT mass and we noticed a negative correlation between ZAG tissue content and WAT weight suggesting that
ZAG, through lipolytic and/or antilipogenic actions, could contribute to fat mass loss. CKD results in marked down regulation of lipoprotein lipase and VLDL receptor in adipose tissue and skeletal muscle (38–40). The CKD-induced LPL and VLDL receptor deficiencies significantly contributes to the reduction of fat tissue mass by limiting the uptake of fatty acids from chylomicrons and VLDL and their re-esterification and storage as triglycerides. Therefore, elevation of ZAG compounds the effects of LPL and VLDL receptor deficiencies in CKD by promoting lipolysis and inhibiting fatty acid synthesis. Zhao et al (41,42) reported that 10 month-old uni-nephrectomized rats exhibit a progressive loss of well-differentiated white adipose tissue associated to ectopic lipid deposition. Moreover, uninephrectomized rats exhibited several metabolic disturbances such as hyperlipidemia (elevation of fasting serum total cholesterol, triglyceride, LDL-cholesterol and HDL-cholesterol), fasting hyperglycemia and insulin resistance. Blunted lipogenesis and/or increased lipolysis could promote lipid redistribution in the body leading to lipotoxicity. Recently, Axelsson et al (30) reported that uremic serum stimulated basal lipolysis in human preadipocytes. Our study in 3T3-L1 yielded very similar results suggesting that increased plasma ZAG concentration could be central for the effect observed on lipolysis. Supporting the notion that ZAG could be also responsible for metabolic disturbances, Philipp et al. reported that ZAG serum levels negatively correlated with fasting insulin and homeostasis model assessment of insulin resistance (HOMA-IR) (28). In a preliminary report Olofsson et al. noticed that ZAG serum levels correlated with serum levels of cholesterol in healthy subjects and during weight loss (43). Thus, as reported in cancer patients (44), ZAG could be a major lipid mobilizing factor and may contribute to the main CKD-associated metabolic disturbances.
In conclusion, as summarized in Figure 5, we demonstrate for the first time that ZAG protein content is increased in white adipose tissue from CKD patients or CKD animal models. Our data suggest that uremic sera contain a protein-bound small MW factor (or factors) that stimulate(s) ZAG production by adipocytes. While our results are relevant to understand the metabolic disturbance in CKD patients, we did not identify the exact molecule in uremic plasma that mediates ZAG overproduction in adipose tissue. Our results demonstrate the
importance of ZAG overproduction in CKD, through increased lipolysis and decreased lipogenesis, which could be a major contributor to dysmetabolism associated with CKD.
Methods :
Human subjects.
Twelve healthy adult volunteers, eight non dialyzed CKD patients (renal disease: 3 nephroangiosclerosis, 2 diabetes mellitus type 2, 1 polycystic disease, 1 glomerular sclerosis and 1 uropathy), five patients maintained on haemodialysis for a minimum of one year, and 4 peritoneal dialysis patients matched for age, gender and body mass index (BMI) were recruited at the University hospital in Lyon, France. Haemodialysis (hemodiafiltration) therapy was performed three times weekly during four hours. Mean dialysis time was 12.38 ± 0.75 hour/week and hemodialysis patients exhibited an equilibrated Kt/V of 2.07 ± 0.23. Peritoneal dialysis patients exhibited a total Kt/V of 2.20 ± 0.07 per week (see
Supplementary Table 4 for clearance results). After an overnight fast, blood samples were
obtained by venipuncture, except for dialysis blood samples that were obtained immediately before and after dialysis from mechanical bloodstream. Blood samples were centrifuged at 3500 × g for 10 min to isolate plasma supernatant which were snap frozen in liquid nitrogen and stored at -20°C until use. Creatinine clearance was calculated using the Modification of the Diet in Renal Disease formula (MDRD). In a second experiment, seven CKD patients stage 5 and nine non CKD patients were recruited from an ongoing study to perform subcutaneous adipose tissue biopsies. Biopsies (2-3 g) were performed during elective surgery (peritoneal dialysis catheter for CKD patients and radical prostatectomy for non CKD patients), snap frozen in liquid nitrogen and stored at -80°C until use. In an additional experiment, twelve non-CKD and eight CKD stage 5 overweighed/obese patients (BMI>30 kg.m-2) were recruited from an ongoing study to plasma ZAG immunoassay and 2 to perform subcutaneous adipose tissue biopsies. The local ethical committee (CPP Lyon Sud-Est IV,
study “MODAIR”, ref D-09-17) approved these studies and written informed consent was obtained from each subject.
Animal study.
Male Wistar rats weighing 275-300 g were obtained from HARLAN (Gannat, France) and housed in individual cages in a temperature and humidity controlled room with a 12 h light/dark cycle. The animals were allowed free access to water and standard laboratory diet. Animals were randomly divided into two groups: sham-operated (SO) and nephrectomized (Nx5/6). Animal experiments were performed under the authorization n°69-266-0501 (CarMeN lab, Direction Départementale des Services Vétérinaires du Rhône), All experiments were carried out according to the guidelines laid down by the French Ministère de l’Agriculture (n° 87-848) and the E.U. Council Directive for the Care and Use of Laboratory Animals of November 24th, 1986 (86/609/EEC). After anaesthesia with sodium pentobarbital (35 mg/kg ip) and chlorpromazine (5 mg/kg ip), rats underwent surgical 5/6 renal mass reduction in two stages or sham operation. Animals were given morphine chlorhydrate (6 mg/kg ip) three times a day for 2 days to manage post-operative pain. Since uraemia could result in significant changes in food intake, SO rats were pair fed with Nx5/6 animals to prevent difference in feeding behaviour and eliminate animal weight as a variable in this study. Ten weeks after surgery, rats were deeply anesthetized with sodium pentobarbital (60 mg/kg ip). Blood was withdrawn on heparinized syringe from puncture of the vena caeva. Blood samples were centrifuged at 3500 × g for 10 min to isolate plasma supernatant which were snap frozen in liquid nitrogen. Epididymal (eWAT), retroperitoneal (rWAT) and subcutaneous inguinal (scWAT) white adipose tissue were dissected out according to anatomical landmarks, weighted and snap frozen in liquid nitrogen for ZAG immunodetection. The muscle and hepatic lipids were extracted using Chloroform-Methanol (2:1, v/v) and total lipid content was estimated gravimetrically.
Mouse 3T3-L1 fibroblasts were obtained from the American Type CultureCollection (CL-173; ATCC, LGC Standard SARL, Molsheim, France). Cells weregrown in 12-well plates in Dulbecco’s modified Eagle’s medium (DMEM) containing 25 mM D-glucose, 4 mM glutamine, 25 mM Hepes buffer (GlutaMAX, Invitrogen, Illkirch, France) and supplemented with 100 IU/ml penicillin, 100 µg/ml streptomycin, and 10% (v/v) heat inactivated (30 min, 56°C) foetal calf serum (Sigma Aldrich). Cultures were maintained at 37°C in a water-saturated atmospherecontaining 5% (v/v) CO2. Adipocytes were studied 10-12 days after
differentiation, which was induced by insulin (0.8 µM), IMBX (0.5 mM), dexamethasone (25 nM) and rosiglitazone (10 µM). Plasma from healthy volunteers, CKD, haemodialysis (HD) and peritoneal dialysis (PD) patients were pooled in equal amounts and thereafter referred to as « Healthy Volunteer pool », « CKD pool », « HD pool » and « PD pool », respectively. Adipocytes wereincubated for 16h in culture medium containing 20% (v/v) foetal calf serum as control conditions, 20% (v/v) foetal calf serum with 30 mM urea or 20% (v/v) of each human plasma pools. At the end of the incubation period, the culture mediums were removed and snap frozen in liquid nitrogen. Cells were rinsed with ice cold PBS, frozen and stored at -20°C until measurements. Similar 16h incubations of adipocyte cultures were performed with uremic toxins according to the recommendations of the European Uremic Toxin Work Group (EUTox, www.eutox.org) (32) (namely 40µg/ml of p-cresyl-sulfate and 60µg/mL of indoxyl-sulfate) as compared with potassium sulfate (K2SO4). The effect of acidosis was tested with
culture medium adjuted to pH 7.0 with HCl. In further experiments, aliquot fractions of HV and CKD pool were heat inactivated (for 30 min at 65°C) or fractionated by ultrafiltration using a membrane with a cut-off of 10kDa, before application on cells.
Cells seeded in 96-well plates were treated for 16h under the same conditions as mentioned above. Viability was determined with MTT assay (Cell Proliferation Kit I, Roche, Meylan, France) and with LDH assay (Cytotoxicity Detection kit, Roche) according to the manufacturer’s recommendations.
3T3-L1 adipose cells were scraped and lysed in standard lysis buffer (20 mM Tris-HCL, 138 mM NaCl, 2.7 mM KCl, 1 mM MgCl2, 5% Glycerol and 1% Nonidet P40) supplemented with
protease and phosphatase inhibitors (5 mM EDTA, 1 mM Na3VO4, 20 mM NaF, 1 mM DTT,
Protein inhibitor cocktail, Sigma Aldrich). White adipose tissue was homogenized using a glass/teflon potter in standard lysis buffer then insoluble materials were eliminated by centrifugation (14.000g, 15 min, 4°C). Protein concentrations in plasma and 3T3-L1 cells were determined by Bradford assay (Bio-Rad). Proteins were boiled in Laemmli buffer, separated by SDS-PAGE and transferred onto nitrocellulose membrane. Following saturation with skimmed milk (10% w/v), membranes were probed with primary antibodies, as specified. After incubation with Horse Radish Peroxidase (HRP) coupled secondary antibodies, membranes were processed for chemiluminescence (ECL plus, GE Healthcare) and quantitated by densitometry using Quantity One software (BioRad). Antibodies to ZAG were from Santa Cruz (Ref H-123) and to α-Tubulin from Sigma Aldrich (Ref T6074) Goat anti mouse IgG were from BioRad (Ref 172-1011).
ZAG immunoassay.
ZAG concentrations in human plasmas were determined using a human ZAG enzyme immunoassay purchased from Ray Biotech (Clinisciences, Montrouge, France) according to the manufacturer’s recommendations. The detection limit was 21 pg/ml and intra-assay coefficient of variation was 2.8%. Post-dialysis ZAG concentrations were corrected for hemoconcentration using plasma protein concentrations assayed according to the method of Bradford with bovine serum albumin as standard. The correction was performed using the following equation [ZAG] Corrected = ( [Proteins] pre-HD / [Proteins] post-HD ) x [ZAG] post-HD
with [Proteins] pre-HD, plasma protein concentration before haemodialysis session, [Proteins]
post-HD and [ZAG] post-HD plasma protein and plasma ZAG concentration after haemodialysis
session, respectively.
Lipolysis was measured, in baseline and stimulated (isoproterenol 10µM) conditions as the rate of glycerol release over a 1-h period. Media were collected from the cells and glycerol in culture supernatants was measured by a colorimetric method using glycerol assay kits (R-biopharm, Saint-Didier, France).
Lipogenesis measurement
3T3-L1 adipocytes grown in six-well dishes were incubated for 16h with plasma pools as described above. Lipogenesis was then measured as the incorporation of [14C]-acetate into
total neutral lipids. 3T3-L1 cells were incubated in DMEM medium containing 1% fatty acid-free BSA and 1 µCi of [14C]-acetate for 4 h at 37°C. Total neutral lipids were extracted using Dole's extraction fluid (isopropanol/heptane/H2SO4 1N, 40/10/1, v/v/v) and [14C] was detected
by liquid scintillation counting. Lipogenesis data were normalized by protein concentration estimated using Bradford assay.
Statistics
All data were analysed using GraphPad Prism v5.0 software (Graphpad software, La Jolla, USA) and were expressed as means ± SEM. Results were compared by one-way analysis of variance (ANOVA) followed when appropriate by post-hoc Tukey test. Simple comparisons were performed using Student’s t-test. When appropriate, Welch’s correction for inhomogeneity of variances was applied. Differences were considered significant at the P<0.05 level.
Acknowledgements :
CC. Pelletier held a grant from “Société Française de Néphrologie”, E Kalbacher was recipient of a grant from “Académie de Médecine” and L. Koppe held a fellowship from “Fondation pour la Recherche Médicale”. ML Croze and RE Vella were supported by grants from the French “Ministère de la Recherche et de la Technologie”. This work was supported by INSERM, INSA-Lyon and Fédération Nationale d’Aide aux Insuffisants Rénaux (FNAIR). The authors gratefully acknowledge all patients and healthy volunteers for their participation to this study.
Disclosure
References :
1. Fouque D, Kalantar-Zadeh K, Kopple J, et al. A proposed nomenclature and diagnostic criteria for protein-energy wasting in acute and chronic kidney disease. Kidney Int. 2008; 73: 391–398.
2. Siew ED, Ikizler TA. Determinants of insulin resistance and its effects on protein metabolism in patients with advanced chronic kidney disease. Contrib Nephrol 2008; 161: 138–144.
3. Ritz E, Wanner C. Lipid abnormalities and cardiovascular risk in renal disease. J. Am. Soc.
Nephrol. 2008; 19: 1065–1070.
4. Stenvinkel P, Heimbürger O, Lindholm B. Wasting, but not malnutrition, predicts cardiovascular mortality in end-stage renal disease. Nephrol. Dial. Transplant. 2004; 19: 2181–2183.
5. De Mutsert R, Grootendorst DC, Axelsson J, et al. Excess mortality due to interaction between protein-energy wasting, inflammation and cardiovascular disease in chronic dialysis patients. Nephrol. Dial. Transplant. 2008; 23: 2957–2964.
6. Liu Y, Coresh J, Eustace JA, et al. Association between cholesterol level and mortality in dialysis patients: role of inflammation and malnutrition. JAMA 2004; 291: 451–459.
7. Shoelson SE, Lee J, Goldfine AB. Inflammation and insulin resistance. J. Clin. Invest. 2006; 116: 1793–1801.
8. Himmelfarb J, Stenvinkel P, Ikizler TA, et al. The elephant in uremia: oxidant stress as a unifying concept of cardiovascular disease in uremia. Kidney Int. 2002; 62: 1524–1538. 9. Cheung W, Yu PX, Little BM, et al. Role of leptin and melanocortin signaling in uremia-associated cachexia. J. Clin. Invest. 2005; 115: 1659–1665.
10. Stenvinkel P, Lindholm B, Lönnqvist F, et al. Increases in serum leptin levels during peritoneal dialysis are associated with inflammation and a decrease in lean body mass. J. Am.
Soc. Nephrol. 2000; 11: 1303–1309.
11. Frühbeck G, Gómez-Ambrosi J, Muruzábal FJ, et al. The adipocyte: a model for integration of endocrine and metabolic signaling in energy metabolism regulation. Am. J.
Physiol. Endocrinol. Metab. 2001; 280: E827–847.
12. Burgi W, Schmid K. Preparation and properties of Zn-alpha 2-glycoprotein of normal human plasma. J. Biol. Chem. 1961; 236: 1066–1074.
13. Sánchez LM, Chirino AJ, Bjorkman P j. Crystal structure of human ZAG, a fat-depleting factor related to MHC molecules. Science 1999; 283: 1914–1919.
14. Tada T, Ohkubo I, Niwa M, et al. Immunohistochemical localization of Zn-alpha 2-glycoprotein in normal human tissues. J. Histochem. Cytochem. 1991; 39: 1221–1226.
15. Todorov PT, McDevitt TM, Meyer DJ, et al. Purification and characterization of a tumor lipid-mobilizing factor. Cancer Res. 1998; 58: 2353–2358.
16. Hirai K, Hussey HJ, Barber MD, et al. Biological evaluation of a lipid-mobilizing factor isolated from the urine of cancer patients. Cancer Res. 1998; 58: 2359–2365.
17. Bing C, Bao Y, Jenkins J, et al. Zinc-alpha2-glycoprotein, a lipid mobilizing factor, is expressed in adipocytes and is up-regulated in mice with cancer cachexia. Proc. Natl. Acad.
Sci. U.S.A. 2004; 101: 2500–2505.
18. Selva DM, Lecube A, Hernández C, et al. Lower zinc-alpha2-glycoprotein production by adipose tissue and liver in obese patients unrelated to insulin resistance. J. Clin. Endocrinol.
Metab. 2009; 94: 4499–4507.
19. Gong F-Y, Zhang S-J, Deng J-Y, et al. Zinc-alpha2-glycoprotein is involved in regulation of body weight through inhibition of lipogenic enzymes in adipose tissue. Int J Obes (Lond) 2009; 33: 1023–1030.
20. Russell ST, Zimmerman TP, Domin BA, et al. Induction of lipolysis in vitro and loss of body fat in vivo by zinc-alpha2-glycoprotein. Biochim. Biophys. Acta 2004; 1636: 59–68. 21. Russell ST, Hirai K, Tisdale MJ. Role of beta3-adrenergic receptors in the action of a tumour lipid mobilizing factor. Br. J. Cancer 2002; 86: 424–428.
22. Sanders PM, Tisdale MJ. Effect of zinc-alpha2-glycoprotein (ZAG) on expression of uncoupling proteins in skeletal muscle and adipose tissue. Cancer Lett. 2004; 212: 71–81. 23. Russell ST, Tisdale MJ. Role of β-adrenergic receptors in the obesity and anti-diabetic effects of zinc-α2-glycoprotien (ZAG). Biochim. Biophys. Acta 2012; 1821: 590–599. 24. Axelsson J. The emerging biology of adipose tissue in chronic kidney disease: from fat to facts. Nephrol. Dial. Transplant. 2008; 23: 3041–3046.
25. Guebre-Egziabher F, Bernhard J, Geelen G, et al. Leptin, adiponectin, and ghrelin dysregulation in chronic kidney disease. J Ren Nutr 2005; 15: 116–120.
26. Aminzadeh MA, Pahl MV, Barton CH, et al. Human uraemic plasma stimulates release of leptin and uptake of tumour necrosis factor-alpha in visceral adipocytes. Nephrol. Dial.
Transplant. 2009; 24: 3626–3631.
27. Kalbacher E, Koppe L, Zarrouki B, et al. Human uremic plasma and not urea induces exuberant secretion of leptin in 3T3-L1 adipocytes. J Ren Nutr 2011; 21: 72–75.
28. Philipp A, Kralisch S, Bachmann A, et al. Serum levels of the adipokine zinc-α2-glycoprotein are increased in chronic hemodialysis. Metab. Clin. Exp. 2011; 60: 669–672. 29. Leal VO, Lobo JC, Stockler-Pinto MB, et al. Is zinc-α2-glycoprotein a cardiovascular protective factor for patients undergoing hemodialysis? Clin. Chim. Acta 2012; 413: 616–619. 30. Axelsson J, Aström G, Sjölin E, et al. Uraemic sera stimulate lipolysis in human adipocytes: role of perilipin. Nephrol. Dial. Transplant. 2011; 26: 2485–2491.
31. Ekman R, Johansson BG, Ravnskov U. Renal handling of Zn-alpha2-glycoprotein as compared with that of albumin and the retinol-binding protein. J. Clin. Invest. 1976; 57: 945– 954.
32. Vanholder R, De Smet R, Glorieux G, et al. Review on uremic toxins: classification, concentration, and interindividual variability. Kidney Int. 2003; 63: 1934–1943.
33. Evenepoel P, Bammens B, Verbeke K, et al. Superior dialytic clearance of beta(2)-microglobulin and p-cresol by high-flux hemodialysis as compared to peritoneal dialysis.
Kidney Int. 2006; 70: 794–799.
34. Pham NM, Recht NS, Hostetter TH, et al. Removal of the protein-bound solutes indican and p-cresol sulfate by peritoneal dialysis. Clin J Am Soc Nephrol 2008; 3: 85–90.
35. Vanholder R, Meert N, Van Biesen W, et al. Why do patients on peritoneal dialysis have low blood levels of protein-bound solutes? Nat Clin Pract Nephrol 2009; 5: 130–131.
36. Rydén M, Agustsson T, Andersson J, et al. Adipose zinc-α2-glycoprotein is a catabolic marker in cancer and noncancerous states. J. Intern. Med. 2012; 271: 414–420.
37. Gong F-Y, Deng J-Y, Zhu H-J, et al. Fatty acid synthase and hormone-sensitive lipase expression in liver are involved in zinc-alpha2-glycoprotein-induced body fat loss in obese mice. Chin. Med. Sci. J. 2010; 25: 169–175.
38. Vaziri ND, Liang K. Down-regulation of tissue lipoprotein lipase expression in experimental chronic renal failure. Kidney Int. 1996; 50: 1928–1935.
39. Vaziri ND, Liang K. Down-regulation of VLDL receptor expression in chronic experimental renal failure. Kidney Int. 1997; 51: 913–919.
40. Vaziri ND, Yuan J, Ni Z, et al. Lipoprotein lipase deficiency in chronic kidney disease is accompanied by down-regulation of endothelial GPIHBP1 expression. Clin. Exp. Nephrol. 2012; 16: 238–243.
41. Zhao H-L, Sui Y, Guan J, et al. Fat redistribution and adipocyte transformation in uninephrectomized rats. Kidney Int. 2008; 74: 467–477.
42. Zhao H-L, Sui Y, He L, et al. Lipid partitioning after uninephrectomy. Acta Diabetol 2011; 48: 317–328.
43. Olofsson LE, Olsson B, Lystig T, et al. Preliminary report: Zn-alpha2-glycoprotein genotype and serum levels are associated with serum lipids. Metab. Clin. Exp. 2010; 59: 1316–1318.
44. Mracek T, Stephens NA, Gao D, et al. Enhanced ZAG production by subcutaneous adipose tissue is linked to weight loss in gastrointestinal cancer patients. Br. J. Cancer 2011;
Figure legends
Figure 1. Uremic plasma increases ZAG protein content in 3T3-L1 adipocytes. A)
Quantification of ZAG protein content in 3T3-L1 cells incubated overnight with either 20% (v/v) fetal calf serum (Control), 20% (v/v) fetal calf serum and urea (30 mM), 20% (v/v) Healthy Volunteers (HV) plasma Pool, 20% (v/v) Chronic Kidney Disease (CKD5) plasma Pool, 20% (v/v). Data are means ± SEM for n=6-7 in each group. B) Quantification of ZAG protein content in 3T3-L1 cells incubated overnight with either 20% (v/v) fetal calf serum (Control), 20% (v/v) Healthy Volunteers (HV) plasma pool, 20% (v/v) Hemodialysis (HD) or 20% (v/v) peritoneal dialysis (PD) plasma pools. Data are means ± SEM for n=5-6 in each group. C) A high molecular weight non proteic factor of uremic plasma induces ZAG production in 3T3-L1 adipocytes. Quantification of ZAG protein content in cultured 3T3-L1 cells with either 20% (v/v) Healthy Volunteers (HV) plasma Pool, 20% (v/v) HV Pool previously denatured by Heat Shock (HS, 65°C, 30 min), 20% (v/v) Chronic Kidney Disease (CKD) plasma Pool, 20% (v/v) CKD Pool denatured by HS, 20% (v/v) CKD pool filtered in
vitro on a 10 kDa cut off dialysis membrane (Filter) or with 20% (v/v) Ultrafiltrate. Data are
means ± SEM for n=4-5 in each group. Different letters indicate a significant difference at the p<0.05 level.
Figure 2. Effects of CKD plasma on lipolysis and lipogenesis in 3T3-L1 adipocytes. (A) Basal and isoproterenol induced (B) lipolysis in 3T3-L1 cell cultures incubated overnight
with 20% (v/v) fetal calf serum (Control), 20% (v/v) Healthy Volunteers (HV) plasma Pool , 20% (v/v) Chronic Kidney Disease (CKD) plasma Pool, or 20% (v/v) hemodialysis (HD) plasma Pools.Lipolysis level was expressed as the glycerol release (µg) per gram (g) of cell protein in each culture well, in basal conditions or after isoproterenol stimulation (10µM). Data are means ± SEM for n=8-12 for basal lipolysis and n=6 for isoproterenol induced lipolysis. (C) Lipogenesis was measured in 3T3-L1 cell cultures as the incorporation of [14 C]-acetate into total neutral lipids (TNL). Data are means ± SEM for n=4-5 independent
experiments in each group. Different letters indicate a significant difference at the p<0.05 level.
Figure 3. ZAG content is increased in white adipose tissue from 5/6 nephrectomized rat and associated with fat mass loss and ectopic lipid redistribution.
(A) Quantification of ZAG protein amounts was performed by Western Blotting in epididymal white adipose tissues of sham-operated (SO) and nephrectomized (Nx5/6) rats. Quantifications of ZAG in WAT was performed by western blotting normalized to tubulin and expressed in arbitrary units (AU). Data are means ± SEM for n=6-7 in each group. (B) ZAG protein contents in WAT is correlated with proteinuria but negatively correlated with WAT weight (C). Intramuscular tissue lipid content is negatively correlated with total WAT mass (D).
Figure 4. ZAG content is increased in white adipose tissue from 5/6 nephrectomized mice fed a standard or a high fat diet.
(A) White adipose tissue accretion in SO and Nx5/6 mice fed a low or high fat diet to increase fat deposition. (B) Quantification of ZAG protein amounts was performed by Western Blotting in epididymal white adipose tissues of sham-operated (SO) and nephrectomized (Nx5/6) mice. Quantifications of ZAG in WAT was performed by western blotting, normalized to tubulin and expressed in arbitrary units (AU). Data are means ± SEM for n=6-7 in each group.
Figure 5. Schematic representation of ZAG contribution to dysmetabolism associated with chronic kidney disease.
Table 1: Baseline characteristics of healthy volunteers, CKD, haemodialysis and peritoneal dialysis patients.
Healthy volunteers CKD patients Haemodialysis Peritoneal dialysis p-value
Sex, male/female 5M/7F 3M/5F 2M/3F 2M/2F 0.801 Age, y 56.2 ± 17.3 61.6 ± 20.0 57.0 ± 18.7 66 ± 9.9 0.753 Height, m 1.65 ± 0.07 1.65 ± 0.09 1.56 ± 0.05 1.61 ± 0.02 0.156 Weight, kg 62.2 ± 10.2 65.8 ± 9.2 59.2 ± 15.6 64.5 ± 10.7 0.769 BMI, kg/m2 22.7 ± 2.6 24.2 ± 3.0 24.3 ± 3.1 24.8 ± 3.8 0.659 Creatinine, µM 71.3 ± 22.3 (a) 356.5 ± 244.9 (b) 742.3 ± 66.3 (c) 685.0 ± 187.5(c) <0.001 MDRD,ml/min.1,73m2 102 ± 30 (a) 18 ± 8 (b) Na Na <0.001 Bicarbonates, mM 25.6 ± 2.5 22.9 ± 5.2 23.0 ± 1.6 27.9 ± 1.6 0.131 Glucose, mM 5.2 ± 0.6 5.1 ± 1.3 7.0 ± 4.9 7.8 ± 3.1 0.218 Triacylglycerols, mM 1.45 ± 0.82 1.65 ± 0.44 1.78 ± 0.59 1.87 ± 1.28 0.800 HDL cholesterol, mM 0.99 ± 0.56 1.17 ± 0.40 0.96 ± 0.31 1.62 ± 0.54 0.207 LDL cholesterol, mM 2.16 ± 1.12 2.98 ± 0.68 2.63 ± 1.92 2.57 ± 0.68 0.691 CRP, mg/L 3.2 ± 2.3 11.4 ± 17.9 5.2 ± 4.6 2.9 ± 1.0 0.114 Glucose-lowering treatment,% 0 25 20 100 0.010 Lipid-lowering treatment,% 12.5 25 20 50 0.572 RAA inhibitors,% 12.5 87.5 40 75 0.011 Plasma ZAG, µg/ml 37.6 ± 23.3 85.2 ± 47.1 124.9 ± 65.3 Nd <0.001
Data are expressed as means ± one standard deviation for N=8 in each group. Means were compared with ANOVA one way test. Different letters indicates significant difference at p<0.05. Abbreviations: CKD, chronic kidney disease, RAA, renin angiotensin aldosterone. Na, not applicable, Nd not determined.
Table 2: Characteristics of non CKD patients and end-stage renal disease patients
Non-CKD (n=9) CKD stage 5 (n=7) p-value
Age, y 67.6 ± 3.5 54.7 ± 3.4 0.02* Height, m 1.71 ± 0.02 1.73 ± 0.02 0.38 Weight, kg 73.6 ± 1.9 78.1 ± 4.3 0.34 BMI, kg/m2 25.3 ± 0.5 26.1 ± 1.2 0.54 Creatinine, µM 89.7 ± 4.1 458.3 ± 39.2 <0.0001*** MDRD,ml/min.1,73m2 80 ± 5 13 ± 1 <0.0001*** Bicarbonates, mM 26.3 ± 0.9 24.0 ± 0.7 0.06 Glucose, mM 5.4 ± 0.1 5.1 ± 0.2 0.18 Triacylglycerols, mM 1.34 ± 0.14 2.12 ± 0.35 0.04* HDL cholesterol, mM 1.10 ± 0.14 0.98 ± 0.09 0.52 LDL cholesterol, mM 2.77 ± 0.28 1.48 ± 0.33 0.01* CRP, mg/L 2.5 ± 0.4 16.8 ± 11.9 0.22
Zinc alpha-2 glycoprotein (ZAG)
Plasma concentration, µg/ml 75.6 ± 25.1 129.1 ± 58.8 0.035*
scWAT content £ 0.66 ± 0.48 5.18 ± 3.32 0.021*
Data are expressed as means ± one standard deviation. Means were compared with Student t test, * p<0.05, **p<0.01,***p<0.005. Abbreviation: BMI, body mass index, CKD, chronic kidney disease, CRP, C-reactive protein, scWAT, subcutaneous white adipose tissue. £ ZAG tissue content was analyzed by western blotting as described in methods and normalized to Tubulin content. Typical blots for non-CKD and CKD patients are shown in Supplementary Figure 4.
Table 3: Characteristics and plasma ZAG concentration of obese non CKD and obese CKD patients
Non-CKD CKD stage 5 p-value
N 12 8 Age, y 61.6 ± 4.1 65.0 ± 4.3 0.585 Height, m 1.65 ± 0.1 1.61 ± 0.1 0.324 Weight, kg 78.3 ± 12.2 86.8 ± 9.4 0.132 BMI, kg/m2 30.0 ± 1.8 31.6 ± 2.2 0.091 Creatinine, µM 84.4 ± 34.1 382.6 ± 109.7 <0.0001*** MDRD, ml/min.1,73m2 84 ± 24 13 ± 2 <0.0001*** Urea, mM 7.3 ± 3.4 23.4 ± 3.4 <0.0001*** Bicarbonates, mM 26.4 ± 1.0 23.3 ± 1.4 0.09 Glucose, mM 5.5 ± 0.8 5.8 ± 1.0 0.516 Triacylglycerols, mM 1.73 ± 0.95 1.70 ± 0.82 0.951 HDL cholesterol, mM 1.06 ± 0.29 1.09 ± 0.11 0.825 LDL cholesterol, mM 2.32 ± 1.01 2.57 ± 0.96 0.671 CRP, mg/L 4.6 ± 1.9 9.1 ± 5.9 0.188 Plasma ZAG, µg/ml 28.7 ± 17.8 81.7 ± 44.6 0.002***
Data are expressed as means ± one standard deviation. Means were compared with Student t test, * p<0.05,***p<0.005. Abbreviation: BMI, body mass index, CKD, chronic kidney disease, CRP, C-reactive protein, scWAT, subcutaneous white adipose tissue, ZAG, zinc alpha-2 glycoprotein.
Supplementary materials – Pelletier et al, 2012
Supplementary methods
Membrane dialysisHealthy volunteer and CKD plasma pools were constituted as described in methods. An aliquot of each plasma pool was extensively dialyzed over a 8-‐kDa membrane (Spektra/PorBiotech, Regenerated Cellulose Dialysis membranes, MWCO: 8-‐kDa) against sterile isotonic saline (sodium chloride 0.9% w/v). In brief, 2 mL of plasma was dialyzed at +5°C against 2000 mL saline for a total of 24 h with 3 media replacement after 6, 12 and 18 h of dialysis. 3T3-‐L1 adipocytes were incubated for 16h with either native or dialyzed plasma from the same plasma pools and ZAG content was measured using western blotting.
Comparison of serum and plasma
After an overnight fast, blood samples were obtained by venipuncture from 5 CKD-‐5 patients. For plasma preparation, blood was collected on heparinized tubes. Blood samples were centrifuged at 3,500 × g for 10 min to isolate plasma supernatant which were snap frozen in liquid nitrogen. To prepare serum, blood was collected on covered test tubes and allowed to clot for 3h at 4°C. The clot was removed by centrifuging at 1,000 x g for 10 min and the serum was collected and snap frozen in liquid nitrogen. 3T3-‐L1 adipocytes were incubated for 16h with either plasma pool or serum pool from the same patients and ZAG content was measured using western blotting.
Ultrafiltration
A patient with stage 3 chronic kidney disease and congestive heart failure (see the patient data in Supplementary Table 5) undergoing weekly ultrafiltration (UF) for fluid overload was recruited. UF treatment was performed by using a filter (TORAY TF-‐2.1 SL, Japan) inserted into a dialysis generator (PRISMAFLEX, Gambro, Switzerland) and connected to a double lumen Y-‐shaped catheter positioned in a jugular vein (Ash Plit Cath, medCOMP, France). A peristaltic
pump was regulated to maintain a blood flow of 320 ml/min within the circuit. No dialysate flew by the opposite side of the filter. A loading bolus of 1,000 IU of heparin was administered inside the circuit before allowing blood to pass into the filter, and then a continuous heparin infusion rate of 500 IU/h was maintained during the UF session. The body weight of the patient fell from 57.8 kg to 55.6 kg after UF corresponding to an ultrafiltration of 2.2L. At the end of the ultrafiltration session, ultrafiltrate was collected and stored at -‐20°C until use. 3T3-‐L1 adipocytes were incubated for 16h with either plasma or ultrafiltrate and ZAG content was measured using western blotting.
Effect of inflammatory cytokines
3T3-‐L1 adipocytes were incubated for 16h with control plasma pool supplemented with human TNF-‐alpha (50 ng/ml, hBA-‐158, SC-‐4564, Santa-‐Cruz, Heidelberg, Germany) or human interleukin-‐6 (10 ng/ml, hBA-‐184, SC-‐4597, Santa-‐Cruz) and ZAG content was measured using western blotting.
Diet induced obesity in mice
Male C57Bl6 mice were purchased (Janvier SA) at 3 weeks of age. Mice were maintained under standard conditions at 22°C and a 12 h:12 h dark–light cycle with food and water provided ad libitum. Animals were randomly divided into two groups: sham-‐operated (SO) and nephrectomized (Nx5/6) and mice were nephrectomized as described in Methods. Mice were either fed a standard rodent chow diet containing (w/w) 16.4% protein, 4.0% fat, and 48.5% carbohydrates (2016C, Harlan, France) or a commercial high-‐fat diet (HFD) containing (w/w) 23.5% protein, 34.3 % fat, and 27.3% carbohydrates (TD06414, Harlan). Energy content of standard chow and HFD as determined by calculation from ingredient analysis was 12.6 and 21.3 kJ/g, respectively. After 4 weeks, mice were weighed and anesthetized with sodium pentobarbital (60 mg/kg ip, CEVA Santé Animale, France). Naso-‐anal length was measured and Lee index (an index of adiposity in rodent) was calculated as the cubic root of body weigth divided by naso-‐anal
length. Epididymal (eWAT), retroperitoneal (rWAT), and subcutaneous inguinal (scWAT) white adipose tissue, were rapidly dissected out according to defined anatomical landmarks, cleaned, weighed to the nearest milligram and snap frozen in liquid nitrogen. The heart, liver, kidney(s) and gastrocnemius muscle were dissected out, blotted dry and weighted to the nearest milligram. The eWAT ZAG content was analyzed by western blotting as described in Methods.
Supplementary Figure Legends
Supplementary Figure 1. Uremic plasmas as well as uremic sera increase ZAG protein content in 3T3-‐L1 adipocytes. Quantification of ZAG protein
content in 3T3-‐L1 cells incubated overnight with either 20% (v/v) fetal calf serum (Control), 20% (v/v) Chronic Kidney Disease plasma Pool (Plasma) or, 20% (v/v) Chronic Kidney Disease sera Pool (Serum). Note that plasmas and sera were obtained from the same CKD patients. Data are means ± SEM for n=6 in each group. Different letters indicate a significant difference at the p<0.05 level.
Supplementary Figure 2. ZAG protein content is increased in subcutaneous abdominal white adipose tissue biopsies from CKD stage-‐5 patients: typical blots. ZAG protein content measured by Western Blotting and normalized to
tubulin, in subcutaneous white adipose tissue biopsies of non-‐CKD patients and CKD stage 5 patients.
Supplementary Figure 3. ZAG protein content is increased in subcutaneous white adipose tissue biopsy from a non-‐CKD and a CKD stage-‐5 obese patients. ZAG protein content measured by Western Blotting and normalized to
tubulin, in subcutaneous white adipose tissue biopsies.
Supplementary Figure 4. The inflammatory cytokines TNF-‐alpha (TNF-‐ alpha, 50 ng/ml) and interleukin-‐6 (IL-‐6, 10 ng/ml) did not increase ZAG protein content in 3T3-‐L1 adipocytes. Quantification of ZAG protein content in
3T3-‐L1 cells incubated overnight with 20% (v/v) non-‐CKD plasma supplemented with 50ng/ml human TNF-‐alpha or 10ng/ml IL_6. Data are means ± SEM for n=4 in each group. No difference was found to be significant at the p<0.05 level.
Supplementary Figure 5. Membrane dialyzed uremic plasma did not increase ZAG protein content in 3T3-‐L1 adipocytes. Control and uremic
plasma were extensively dialyzed against saline using regenerated cellulose membrane (Molecular Weigth Cut Off: 8-‐kDa). Quantification of ZAG protein content in 3T3-‐L1 cells incubated overnight with either 20% (v/v) fetal calf serum (SVF), 20% (v/v) native or dialyzed plasma pool from healthy volunteers or CKD patients. Data are means ± SEM for n=6 in each group. Different letters indicate a significant difference at the p<0.05 level.
Supplementary Figure 6. Plasma ultrafiltrate from a CKD patient did not increase ZAG protein content in 3T3-‐L1 adipocytes. Quantification of ZAG
protein content in 3T3-‐L1 cells incubated overnight with either 20% (v/v) fetal calf serum (SVF), 20% (v/v) plasma or 20% (v/v) of ultrafiltrate from a CKD patient. Data are means ± SEM for n=6 in each group. Different letters indicate a significant difference at the p<0.05 level. Patient data are shown in
Supplementary Table 5.
Supplementary Tables
Supplementary Table 1: Cell viability.
Mediums Control Urea Healthy Volunteer pool CKD pool MTT, % 100 ± 5.74 (a) 98.81 ± 3.72 (a,b) 88.39 ± 4.16 (d) 80.89 ± 4.08 (c) LDH, % 100 ± 8.08 (a) 91.94 ± 13.91 (a) 99.12 ± 17.17(a) 69.27 ± 8.66(b) Results are expressed as means ± one standard deviation for N=3-‐6. Means were compared with ANOVA One Way test. Different letters indicate a significant difference at p<0.05.
Supplementary Table 2:
Characteristics of sham-operated and Nx5/6 rats.
Sham-operated Nx 5/6 p-value
Indexes of renal function
24h-Diuresis, ml 17.60 ± 4.30 28.10 ± 1.60 0.086 Plasma urea, mg/dL 34.70 ± 3.10 89.10 ± 12.10 0.028 Proteinuria, mg/24h 7.99 ± 0.57 60.10 ± 13.50 <0.001 Biometric data Body weight, g 377.0 ± 12.0 365.0 ± 17.0 0.171 Body length, cm 23.4 ± 0.2 23.5 ± 0.3 0.846 Lee index 308.0 ± 2.0 302.0 ± 3.0 0.081 Tissue weights Liver, g 12.22 ± 0.43 12.61 ± 0.67 0.573 Kidneys, g 2.11 ± 0.12 1.36 ± 0.11 <0.0001 Gastrocnemius, g 2.03 ± 0.08 2.10 ± 0.08 0.568 eWAT, g 9.47 ± 1.15 5.14 ± 2.21 0.004 rWAT, g 8.57 ± 1.12 3.95 ± 1.60 0.001 scWAT, g 4.33 ± 0.52 2.13 ± 0.39 0.002 Total WAT, g 30.91 ± 3.30 17.41 ± 2.54 0.006
Data are expressed as means ± SEM for N=7-8 in each group. Means were compared using Student t test and when appropriated Welch correction for variance inhomogeneity. Difference are considered significant at the p<0.05. Abbreviation: BW, body weight, eWAT, epididymal WAT, rWAT, retroperitoneal WAT, scWAT, subcutaneous (inguinal) WAT, WAT, White adipose tissue.
Supplementary Table 3:
Biometric data for sham-operated and nephrectomized mice
Chow diet High fat diet ANOVA-2
Sham Nx 5/6 Sham Nx 5/6 Treatment Diet Interaction
N 7 8 11 10 BW, g 24.5 ± 0.2 23.5 ± 0.3 28.7 ± 0.7 25.3 ± 0.4 <0.001 <0.001 0.009 Body length, cm 9.0 ± 0.1 9.1 ± 0.1 9.4 ± 0.1 9.3 ± 0.1 0.747 <0.001 0.117 Lee index 323 ± 3 315 ± 2 325 ± 3 314 ± 2 0.002 0.469 0.266 Liver, mg 1201 ± 33 1065 ± 104 1145 ± 33 1048 ± 29 0.079 0.571 0.764 Heart, mg 129 ± 3 136 ± 3 130 ± 4 131 ± 3 0.182 0.595 0.342 Kidneys, mg 323 ± 5 133 ± 5 358 ± 8 138 ± 8 <0.001 0.01 0.529 Gastrocnemius, mg 131 ± 3 136 ± 3 130 ± 4 131 ± 3 0.331 0.005 0.140 eWAT, mg 307 ± 13 196 ± 17 865 ± 87 497 ± 40 <0.001 <0.001 0.011 rWAT,mg 77 ± 7 17 ± 3 301 ± 47 106 ± 16 <0.001 <0.001 0.050 scWAT, mg 140 ± 19 84 ± 8 404 ± 29 217 ± 12 <0.001 <0.001 0.004
Data are mean ± SEM. Data were compared using Student t test and when appropriated Welch correction for variance inhomogeneity. Difference where considered significant at the P<0.05 level. Abbreviations: BW, body weight, eWAT, epididymal WAT, rWAT, retroperitoneal WAT, scWAT, subcutaneous (inguinal) WAT, WAT, white adipose tissue.
Supplementary Table 4
Clearance results for peritoneal dialysis patients
Weekly residual, L 40.18 ± 5.64 Weekly dialysate, L 34.18 ± 11.28 Weekly total, L 74.36 ± 8.04 Weekly Kt/V 2.20 ± 0.01*
Data are means SD for N=4. *KDOQI guidelines for peritoneal dialysis adequacy: Kt/V>1.7.
Supplementary Table 5. Baseline characteristics of the ultrafiltration CKD patient Sex M Age, y 53 Height, m 1.66 Weight, kg 57.8 BMI, kg/m2 19.2 Creatinine, µM 155 MDRD, ml/min.1,73m2 44 Urea, mM 19.5 Proteins, g/L 84 Hematocrit, % 37 Hemoglobin, g/L 118 Glucose, mM 9.2 CRP, mg/L 18.2