HAL Id: hal-00607257
https://hal.archives-ouvertes.fr/hal-00607257
Submitted on 8 Jul 2011HAL is a multi-disciplinary open access archive for the deposit and dissemination of sci-entific research documents, whether they are pub-lished or not. The documents may come from teaching and research institutions in France or abroad, or from public or private research centers.
L’archive ouverte pluridisciplinaire HAL, est destinée au dépôt et à la diffusion de documents scientifiques de niveau recherche, publiés ou non, émanant des établissements d’enseignement et de recherche français ou étrangers, des laboratoires publics ou privés.
Optimization of the Contrast Tissue Ratio in Ultrasound
Contrast Imaging by an Adaptive Transmit Frequency
Sébastien Ménigot, Jean-Marc Girault, Iulian Voicu, Anthony Novell
To cite this version:
Sébastien Ménigot, Jean-Marc Girault, Iulian Voicu, Anthony Novell. Optimization of the Contrast Tissue Ratio in Ultrasound Contrast Imaging by an Adaptive Transmit Frequency. First Mediter-ranean Congress on Acoustics 2010, Oct 2010, Salé, Morocco. �hal-00607257�
1
OPTIMIZATION OF THE CONTRAST TISSUE RATIO IN
ULTRA-SOUND CONTRAST IMAGING BY AN ADAPTIVE TRANSMIT
FRE-QUENCY
Sébastien Ménigot
1, Jean-Marc Girault
1, Iulian Voicu
1and Anthony Novell
11
Université François Rabelais de Tours, Inserm U930, CNRS ERL 3106, Tours, France / jean-marc.girault@univ-tours.fr
Abstract
Conventionnal ultrasound contrast imaging systems use a fixed transmit frequency. However it is known that the insonified medium (microbubbles) is time-varying and therefore an adapted time-varying excitation is expected. We suggest an adaptive imaging technique which selects the optimal transmit frequency that maximizes the contrast tissue ratio (CTR). The method is proposed with the contrast imaging and the harmonic contrast imaging.
Simulations were carried out for encapsulated microbubbles of 2µm-radius by considering the modified Rayleigh-Plesset equation for various pressure levels (80 kPa up to 420kPa).
In vitro experiments have been carried out using using a 2.25 MHz transmitter transducer and
using a programmable waveform.
We show, through experiments, that our adaptive imaging technique increases the CTR of 2 dB compared to the standard method looking at the central frequency.
By proposing a close loop system whose frequency adapts itself with the perfused media, throughout the examination, the optimization system adapt itself to the bubble population to seek the best trade-off between the bubble response and the transducer bandwidth.
1. Introduction
Ultrasound (US) contrast imaging is being investigated for tissue function and for targeted therapeutic applications with microbubble ultrasound contrast agents (UCA). Currently technical challenge consists in seeking which US excitations should make possible the optimization of the contrast tissue ratio (CTR) :
b u b b les B M F E C T R E . (1)
with Ebubbles the microbubbles backscattered power and EB M F the tissue backscattered power. This ratio (eqn. 1) can be maximized if the microbubbles backscattered power is maximized :
m ax(C T R) m ax(Ebubbles). (2)
First Mediterranean Congress on Acoustics (MCA2010), Salé, Morocco, 28-30 October 2010
2
We tackled the problem in a simple way by proposing an adaptive imaging technique which seeks the transmit frequency that maximizes the backscattered power. The use of an adaptive tech-nique is justified by the fact that:
1. during the clinical examination, the insonified medium perfused by the microbubbles is a non-stationary medium (the concentration and the size of bubbles change...) ; 2. the pressure level is unknown because of the diffraction and attenuation effects which
vary from one patient to another ;
3. the size and the distribution of the UCA are not precisely known and can differ from one sample to another.
To overcome these problems, that is to disregard these unknown factors, it seemed more judi-cious to propose an US excitation whose frequency is selected in an adaptive way.
2. Methods and Materials
2.1 Methods
The optimization aims to maximize the power of the backscattered signal by an iterative me-thod. This optimization was applied in two imaging methods : standard imaging and pulse inversion (PI) imaging [1].
In the case of standard imaging, the principle consists in first measuring the backscattered power for the echo from a sinus wave excitation first and secondly in seeking for the optimal trans-mit frequency by maximizing this power.
In the case of the pulse inversion imaging, the principle consists in measuring the sum of the both response from 2 inverted pulse first and in seeking for the optimal transmit frequency by max-imizing thispower of the sum.
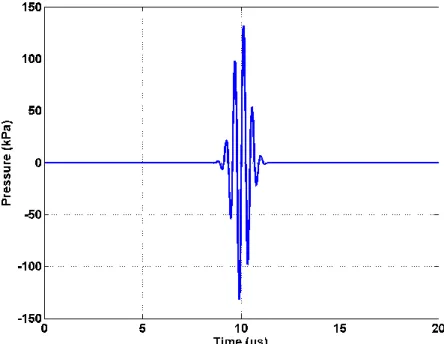
The sinus pulse has been modulated with a Gaussian window(fig. 1) [2] to delete the high fre-quency components responsible of the microbubble destruction. The number of cycles has been fixed to 4, whereas the amplitude has been corrected so that the power level was the same for every frequency.
3
The gradient algorithm based on the gradient descent [3] has been chosen to find the frequen-cy of the transmit signal which maximizes the backscattered power. This choice was obvious be-cause the analytic expression of power according to frequency is unknown.
The principle is to maximize the power with a recurrence relation.
fk1 fk k E f( k) (3)
The gradient is estimated with the discrete gradient. This ratio is nearly null for small power in comparison with the frequency and thus the parameters were normalized.
1 1 ( ) k k k k k E E E f f f (4)
For every sign change of two successive gradients, k is divided by two.
2.2 Materials
2.2.1 Microbubbles
The ultrasound contrast medium was composed of Sonovue™ microbubbles. The mean di-ameter is 4.5 µm [4] and the shell thickness
e
S
d is 1 nm [5]. As for the mechanical shell properties, the shear modulus GS is 46 MPa [6] and the shear viscosity is 1 Pa·s.
2.2.2 Numerical simulations
Numerical simulations for encapsulated contrast bubbles were resolved, using Bubblesim[7], from the modified Rayleigh-Plesset equation. The Sonovue™ properties were used for the micro-bubbles parameters.The microbubble echo was computed from only one microbubble immersed in blood. The transducers effects have been considered. Each transmit and received signals were fil-tered by the bandwidth of the transmit and the received transducers respectively.
2.2.3 Acoustical Measurements
Each method was compiled using Matlab® (Mathworks, Natick, MA). The resulting excita-tion signal was transmitted through a GPIB port (Naexcita-tional Instruments, Austin, TX) to an arbitrary function generator (33220A, Agilent, Palo Alto, CA). The signal was then amplified using a power amplifier (Amplifier Research 150A100B, Souderton, PA) and transmitted to a 2.25 MHz PZT sin-gle element (Sofranel, Sartrouville, France) focused at 55 mm and with a bandwidth of 74% (fig. 2).
First Mediterranean Congress on Acoustics (MCA2010), Salé, Morocco, 28-30 October 2010
4
Figure 2. Bandwidth of transducers.
Responses of a 1/2000 diluted solution of Sonovue™ microbubbles (Bracco Research, Gene-va, Switzerland) were measured by a 3.5 MHz PZT single element transducer with a bandwidth of 63% (fig. 2) also focused at 55 mm and used in receive mode.
The first transducer was used to transmit the signal, whereas the second wich was placed per-pendicularly was used to receive the microbubbles echo. This position avoided direct transmission . Measured echoes were amplified by 30 dB (Panametrics, Sofranel, Sartrouville, France) and then visualized on a digital oscilloscope (Tektronix, Beaverton, OR). Signals were transferred to a personal computer through a GPIB port for further analysis. Finally, each signals were compensated by received transducer bandwidth.
The backscattered power was computed from a linear combination of twenty signals to cancel out the motion of microbubbles. For each iterations, twenty pulses were transmitted and twenty sig-nals were received. With a principal component analysis (PCA), a new received signal which allows to deduce the backscattered power, is computed.
To deduce the contrast tissue ratio (CTR), the microbubbles were injected in a blood mimick-ing fluid(BMF) "`EU-DFS-BMF-ver.1.2"' (Dansk Fantom Service, Jyllmimick-inge, Denmark). For each frequency, the BMF received power (without microbubbles) was determined.
3. Results
3.1 Simulations
The first simulations allowed us to know the function at maximizing. The next simulation op-timized adaptively the backscattered power in standard imaging and in pulse inversion imaging, respectively.
In standard imaging, to know the evolution power according to the frequency, a microbubble has been stimulated with 4 cycles and the backscattered signal has been computed for different pressures.
5
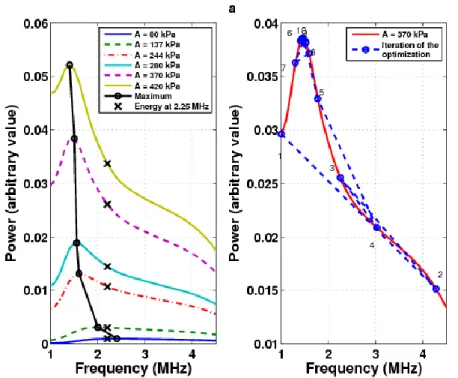
Figure 3. Power according to the frequency for a 2-microns microbubble in standard imaging.
The frequency which allows to obtain a maximum power varies with the pressure: for a high pressure, the frequency is lower (fig. 3). From the appearance of power, the initial frequencies for the algorithms have been chosen to find the global maximum.
The methods was applied with three signals of 244 and 370 kPa maximal pressure.
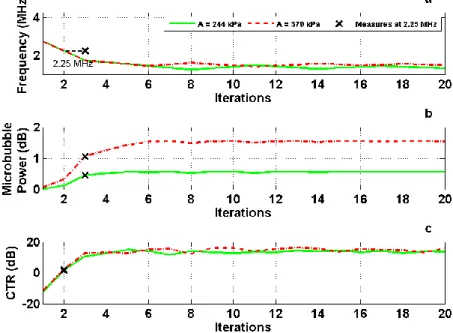
Figure 4. Simulation : Gradient ascent for a 2-microns microbubble in the standard imaging.
The backscattered power was stable and maximize after twenty iterations. For each pressure, the optimal frequency is different(1.6 MHz and 1.39 MHz respectively for 244 and 370 kPa), which was shown by the power according to the frequency.
First Mediterranean Congress on Acoustics (MCA2010), Salé, Morocco, 28-30 October 2010
6
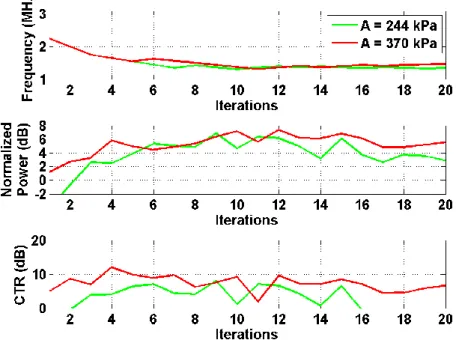
Figure 5. Simulation : Gradient ascent for a 2-microns microbubble in the pulse inversion imaging.
In the case of the PI imaging, the methods can optimize the contrast until 14dB. The optimal frequencies were 1.53 MHz and 1.37 MHz respectively for 244 and 370 kPa .
3.2 Experiments
A cloud of microbubbles immersed in BMF has been stimulated with two different pressures (244 and 370 kPa).
Figure 6. Experiment with gradient ascent in the standard imaging.
The optimal frequency is different according to the pressure(1.4 MHz and 1.2 MHz respec-tively for 244 and 370 kPa) in standard imaging. The CTR can reach 6 dB.
7
Figure 7. Experiment with gradient ascent in the pulse inversion imaging.
The backscattered power was optimized and stable after around ten iterations. The optimal frequency is different according to the pressure(1.45 MHz and 1.3 MHz respectively for 244 and 370 kPa) in standard imaging. The CTR can reach 11 dB.
4. Discussions
The backscattered power has been optimized in standard imaging and PI imaging. Our method was not dependant on the imaging method. The optimal frequency was different according to the pressure and the imaging method.
The optimal frequencies depend on the transmitted pressure. The backscattered power accord-ing to the frequency shows that the maximal power shifts forward the low frequency when the pres-sure increases. The simulations and the experiments optimal frequencies (for the highest prespres-sure) are lower than these ones for the lowest pressure. The optimal frequencies obtained in simulation are near to these obtained in experiments.
The CTR is optimized with the maximization of backscattered power.
The experimental results are not exactly identical because of the non-stationarity of micro-bubbles. To cancel their motion, we have repeated the experiment. But a high number of repetition and a high value of iterations number could destroy the microbubbles and thus the power could de-crease. A trade-off must be found to avoid the destruction of the microbubbles.
5. Conclusion
The optimization allows to maximize the backscattered power and thus to maximize the CTR. These methods allow to find the optimal frequency adapted to microbubbles in standard imaging and in harmonic imaging. However, these results could be improved if the tissue backscattered power is minimized.
We can carry on adapting our method with a ultrasound scanner.
Acknowledgement
First Mediterranean Congress on Acoustics (MCA2010), Salé, Morocco, 28-30 October 2010
8
This work was supported by Agence Nationale de la Recherche (Project ANR 07, Tecsan 015, MONitoring response to THERapy with a novel ultrasound technology).
REFERENCES
[1] D. Simpson, C. T. Chin and P. Burns. “Pulse inversion Doppler: a new method for detecting nonlinear echoes from microbubble contrast agents”, IEEE Transactions on Ultrasonics
Ferroelectrics And Frequency Control, Ultrasonics, Ferroelectrics and Frequency Control,
46, 372-382 (1999).
[2] F. Tranquart, J.-M. Correas, and A. Bouakaz. “Échographie de contraste, Méthodologie et applications cliniques”, Springer, 2007.
[3] B. Widrow and S. Stearns. “Adaptive Signal Processing”, Prentice Hall, 1985.
[4] H. J. Vos, F. Guidi, E. Boni, and P. Tortoli, “Acoustical investigation of freely moving single microbubbles,” Proceedings of IEEE Ultrasonics Symposium, 755–758 (2005).
[5] K. Chetty, C. Sennoga, J. Hainal, R. Eckersley, and E. Stride. “P1f-4 high speed optical observations and simulation results of lipid based microbubbles at low insonation pressures,” Proceedings of IEEE Ultrasonics Symposium, 1354–1357 (2006).
[6] H. Vos, F. Guidi, E. Boni, and P. Tortoli. “Method for microbubble characterization using primary radiation force,” IEEE Transactions on Ultrasonics, Ferroelectrics and Frequency
Control, 54, 1333–1345 (2007).
[7] L. Hoff. “Acoustic Characterization of Contrast Agents for Medical Ultrasound Imaging”, Kluwer Academic, 2001.